Identification of Splenic Reservoir Monocytes and Their Deployment to Inflammatory Sites (original) (raw)
. Author manuscript; available in PMC: 2010 Jan 7.
Published in final edited form as: Science. 2009 Jul 31;325(5940):612–616. doi: 10.1126/science.1175202
Abstract
A current paradigm states that monocytes circulate freely and patrol blood vessels but differentiate irreversibly into dendritic cells (DCs) or macrophages upon tissue entry. Here we show that bona fide undifferentiated monocytes reside in the spleen and outnumber their equivalents in circulation. The reservoir monocytes assemble in clusters in the cords of the subcapsular red pulp and are distinct from macrophages and DCs. In response to ischemic myocardial injury, splenic monocytes increase their motility, exit the spleen en masse, accumulate in injured tissue, and participate in wound healing. These observations uncover a role for the spleen as a site for storage and rapid deployment of monocytes and identify splenic monocytes as a resource that the body exploits to regulate inflammation.
Protection of injured or infected tissue involves migratory leukocytes (1–3). Among them are blood monocytes, which consist of at least two functionally distinct subsets (4, 5). Ly-6Chigh (Gr-1+) monocytes are inflammatory and migrate to injured (6, 7) or infected (8–10) sites but also propagate chronic diseases (11–13). Ly-6Clow (Gr-1−) monocytes patrol the resting vasculature (14), populate normal (15) or inflammatory sites (14), and participate in resolution of inflammation (7).
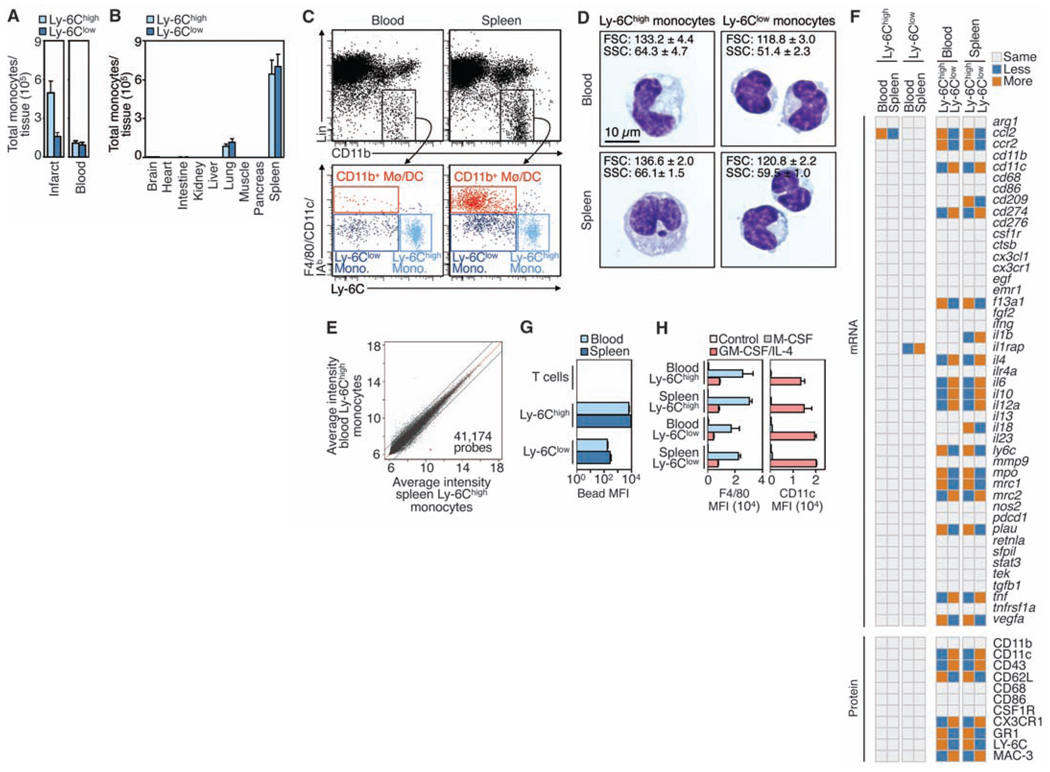
Tissue repair after myocardial infarction (MI) requires coordinated mobilization of both subsets: first, Ly-6Chigh monocytes digest damaged tissue; second, Ly-6Clow monocytes promote wound healing (7). We observed that the ischemic myocardium accumulates Ly-6Chigh monocytes in numbers that exceed their availability in circulation (Fig. 1A), which intrigued us. Although the bone marrow produces and contains numerous (pro)monocytes (16), we sought to identify compartmental reservoirs of extramedullary monocytes, as these could accommodate the demands of rapid-onset inflammation.
Figure 1.
The resting spleen contains a large reservoir of bona fide monocytes. (A) Total number of Ly-6Chigh and Ly-6Clow monocytes in the infarcted myocardium and (2 ml) peripheral blood (means ± SEM, n = 9 to 15). Monocytes were identified as CD11bhigh, Linlow, and (F4/80, I–Ab, CD11c)low. Lin refers to the combination of CD90, B220, CD49b, NK1.1, and Ly-6G monoclonal antibodies. (B) Total monocyte number retrieved from different tissues (means ± SEM, n = 3 to 5). (C) Flow cytometric analysis of blood and splenic Ly-6Chigh and Ly-6Clow monocytes, as well as CD11b+ macrophages and DCs (Mø/DCs) (n = 5). (D) Cytospin preparations of Ly-6Chigh and Ly-6Clow monocytes from blood and spleen. Insets indicate forward (FSC) and side (SSC) scatters identified by flow cytometry (means ± SEM, _n_=3). (E) Microarray analysis of Ly-6Chigh monocytes from blood and spleen. Data depict the average log2– based intensity of the same probe across four replicates. Also refer to tables S1 and S2. (F) Expression of 45 genes (by quantitative reverse transcription polymerase chain reaction) and 11 proteins (by flow cytometry) for Ly-6Chigh and Ly-6Clow monocytes in blood and spleen (n = 4). Also refer to table S3. (G) Ex vivo phagocytosis of beads by Ly-6Chigh and Ly-6Clow monocytes and T cells (control) from blood and spleen [mean fluorescent intensity (MFI) ± SEM, _n_=3]. (H) In vitro differentiation of blood and splenic Ly-6Chigh and Ly-6Clow monocytes to macrophages (F4/80high) and DCs (CD11chigh) in response to macrophage colony-stimulating factor (M-CSF) and granulocyte-macrophage CSF (GM-CSF) + interleukin-4 (IL-4), respectively (MFI ± SEM, n = 3 to 9). Data pool at least three independent experiments [(A) and (H)], or are from one experiment representative of at least three independent experiments [(C) and (D)].
First, we screened candidate tissues for the presence of monocyte-like cells (17). Monocytes express CD11b and CD115 and are negative or low for CD90, B220, CD49b, NK1.1, and Ly-6G surface proteins. They are distinct from macrophages and dendritic cells (DCs) on the basis of the F4/80 glycoprotein, CD11c, and major histocompatibility complex molecule I–Ab. Of all organs profiled, only the spleen contained cells that met these criteria and that were present in large quantities. The population included Ly-6Chigh and Ly-6Clow subtypes in ratios similar to those in the blood (Fig. 1, B and C, and fig. S1).
The spleen's major known functions are removal of aging erythrocytes and recycling of iron, elicitation of immunity, and supply of erythrocytes after hemorrhagic shock (18). The presence of numerous monocytes in the spleen seems paradoxical, because monocytes are distinguished from lineage descendants on the basis of residency: Monocytes are considered circulating, whereas macrophages and DCs are tissue-resident and predominantly sessile (5, 14, 19). We therefore conducted additional experiments to characterize the monocyte-like cells in the spleen.
We found that splenic monocytes resembled their blood counterparts morphologically: Ly-6Chigh monocytes were larger than Ly-6Clow monocytes, and both subsets had kidney- or horseshoe-shaped nuclei (Fig. 1D). Ly-6Chigh monocytes in blood and spleen had essentially indistinguishable transcriptomes (Fig. 1E and tables S1 and S2). Refined mRNA and protein analysis validated this similarity (Fig. 1F), although, as expected, Ly-6Chigh monocytes differed from their Ly-6Clow counterparts (5) (Fig. 1F and table S3). Splenic Ly-6Chigh and Ly-6Clow monocytes had phagocytic functions similar to those of their blood counterparts (Fig. 1G) and differentiated comparably into macrophages or DCs in vitro (Fig. 1H). We therefore concluded that the spleen contains a population of bona fide monocytes that coexists with, but is different from, macrophages and DCs and that outnumbers blood monocytes.
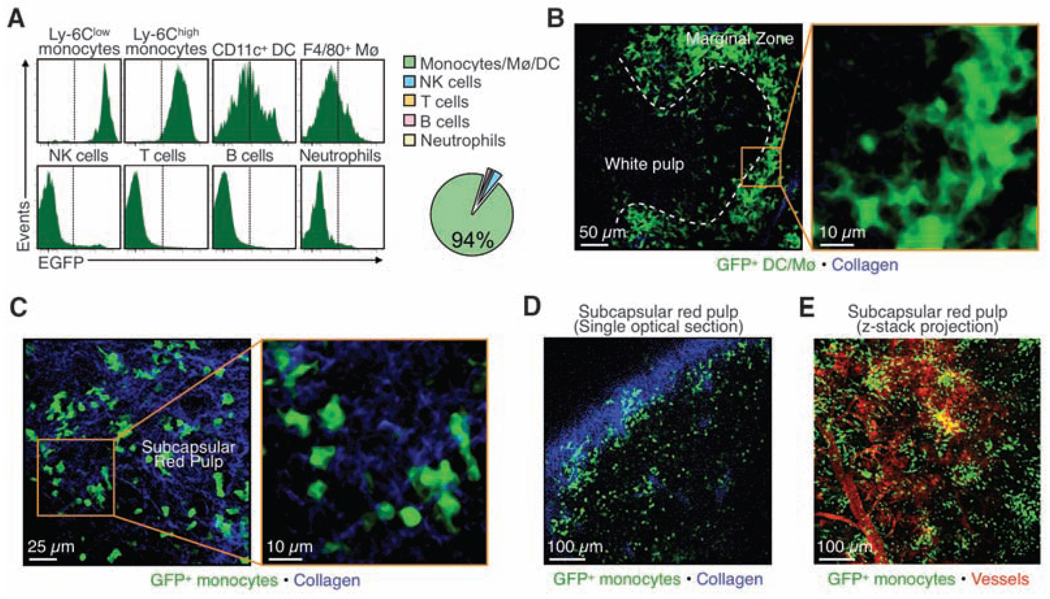
To determine where monocytes reside in the spleen, we used Cx3cr1gfp/+ mice in which nearly all fluorescent splenocytes are monocytes or their lineage descendents (Fig. 2A and figs. S2 and S3). We detected dense populations of green fluorescent protein–positive (GFP+) cells in two regions, the marginal zone and the subcapsular red pulp. As expected, cells in the marginal zone were mostly macrophages and DCs (18): They were large and morphologically irregular; F4/80high or CD11chigh, respectively; and localized around the white pulp (Fig. 2B, fig S3, and movie S1). The fluorescent cells in the subcapsular red pulp were mostly monocytes: They were devoid of dendrites; had kidney- or horseshoe-shaped nuclei; were CD11b+ and F4/80−/low but CD11c−; and were arranged in clusters of ~20 to 50 cells along the perimeter of the organ (Fig. 2, C to E, fig. S3, and movies S2 and S3). They clustered mostly in the reticular fiber–rich pulp cords, just as iron-recycling CD163+ macrophages do (20) (fig. S3). Also, intravital microscopy and parabiosis experiments revealed that splenic monocytes resided in the spleen, rather than simply passed through the spleen within blood (fig. S4 and S5).
Figure 2.
Splenic monocytes cluster in the subcapsular red pulp. (A) Histograms depict flow cytometric analysis of GFP fluorescence of splenic leukocytes in Cx3cr1gfp/+ mice (n = 3). The pie chart shows the relative proportions of various GFP+ populations. Also refer to figs. S2 and S3. (B and C) Multiphoton microscopy micrographs of Cx3cr1gfp/+ mice show GFP+ Mø/DCs (green) in the marginal zones (B) and GFP+ monocytes (green) in the subcapsular red pulp (C). Collagen fibers appear in blue. (D) A single optical section shows GFP+ monocytes (green) in the subcapsular red pulp. The dense collagen network (blue) of the splenic capsule indicates the boundary of the organ. (E) An intravital micrograph of the spleen subcapsular red pulp shows GFP+ monocytes (green) organized in clusters and topographically distinct from blood vessels (red). All data are from one experiment representative of at least two independent experiments.
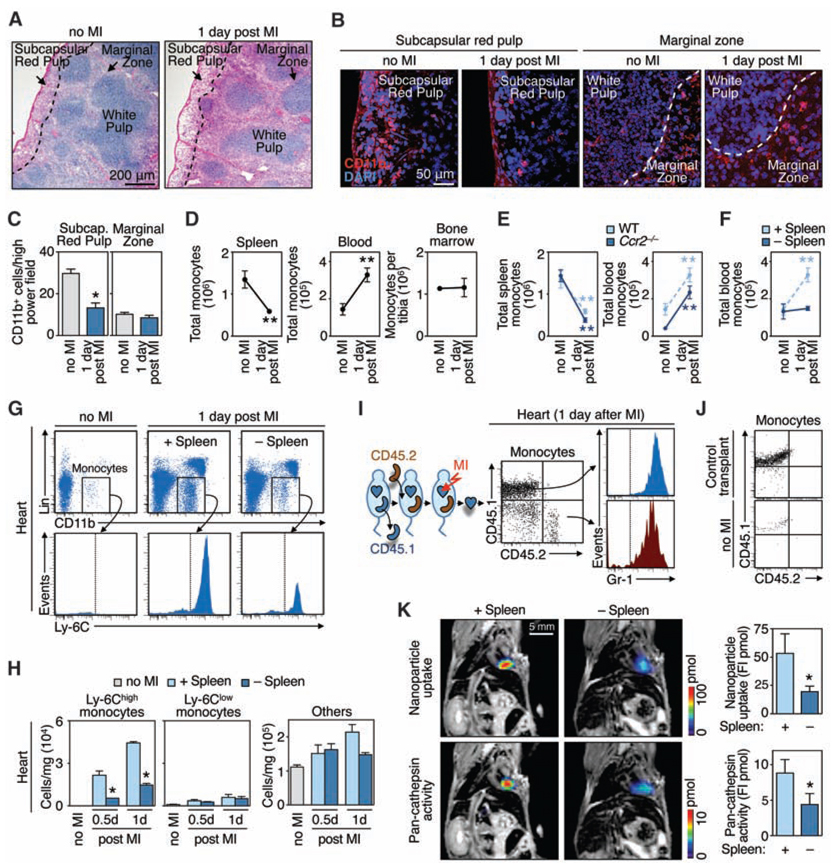
A hallmark of a reservoir population is its ability to deploy to distant sites. Thus, we tested whether splenic Ly-6Chigh monocytes are mobilized in response to surgically induced ischemia of the myocardium. One day after coronary ligation, we observed reduced numbers of monocytes in the subcapsular red pulp of the spleen (Fig. 3, A to C) that could not be attributed to local cell differentiation or death (fig. S6) and, therefore, indicated exit. Entire organ enumeration after MI revealed monocyte loss in spleen, gain in blood, but no change in the bone marrow (Fig. 3D and fig. S6), which suggested mobilization of splenic, but not bone marrow, monocytes after tissue injury.
Figure 3.
Splenic reservoir monocytes emigrate from the subcapsular red pulp and populate inflammatory sites. (A) Splenic sections from mice without MI and 1 day after MI stained with hematoxylin and eosin. (B) Splenic sections stained with CD11b-specific antibodies (red) and 4′,6′-diamidino-2-phenylindole (DAPI) (blue) depict the subcapsular red pulp and the marginal zone from mice without MI and 1 day after MI. (C) Enumeration of CD11b+ cells in the subcapsular red pulp and marginal zone (means ± SEM, n = 10 high-power fields). (D) Total number of monocytes in the spleen, blood, or bone marrow (tibia) in control mice (no MI) or 1 day after MI (means ± SEM, n = 6 to 15). (E) Total number of monocytes in the spleen or blood in wild-type (WT) and _Ccr2_−/− mice in response to MI (n = 3 to 6). (F) Total number of blood monocytes in splenectomized animals (−Spleen) and sham-operated controls (+Spleen) without MI or 1 day after MI (n = 3 to 6). (G and H) Accumulation of cells in heart in the same groups of mice as measured by flow cytometry [(G), n = 3] or by counts per mg tissue [(H), means ± SEM, n = 9]. (I) Accumulation of monocyte subsets originating exclusively from spleen as measured by flow cytometry. Dot plots (CD45.1 versus CD45.2) of gated monocytes and histograms (Gr-1) of each positive population. (J) CD45.1 versus CD45.2 profile of gated monocytes in a mouse receiving a control transplant (pancreas) and in a mouse not subjected to MI. Also refer to fig. S7. (K) FMT-MRI of in vivo phagocytic and proteolytic activities in infarcts. Fluorochrome concentration is shown in the infarcted area, on the basis of MRI-derived anatomy (n = 6). FI, fluorescence intensity. *P < 0.05; **P < 0.005. Data pool at least three independent experiments (D to F, and H), or are from one experiment representative of two [(I) and (J)] or at least three independent experiments [(A) to (C), and (G)]
We next compared the relative contributions of the spleen and the bone marrow in response to MI by using mice in which only one of the two tissues can contribute monocytes. First, we evaluated _Ccr2_−/− mice, because the chemokine receptor mediates monocyte mobilization from the bone marrow (9, 21), but not from the spleen (table S4). The number of blood monocytes comparably increased—and the number of splenic monocytes comparably decreased—after MI in both wild-type and _Ccr2_−/− mice (Fig. 3E). The released monocytes in _Ccr2_−/− mice did not accumulate in the ischemic myocardium, because infiltration depends on the chemokine CCR2 [table S4 and (7)]. Second, we evaluated animals splenectomized by a procedure that preserves the bone marrow and blood monocyte pools (fig. S7). After MI, blood monocyte numbers increased in control, but not splenectomized, animals (Fig. 3F). Analysis of the ischemic myocardium revealed a massive influx of Ly-6Chigh monocytes in mice containing the spleen. However, this number was decreased by 75% in splenectomized mice (Fig. 3, G and H). These findings indicate that the spleen mobilizes monocytes en masse after MI. Similar observations in rats argue for a generalizable existence of a splenic monocyte reservoir (fig. S8).
To track unambigously the fate of monocytes from the spleen to the heart, we studied CD45.1 mice that were splenectomized, given CD45.2 spleens by transplantation, and subjected to MI (fig. S9). We observed increased numbers of donor monocytes in the blood of animals after MI, which indicated that the injury triggered the release of splenic monocytes (fig. S10). The infarct accumulated donor (i.e., spleen-derived) and host monocytes, all of which were Gr-1+ (Ly-6Chigh) (Fig. 3I). The transplantation procedure itself reduced the number of reservoir donor monocytes by a factor of 6.1, likely because of ischemia-related cell differentiation. Correcting for this, we calculated that the spleen contributed 41% of monocytes to the ischemic myocardium. Control experiments (transplanted pancreas or transplanted spleen but no MI) showed no accumulation of donor monocytes in the recipient heart (Fig. 3J). Noninvasive fluorescence molecular tomography–magnetic resonance imaging (FMT-MRI) three-dimensional fusion imaging (22) with phagocytosis and cathepsin-activatable sensors (23) revealed attenuated activities in infarcts of splenectomized mice (Fig. 3K), which indicates that splenic monocytes are biologically active when recruited to inflamed tissue. Thus, the spleen stores Ly-6Chigh monocytes readily recruitable to augment inflammation at distant sites. The spleen does not likely produce monocytes, because donor spleens contained only host-derived cells as early as 3 weeks after transplantation (fig. S11).
The spleen did not contribute neutrophils significantly, which suggested selective mobilization of monocytes (fig. S12). Of these, both subsets (Ly-6Chigh and Ly-6Clow) exited the spleen in response to MI, yet after 1 day, the ischemic myocardium recruited Ly-6Chigh monocytes selectively (fig. S13). The excluded Ly-6Clow monocytes may have dispersed to other tissues, patrolled the vasculature, or accumulated in the infarct at a later time (7).
Monocytes express a wide variety of receptors (24), some of which may trigger splenic release. We focused on angiotensin II (Ang II), because (i) it induces cytoskeletal rearrangement and migration of monocytes in vitro (25), (ii) it augments monocyte-mediated inflammation (26), and (iii) its serum levels increase after MI (27). Ang II exerts its effects by binding to the angiotensin type 1 (AT-1) and AT-2 receptors.
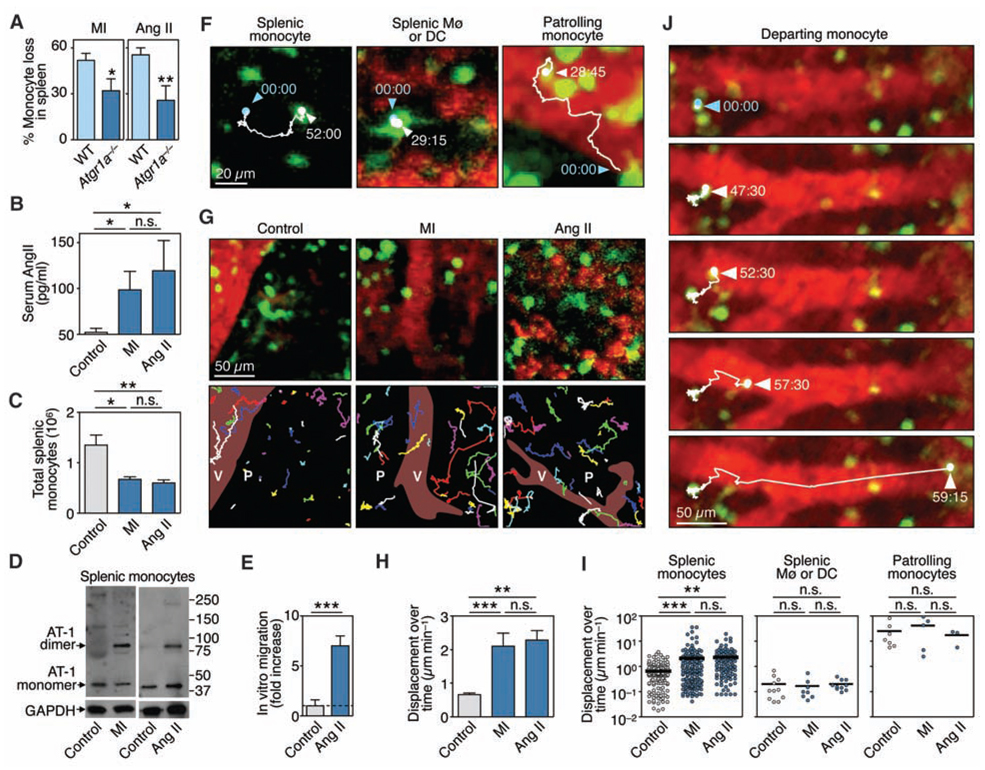
_Atgr1a_−/− animals subjected to MI did not expel splenic monocytes efficiently (Fig. 4A) and accumulated only a few monocytes in the ischemic myocardium (fig. S14),which indicated that Ang II–AT-1 signaling contributes to expulsion in this model. Sustained exogenous administration of Ang II in wild-type mice reproduced monocyte egress; mice with Ang II concentrations comparable to those after MI (Fig. 4B) released splenic monocytes (Fig. 4C and fig. S15). Moreover, Ang II infusion or MI elicited AT-1 receptor dimerization in splenic monocytes in vivo (Fig. 4D), an event that stimulates a wide spectrum of intracellular responses (26). We also found that Ang II induced directional migration of splenic monocytes in vitro (Fig. 4E). These data support a direct link between Ang II, the AT-1 receptor, and splenic monocytes and prompted us to explore the effects of Ang II on cell behavior in vivo.
Figure 4.
Ang II–AT-1 receptor signaling promotes splenic monocyte motility and tissue emigration. (A) Percentage of monocytes lost from the spleen 1 day after MI or Ang II infusion in WT and _Atgr1a_−/− mice (means ± SEM, _n_= 4 to 9). (B) Serum Ang II concentrations in the steady-state (control), and 1 day after MI or infusion of Ang II (n = 6 to 9). (C) Total number of splenic monocytes (Ly-6Chigh and Ly-6Clow) in the groups of mice mentioned above. (D) Western blot analysis of monomeric and dimeric forms of the AT-1 receptor on control splenic monocytes in the steady state (control), and 1 day after MI or infusion of Ang II, n = 3. (E) In vitro migration of splenic monocytes in response to Ang II (1 µM) (means ± SEM, n = 6). (F) Intravital microscopy of GFP+ cells (green) in the spleen subcapsular red pulp of an Ang II–treated Cx3cr1gfp/+ mouse. Images show a splenic monocyte, an Mø or DC, and a patrolling monocyte. Blood is shown in red. Tracks indicate the position of cell centroids at 15-s intervals (time in min:s). (G) (Top) Intravital micrographs of GFP+ cells in control mice and 1 day after MI or infusion of Ang II at the initial recording time point. (Bottom) Tracks for all GFP+ cells in the field of view and over 1 hour. Some cells entered or exited our imaging area during the recording and thus were followed for a shorter duration. V, vessel; P, parenchyma. (H) Average displacement over time of all GFP+ splenic monocytes [means ± SEM, n = 143 (control), 163 (MI), and 125 (Ang II) cells]. (I) Displacement over time of single splenic monocytes (left), splenic macrophages of DCs (middle), and patrolling monocytes (right). (J) Recording of a departing splenic monocyte. Tracks indicate the position of the cell centroid. *P < 0.05, **P < 0.01, ***P < 0.001. Data pool two [(A) to (C), and (E)] or at least three independent experiments [(H) and (I)], or are from one experiment representative of at least three independent experiments [(D), (F), and (G)].
We developed a real-time intravital microscopy technique that allows observation of endogenous monocytes and vessels in the subcapsular red pulp of the spleen in live animals, at depths up to 100 µm below the fibrous capsule, while preserving organ temperature and blood flow. Spleens of Cx3cr1gfp/+ mice contained three distinct GFP+ populations, based on their location and size (Fig. 4F, fig. S16, and movies S4 to 6). Real-time tracking of GFP+ cells in cluster-rich regions of the subcapsular red pulp revealed behavioral changes shortly after MI or after administration of Ang II (Fig. 4G). Splenic monocytes increased their displacement over time by more than threefold within 2 hours after either intervention (Fig. 4, G to I, movies S7 to 9 and fig. S17), which indicated that Ang II induced their migration in vivo. Conversely, splenic macrophages or DCs showed very low displacement that did not increase in response to intervention, whereas patrolling monocytes showed typically high displacement (Fig. 4I), as reported in dermal and mesenteric vessels (14). The motile splenic monocytes that responded to Ang II were more likely to encounter neighboring venous sinuses or collecting veins and to enter the blood stream to exit the spleen. Figure 4J and movie S10 show one example of a prototypical departing monocyte. The increased motility of splenic monocytes and subsequent egress led to a considerable loss of fluorescent cells in tissue (fig. S15).
Splenic contraction after hemorrhagic shock is associated with erythrocyte expulsion (28). Our intravital microscopy data show, however, that the subcapsular red pulp did not measurably contract when monocytes were already activated 1.5 hours after treatment with Ang II (fig. S18).A contraction-induced mechanism would also affect other leukocytes, but our neutrophil data indicate otherwise.
Our findings illuminate the body's ability to mobilize a reservoir of undifferentiated splenic monocytes in response to injury. Triggering of this reservoir likely provides a stochastic advantage for rapid monocyte accumulation, but such triggering is not necessarily desirable. Future studies should investigate the contribution of the splenic monocyte population in response to other inflammatory events and whether additional factors control monocyte migration, organization, and differentiation in the splenic environment. Understanding how an organism controls the quality and quantity of its immune players is essential to understanding homeostasis, and its perturbation and restoration following infection and tissue injury.
Supplementary Material
suppl
Footnotes
References and Notes
- 1.Luster AD, Alon R, von Andrian UH. Nat. Immunol. 2005;6:1182. doi: 10.1038/ni1275. [DOI] [PubMed] [Google Scholar]
- 2.Ley K, Laudanna C, Cybulsky MI, Nourshargh S. Nat. Rev. Immunol. 2007;7:678. doi: 10.1038/nri2156. [DOI] [PubMed] [Google Scholar]
- 3.Singer AJ, Clark RA. N. Engl. J. Med. 1999;341:738. doi: 10.1056/NEJM199909023411006. [DOI] [PubMed] [Google Scholar]
- 4.Auffray C, Sieweke MH, Geissmann F. Annu. Rev. Immunol. 2009;27:669. doi: 10.1146/annurev.immunol.021908.132557. [DOI] [PubMed] [Google Scholar]
- 5.Gordon S, Taylor PR. Nat. Rev. Immunol. 2005;5:953. doi: 10.1038/nri1733. [DOI] [PubMed] [Google Scholar]
- 6.Arnold L, et al. J. Exp. Med. 2007;204:1057. doi: 10.1084/jem.20070075. [DOI] [PMC free article] [PubMed] [Google Scholar]
- 7.Nahrendorf M, et al. J. Exp. Med. 2007;204:3037. doi: 10.1084/jem.20070885. [DOI] [PMC free article] [PubMed] [Google Scholar]
- 8.Dunay IR, et al. Immunity. 2008;29:306. doi: 10.1016/j.immuni.2008.05.019. [DOI] [PMC free article] [PubMed] [Google Scholar]
- 9.Serbina NV, Pamer EG. Nat. Immunol. 2006;7:311. doi: 10.1038/ni1309. [DOI] [PubMed] [Google Scholar]
- 10.Sunderkotter C, et al. J. Immunol. 2004;172:4410. doi: 10.4049/jimmunol.172.7.4410. [DOI] [PubMed] [Google Scholar]
- 11.Swirski FK, et al. J. Clin. Invest. 2007;117:195. doi: 10.1172/JCI29950. [DOI] [PMC free article] [PubMed] [Google Scholar]
- 12.Tacke F, et al. J. Clin. Invest. 2007;117:185. doi: 10.1172/JCI28549. [DOI] [PMC free article] [PubMed] [Google Scholar]
- 13.Mantovani A, Allavena P, Sica A, Balkwill F. Nature. 2008;454:436. doi: 10.1038/nature07205. [DOI] [PubMed] [Google Scholar]
- 14.Auffray C, et al. Science. 2007;317:666. doi: 10.1126/science.1142883. [DOI] [PubMed] [Google Scholar]
- 15.Geissmann F, Jung S, Littman DR. Immunity. 2003;19:71. doi: 10.1016/s1074-7613(03)00174-2. [DOI] [PubMed] [Google Scholar]
- 16.van Furth R, Cohn ZA. J. Exp. Med. 1968;128:415. doi: 10.1084/jem.128.3.415. [DOI] [PMC free article] [PubMed] [Google Scholar]
- 17.Materials and methods are available as supporting material on Science Online.
- 18.Mebius RE, Kraal G. Nat. Rev. Immunol. 2005;5:606. doi: 10.1038/nri1669. [DOI] [PubMed] [Google Scholar]
- 19.Mosser DM, Edwards JP. Nat. Rev. Immunol. 2008;8:958. doi: 10.1038/nri2448. [DOI] [PMC free article] [PubMed] [Google Scholar]
- 20.Kristiansen M, et al. Nature. 2001;409:198. doi: 10.1038/35051594. [DOI] [PubMed] [Google Scholar]
- 21.Tsou CL, et al. J. Clin. Invest. 2007;117:902. doi: 10.1172/JCI29919. [DOI] [PMC free article] [PubMed] [Google Scholar]
- 22.Weissleder R, Pittet MJ. Nature. 2008;452:580. doi: 10.1038/nature06917. [DOI] [PMC free article] [PubMed] [Google Scholar]
- 23.Nahrendorf M, et al. Circ. Res. 2007;100:1218. doi: 10.1161/01.RES.0000265064.46075.31. [DOI] [PubMed] [Google Scholar]
- 24.Medzhitov R. Nature. 2008;454:428. doi: 10.1038/nature07201. [DOI] [PubMed] [Google Scholar]
- 25.Kintscher U, et al. Hypertension. 2001;37:587. doi: 10.1161/01.hyp.37.2.587. [DOI] [PubMed] [Google Scholar]
- 26.AbdAlla S, Lother H, Langer A, el Faramawy Y, Quitterer U. Cell. 2004;119:343. doi: 10.1016/j.cell.2004.10.006. [DOI] [PubMed] [Google Scholar]
- 27.McAlpine HM, Cobbe SM. Am. J. Med. 1988;84:61. doi: 10.1016/0002-9343(88)90206-9. [DOI] [PubMed] [Google Scholar]
- 28.Davies BN, Withrington PG. Pharmacol. Rev. 1973;25:373. [PubMed] [Google Scholar]
- 29.This work was supported in part by NIH grants U01 HL080731, P50 CA86355, R24 CA69246, U54 CA126515, and P01 A154904 (to R.W.), MGH-Center for Systems Biology (to M.J.P.), AHA SDG 0835623D (to M.N.), and NIH grant 1R01HL095612 (to F.K.S). The authors thank U. von Andrian for critical assessment of the manuscript; A. Luster for providing _Ccr2_−/− mice; D. Erle, A. Barcak, and C. Eisley for microarray hybridization and data analysis; M. Waring for sorting cells; A. Moseman for helpful discussion and feedback with parabiosis experiments; and A. Newton, C. Siegel, N. Sergeyev, and Y. Iwamoto for technical assistance. MIAME (minimum information about a microarray experiment)–compliant expression data have been deposited under accession no. GSE14850. This work is dedicated to the memory of Marc-Henri Pittet.
Associated Data
This section collects any data citations, data availability statements, or supplementary materials included in this article.
Supplementary Materials
suppl


