The Role of Potassium in Inflammasome Activation by Bacteria (original) (raw)
Abstract
Many Gram-negative bacteria possess a type III secretion system (TTSS¶) that can activate the NLRC4 inflammasome, process caspase-1 and lead to secretion of mature IL-1β. This is dependent on the presence of intracellular flagellin. Previous reports have suggested that this activation is independent of extracellular K+ and not accompanied by leakage of K+ from the cell, in contrast to activation of the NLRP3 inflammasome. However, non-flagellated strains of Pseudomonas aeruginosa are able to activate NLRC4, suggesting that formation of a pore in the cell membrane by the TTSS apparatus may be sufficient for inflammasome activation. Thus, we set out to determine if extracellular K+ influenced P. aeruginosa inflammasome activation. We found that raising extracellular K+ prevented TTSS NLRC4 activation by the non-flagellated P. aeruginosa strain PA103ΔUΔT at concentrations above 90 mm, higher than those reported to inhibit NLRP3 activation. Infection was accompanied by efflux of K+ from a minority of cells as determined using the K+-sensitive fluorophore PBFI, but no formation of a leaky pore. We obtained exactly the same results following infection with Salmonella typhimurium, previously described as independent of extracellular K+. The inhibitory effect of raised extracellular K+ on NLRC4 activation thus reflects a requirement for a decrease in intracellular K+ for this inflammasome component as well as that described for NLRP3.
Keywords: Cytokines/Induction, Cytokines/Interleukins, Immunology, Immunology/Innate Immunity, Organisms/Bacteria, Proteases/Caspase, Inflammasome, NLR Proteins
Introduction
Activation of caspase-1 is a key step in the generation of an inflammatory response as well as potentially initiating a distinctive form of cell death known as pyroptosis (1). The activation of caspase-1 is brought about by the assembly of a multisubunit protein complex termed the inflammasome (2–4). Active caspase-1 cleaves pro-interleukin (IL)2-1β and pro-IL-18 to their mature forms, which are then secreted from the cell. These cytokines play key roles in innate immunity and orchestration of an inflammatory response (5).
The inflammasome can be comprised of a number of different subunits. Central to inflammasome formation are proteins belonging to the nucleotide binding and leucine-rich repeat containing family (NLR) (6). These combine with caspase-1, together with the proteins SGT1 and HSP90 (7), apoptosis-associated speck-like protein containing a caspase recruitment domain (ASC) (8) and other less well characterized proteins. The NLR gene family is large (see Ref. 9 for updated nomenclature) and potentially a considerable number of these proteins may form different inflammasomes. However, currently only a few are well characterized. NLRP3 (formerly known as NALP3) forms one of the most well studied inflammasomes. This can respond to a prodigious number of disparate stimuli, including ATP (10, 11), urate crystals (12), alum (13–15), silica (13, 16, 17), amyloid (18), as well as bacterial toxins such as staphylococcal α-toxin (10) and aerolysin (19), and bacterial products such as muramyl dipeptide (20). The common thread to these activators seems to be the ability to stimulate a large efflux of K+ ions from the cell (21). This then triggers the NLRP3 inflammasome leading to caspase-1 activation, IL-1β secretion, and in many instances the initiation of pyroptosis. Inhibition of NLRP3 can be achieved by preventing K+ efflux, typically by raising extracellular K+ concentration (21).
In contrast, the other main inflammasome, which is based around the NLRC4 protein (formerly known as interleukin-1 protein-activating factor, IPAF), is involved mainly in detection of intracellular bacteria or their products (22, 23). The only well-defined ligand for NLRC4 is bacterial flagellin (24, 25). This requires to be translocated into the host cell cytoplasm, a process that usually requires a bacterial type III secretion system (TTSS) (24, 25). In contrast to the NLRP3 inflammasome, this process is described as not being inhibited by raising extracellular K+ (21, 26). Initially described for the Gram-negative pathogen Salmonella typhimurium, this TTSS-dependent activation of the NLRC4 inflammasome has also been described for the extracellular pathogen Pseudomonas aeruginosa (27–29). However, one of the strains used in these experiments, PA103, lacks flagellin, yet was still able to activate the NLRC4 inflammasome in a TTSS-dependent fashion (27). Thus, there must exist TTSS-dependent triggers to NLRC4 activation that are distinct from flagellin.
We are interested in elucidating the mechanism by which P. aeruginosa can activate the NLRC4 inflammasome in the absence of flagellin. One possibility is that rather than introducing a pathogen-specific molecule, the TTSS induces membrane damage that leads to inflammasome activation, in much the same way as for the NLRP3 inflammasome. We set out to test this hypothesis by determining if alteration of the extracellular K+ concentration affected the ability of P. aeruginosa lacking flagellin to activate the inflammasome. Rather surprisingly, we found that this is true, but not only for a non-flagellated P. aeruginosa. Inflammasome activation by flagellated strains of this microbe as well as the flagellated S. typhimurium was also abrogated by raising extracellular K+. The concentration of extracellular K+ required to inhibit NLRC4 inflammasome activation is much higher than reported for the NLRP3 inflammasome. Infection of cells produces a detectable K+ efflux, but only in a minority of cells. However, we found no evidence of a leaky pore on infection of cells with P. aeruginosa. Thus, K+ efflux is important in NLRC4 activation by P. aeruginosa and S. typhimurium as well as its role in the activation of NLRP3 by diverse stimuli, but these bacteria do not produce a nonspecific membrane pore.
EXPERIMENTAL PROCEDURES
Mice and Cells
All animals were kept according to Institutional and National guidelines. C57BL/6 mice (bred in-house) were housed in filtered cages and sacrificed using cervical dislocation. Bone marrow-derived macrophages (BMDMs) were isolated as previously described (30). Briefly, femurs and tibias were flushed with medium using a 21G needle to obtain bone marrow mononuclear phagocytic precursor cells. To remove tissue and debris the cell suspension was passed through a Nitex mesh (Cadish, London, UK). Culture medium used was RPMI 1640 supplemented with 20% heat-inactivated fetal bovine serum, 100 μg/ml streptomycin, 100 units/ml penicillin, 2 mm l-glutamine, 2.5 μg/ml fungizone (amphotericin B), and 100 μm/ml sodium pyruvate (all from Invitrogen). Bone marrow mononuclear phagocytic precursor cells were seeded into untreated 9-cm Petri dishes (Sterilin, Caerphilly, UK) at a concentration of 3 × 10⁶ cells/plate. Complete medium was further supplemented with M-CSF, obtained from the supernatant of L929 cells. Cells were cultured for 3 days, after which medium and M-CSF were added, and cells were grown for a further 3–4 days. Matured macrophages were replated on the day of the experiment. RAW 264 and HeLa cells (ECACC, Porton Down, UK) were cultured in RPMI as above. For imaging experiments, medium without Phenol Red was used, with the addition of 25 mm HEPES.
Reagents
ATP and Escherichia coli LPS purified by ion-exchange chromatography were from Sigma.
Bacterial Infection
The following bacterial strains were used. P. aeruginosa PA103ΔUΔT (31), which lacks any effectors passing through its functional TTSS. PA103ΔpcrV lacks the ability to form a functional TTSS (both were a gift from D. Frank, University of Wisconsin). PA103ΔUΔT:exoU translocates the toxin ExoU (32). P. aeruginosa PAO1 strains: PAO1ΔSTY has a functional TTSS but does not translocate any toxins; PAO1ΔpopB has a non-functional TTSS (both gifts from A. Rietsch, Case Western Reserve University). S. enterica serovar typhimurium strain SL1344 was a gift from M. Roberts, University of Glasgow. Bacteria were grown overnight at 37 °C with shaking at 225 rpm. The following day bacteria were diluted 1 in 30 and grown until the _A_600 was between 0.4 and 0.6. After washing in phosphate-buffered saline, bacteria were diluted in medium and used to infect macrophages at the indicated multiplicity of infection (MOI). For experiments involving manipulation of extracellular potassium concentration, medium was replaced 0.5 h prior to infection with “high” (140 mm K+) or “low” (5 mm K+) potassium buffer as described by (19), supplemented with 1× MEM vitamin solution, 2 mm l-glutamine, 1× MEM amino acids solution and 100 μm/ml sodium pyruvate (all from Invitrogen). Intermediate potassium concentrations were prepared by mixing of the two buffers. Where indicated, cells were treated with 100 μm glybenclamide (Sigma) 30 min before infection as previously described (33).
Internalization was measured by a gentamicin protection assay. After a 90-min infection of BMDM as above, cells were washed three times in medium before incubating for a further 90 min in medium with gentamicin (100 μg/ml). Cells were then washed, lysed in 1% Triton X in phosphate-buffered saline, and viable bacteria enumerated by colony counting after culture.
Intracellular K+ Concentration
Macrophages were seeded at 1 × 10⁶ cells per well of a 6-well dish on the day of experiment in complete medium lacking antibiotics. Macrophages were then infected or stimulated at indicated time points, and medium was removed and cells were washed twice in Tris-buffered saline, pH 7.4. Cells were then lysed in 1 ml of 10% nitric acid and intracellular K+ concentration was measured as previously described (26). Briefly, the intracellular K+ content was measured using a Sherwood MA10C Flame Photometer. Values were compared with those obtained with standard solutions of potassium chloride.
Additionally, intracellular K+ was determined in individual cells using the K+-sensitive fluorophore PBFI (34). BMDM were seeded onto chamber slides at 5 × 10⁵ cells/well in complete RPMI without Phenol Red (Invitrogen). Cells were allowed to settle, and the medium was changed to RPMI with 5% fetal bovine serum and 25 mm HEPES. Cells were loaded with the cell permeant acetoxymethyl ester of PBFI (PBFI-AM (Invitrogen) at 2 μm together with Pluronic F-127 (a non-ionic detergent polyol used to facilitate cell loading of large dye molecules, Invitrogen) for 60 min at room temperature, according to the manufacturer's instructions. After one wash in medium, cells were imaged using a Zeiss Axiovert 60 inverted microscope with a 37 °C heated stage. Fluorescence emission at 500 nm was recorded with excitation alternating between 340 and 380 nm; PBFI shows K+ emission dependent at 500 nm when excited at 340 nm, but a K+-independent fluorescence when excited at 380 nm, near the isosbestic point. Hence, the ratio between fluorescence emission at 500 nm when excited at 340 and 380 nm provides a good assay for intracellular K+ that is independent of dye concentration and photobleaching. After an initial period of stabilization, cells were infected or treated as indicated. Control incubations using valinomycin to equilibrate intracellular and extracellular K+ were performed as described in the manufacturer's instructions and confirmed the expected decrease in PBFI 340/380 fluorescence ratio. Time lapse images were acquired every 30 s using OpenLab software (Improvision, PerkinElmer, Wiesbaden, Germany). Image analysis was performed using Image J software (USA NIH, Bethesda, MD).
Immunoblotting
Cells were lysed in lysis buffer (27) and resolved by SDS-PAGE and transferred to polyvinylidene difluoride membranes by electroblotting. The rabbit anti-mouse caspase-1 p10 (sc-514) was from Santa Cruz Biotechnology (Insight Biotechnology, Wembley, UK) and the mouse anti-mouse β-actin was from Abcam (Cambridge, UK).
Measurements of IL-1β and Cytotoxicity
Mouse interleukin 1β (IL-1β) was measured in culture supernatants with ELISA kits (DuoSet DY401) from R & D Systems (Abingdon, UK). Release of pro-IL-1β was controlled for as previously described (24). Lactate dehydrogenase (LDH) activity in cell supernatants was determined with the CytoTox 96 assay from Promega (Southampton, UK).
Lucifer Yellow and Calcium Imaging
Cells were exposed to Lucifer yellow after infection as described in Neyt and Cornelis (35), and cells imaged using a Zeiss Axiovert S100 fluorescence microscope and OpenLab software. Intracellular calcium imaging was performed using the dye Fluo-4 (Invitrogen). Cells were loaded with 3 μm Fluo-4 acetoxymethyl ester for 60 min at 37 °C, then washed in medium and incubated a further 30 min at 37 °C, Imaging was performed on a 37 °C heated stage every 15 s using OpenLab to control the microscope. Time lapses and image analysis was performed using the program ImageJ. In cells infected with the ExoU translocating strain PA103ΔUΔT:exoU, the medium was additionally supplemented with ethidium bromide at 5 μg/ml.
Statistical Analysis
Results are expressed as means ± S.E. of the mean (S.E.). Statistical tests were used as described; results were considered statistically significant at a p value of less than 0.05. Statistical analysis was carried out using the computer program Prism (GraphPad, La Jolla, CA).
RESULTS
Activation of Caspase-1 by P. aeruginosa Is Dependent on the NLRC4 Inflammasome
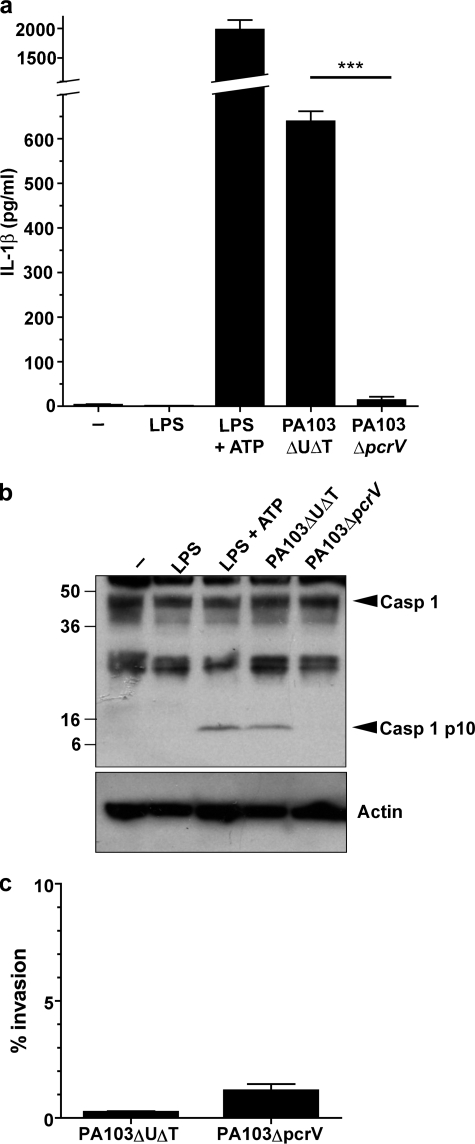
To investigate the role of the type III secretion system (TTSS) in triggering the activation of the inflammasome, we used murine BMDM and infected them with strains of P. aeruginosa or treated them with ATP after LPS induction of pro-IL-1β as a control. We used the non-flagellated strain PA103ΔUΔT that has a fully functional TTSS, but does not translocate any pseudomonal toxins. Following infection of unprimed BMDM for 90 min at a MOI of 100, this strain of P. aeruginosa induced significant secretion of IL-1β into the medium, and cleavage of caspase-1 to a processed p10 fragment (Fig. 1). Infection with a strain that lacked a functional TTSS, PA103ΔpcrV, failed to activate the inflammasome (Fig. 1). Thus, as described previously (27), activation of the inflammasome following infection with P. aeruginosa can occur in the absence of flagellin but does require a functional TTSS. Importantly, even a short (90 min) incubation with the bacteria in the absence of pretreatment with LPS led to a significant accumulation of secreted IL-1β, which was just under half the amount produced by ATP stimulation of LPS pretreated BMDM (Fig. 1a). Differences in internalization could not account for the differences observed (Fig. 1c). Microbial infection alone is thus a sufficient stimulus to lead to pro-IL-1β induction, presumably through its possession of LPS. In other experiments (later figures and data not shown) we have used BMDM pretreated with LPS to maximize the IL-1β signal, as others have adopted, but there were no other differences in the results of the experiments.
FIGURE 1.
Activation of the inflammasome by P. aeruginosa is dependent on a functional type III secretion system but not on translocated toxins. Murine BMDM were treated with LPS for 3 h alone, or in addition ATP for 30 min. Infections with the indicated strains of P. aeruginosa were for 90 min at an MOI of 100 in the absence of LPS prestimulation. a shows secreted IL-1β released into the medium immediately following incubation. Columns are means (n = 3); error bars are S.E. of replicates. *** indicates a significant difference from the PA103ΔUΔT strain, p < 0.001, Student's _t_ test. _b_ shows caspase-1 processing detected by immunoblot of cell lysates treated as indicated. _Arrows_ to the _right_ indicate unprocessed caspase-1 (_Casp 1_) and the processed p10 subunit (_Casp 1 p10_). Molecular mass markers (kDa) are shown to the _left_. The _lower panel_ shows the blot reprobed with an antibody to actin to show even loading of the gel. _c_, internalized bacteria do not differ significantly between the PA103ΔUΔT and PA103ΔpcrV. BMDM were infected at a MOI of 100 for 90 min and then gentamicin added for an additional 30 min to kill extracellular bacteria. Cells were then lysed and intracellular bacteria counted following culture. Results are means of triplicates; _error bars_ are ± S.E. There is no significant difference between the strains (_p_ > 0.05, Student's t test).
To confirm that P. aeruginosa PA103ΔUΔT activation of the inflammasome was dependent on the protein NLRC4, we repeated these experiments using BMDM from mice with specific homozygous deletions of genes encoding various inflammasome components (supplemental Fig. S1). This confirmed that inflammasome activation by PA103ΔUΔT was dependent on NLRC4 and ASC, but was independent of NLRP3. In these and all other experiments, cytotoxicity of this infection, as measured by release of LDH, was typically ≤ 10% (supplemental Fig. S1_a_), showing that capsase-1 activation and IL-1β release can be dissociated from cell death. Interestingly, at higher MOIs, we did observe a very high LDH release in BMDM from NLRP3-deleted mice (data not shown), suggesting that this protein may protect against cell death in this model.
Raised Extracellular Potassium Inhibits P. aeruginosa Activation of the Inflammasome
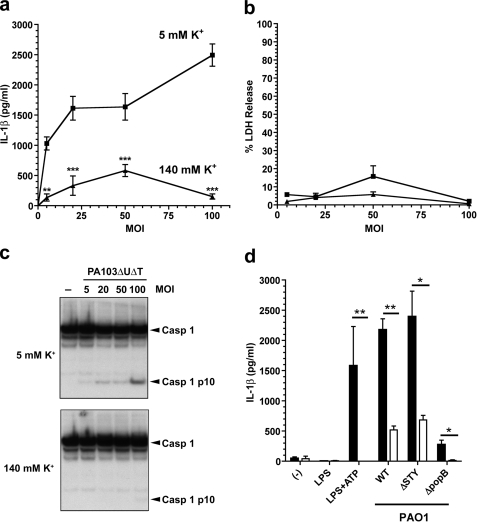
One possible explanation for the activation of the NLRC4 inflammasome by PA103ΔUΔT is membrane damage caused by the TTSS, rather than a specific pathogen-derived molecule. We hypothesized that such membrane-damage might lead to efflux of K+ and contribute to NLRC4 activation, as has been described for NLRP3 activation (21, 26). To test this hypothesis, we infected BMDM at a variety of multiplicities of infection (MOIs) with PA103ΔUΔT in medium with either a normal physiological K+ concentration (5 mm) or a high K+ concentration (140 mm), to inhibit potential efflux of K+ through a TTSS mediated pore. As expected at normal extracellular K+, infection with PA103ΔUΔT led to IL-1β secretion and caspase-1 activation that increased with increasing MOI (Fig. 2, a and c). However, in the high K+ buffer the secretion of IL-1β was significantly inhibited, as was the activation of caspase-1 (Fig. 2, a and c). Extracellular K+ concentration did not affect cell death, as evidenced by LDH release at all the MOIs tested (Fig. 2b).
FIGURE 2.
P. aeruginosa activation of the inflammasome is inhibited by high extracellular potassium, independently of MOI. a–c, LPS pretreated murine BMDM were infected for 90 min with PA103ΔUΔT at the indicated MOIs, either in medium with physiological [K+] (5 mm, square symbols) or with elevated [K+] (140 mm, triangles). a shows secreted IL-1β released into the medium at different MOIs and [K+]. Points are the means of triplicates; error bars are ± S.E. IL-1β release was significantly dependent on both [K+] and MOI by 2-way ANOVA (p < 0.001 and p < 0.001, respectively). The difference in IL-1β release was significant for all [K+] using the Bonferroni post-test correction (**, p < 0.01; ***, p < 0.0001). b, cell viability measured by LDH release in the same experiment as in a, with the same symbols. c, shows caspase-1 processing detected by immunoblot of cell lysates following infection at different MOIs as indicated in low (5 mm) and high (140 mm) extracellular potassium concentration. Arrows to the right indicate unprocessed caspase-1 (Casp 1) and the processed p10 subunit (Casp 1 p10). d, shows released IL-1β following murine BMDM treatment with LPS or LPS + ATP or following infection with the indicated strains of P. aeruginosa PAO1 at a MOI of 30. Solid bars are means of triplicates in low (5 mm) [K+] medium; open bars are in high extracellular (140 mm) [K+]. Error bars are ± S.E. Released IL-1β was significantly higher in the low [K+] medium as shown (**, p < 0.01; *, p < 0.05; Student's t test).
We next turned to another strain of P. aeruginosa, PAO1, which also activates the inflammasome in a TTSS- and NLRC4-dependent fashion, but predominantly through the intracellular introduction of flagellin (28). Following infection of BMDM in low K+ buffer, the strain PAO1ΔSTY that has a functional TTSS but does not translocate any effectors, produced secretion of IL-1β (Fig. 2d). A strain lacking a functional TTSS, PAO1ΔpopB, did not induce IL-1β. Surprisingly, however, we found that exactly as with PA103ΔUΔT, infection of cells in medium with high K+ concentration largely abrogated the secretion of IL-1β (Fig. 2d, open bars). We confirmed that isogenic strains of PAO1 lacking flagellin largely lacked the ability to induce caspase-1 activation and IL-1β secretion (data not shown), confirming the observation that in this strain NLRC4 activation is predominantly due to delivery of intracellular flagellin (28).
Concentration Dependence of Potassium Inhibition of Pseudomonal Inflammasome Activation
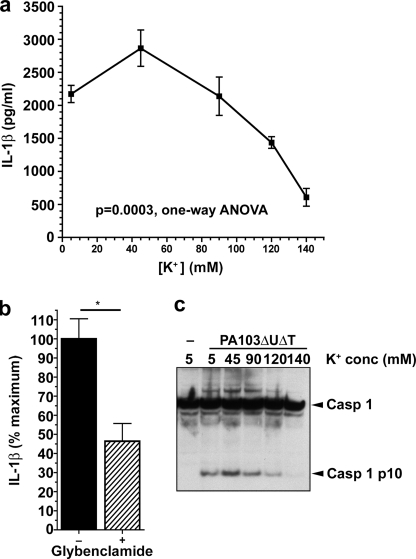
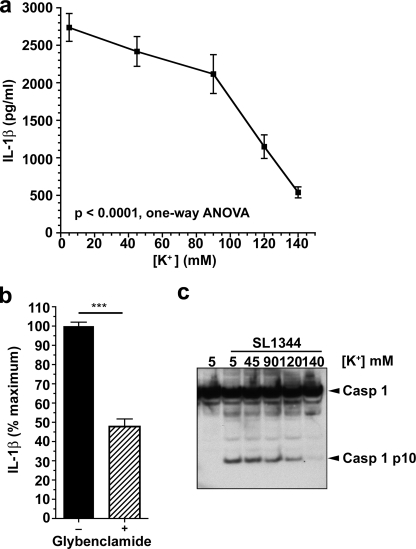
Next, we determined the concentration of extracellular K+ required to inhibit activation of the inflammasome by PA103ΔUΔT. We infected BMDM at a fixed MOI of 30 in buffers of varying K+ concentration. At extracellular K+ concentrations above 90 mm, there was a progressive decline in caspase-1 activation and IL-1β release that was virtually complete at 140 mm K+ (Fig. 3, a and c). This compares to effective inhibitory concentrations of 60 mm K+ to prevent staphylococcal α-toxin-mediated activation of the NLRP3 inflammasome (36); however, greater concentrations were required to produce full inhibition after longer preincubations with LPS.
FIGURE 3.
Extracellular potassium concentration-dependent inhibition of inflammasome activation by P. aeruginosa. a, LPS-pretreated murine BMDM were infected with PA103ΔUΔT at an MOI of 30 at the indicated extracellular potassium concentrations. Each point is the mean of triplicate determinations; error bars are ± S.E. Variation in IL-1β with potassium concentration was significant (p = 0.0003, 1-way ANOVA with significant linear trend for decrease in IL-1β with increasing extracellular potassium, slope −455.7, p < 0.001). b, effect of glybenclamide on IL-1β release from LPS-pretreated BMDM following PA103ΔUΔT infection at a MOI of 30. c, caspase-1 processing detected by immunoblot of cell lysates following infection at different extracellular potassium concentrations as in a. Arrows to the right indicate unprocessed caspase-1 (Casp 1) and the processed p10 subunit (Casp 1 p10).
Potassium efflux from cells can also be blocked by inhibitors of the ATP-sensitive K+ channels, such as glybenclamide (33). Addition of this drug to BMDM prior to infection with P. aeruginosa PA103ΔUΔT significantly inhibited Il-1β release (Fig. 3b), again supporting the conclusion that K+ exit from the cells is required for the NLRC4-mediated activation of the inflammasome.
Inflammasome Activation by S. typhimurium Is Also Inhibited by Raised Extracellular K+ Concentration
Because we were not expecting that raising extracellular K+ concentration could inhibit activation of the NLRC4 inflammasome, we re-examined the effects of altering extracellular K+ on inflammasome activation in BMDM following infection with the intracellular bacterial pathogen, S. typhimurium. Previous studies have reported that prevention of K+ efflux does not inhibit inflammasome activation initiated by infection with this microbe.
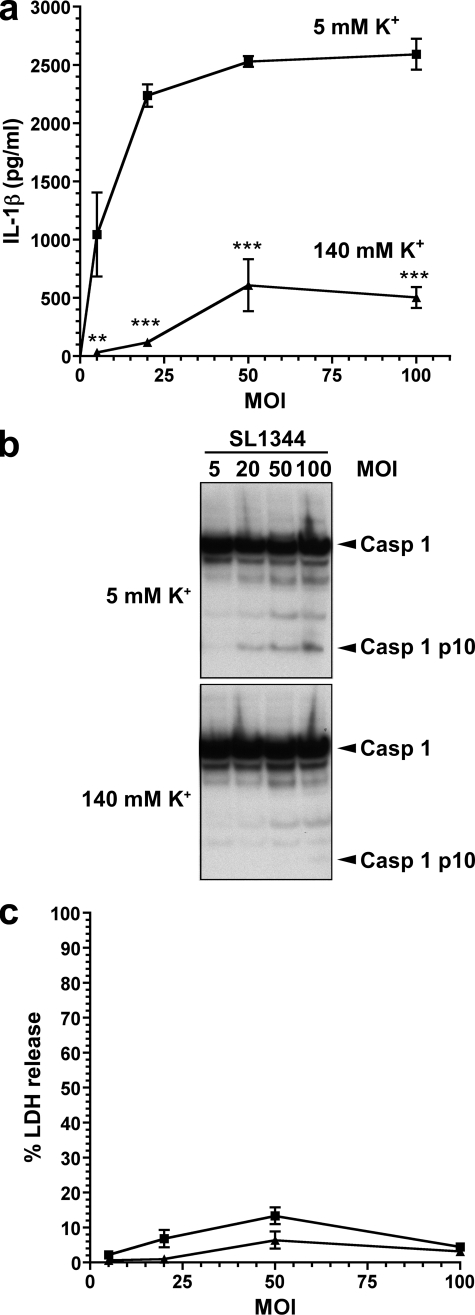
We adopted a similar experimental approach as for our experiments with P. aeruginosa infection. Firstly, we infected BMDM at a variety of MOIs for 90 min with S. typhimurium strain SL1344 in low (5 mm) and high (140 mm) K+ buffers. As with infection with PA103ΔUΔT, high extracellular K+ concentration was an effective inhibitor of IL-1β secretion and caspase-1 activation following SL1344 over a range of MOIs (Fig. 4, a and b), with no difference in cell death (Fig. 4c). We then investigated the exact extracellular K+ concentration necessary to inhibit S. typhimurium activation of the inflammasome. By infecting BMDM in buffers of various K+ concentrations, we found that significant reduction in IL-1β production and caspase-1 activation was observed at extracellular K+ concentrations above 90 mm (Fig. 5, a and c). Virtually complete inhibition was seen at 140 mm extracellular K+. Glybenclamide also produced a significant inhibition of IL-1β release following S. typhimurium infection (Fig. 5b).
FIGURE 4.
S. typhimurium activation of the inflammasome is inhibited by high extracellular potassium, independently of MOI. a–c, LPS pretreated murine BMDM were infected for 90 min with S. typhimurium strain SL1344 at the indicated MOIs, either in medium with physiological [K+] (5 mm, square symbols) or with elevated [K+] (140 mm, triangles). a, shows secreted IL-1β released into the medium at different MOIs and [K+]. Points are the means of triplicates; error bars are ± S.E. IL-1β release was significantly dependent on both [K+] and MOI by 2-way ANOVA (p < 0.001 and p < 0.001, respectively). The difference in IL-1β release was significant for all [K+] using the Bonferroni post-test correction (**, p < 0.01; ***, p < 0.0001). b shows caspase-1 processing detected by immunoblot of cell lysates following infection at different MOIs as indicated in low (5 mm) and high (140 mm) extracellular potassium concentration. Arrows to the right indicate unprocessed caspase-1 (Casp 1) and the processed p10 subunit (Casp 1 p10). c, cell viability measured by LDH release in the same experiment as in a, with the same symbols.
FIGURE 5.
Extracellular potassium concentration-dependent inhibition of inflammasome activation by S. typhimurium. a, LPS-pretreated murine BMDM were infected with S. typhimurium strain SL1344 at a MOI of 30 at the indicated extracellular potassium concentrations. Each point is the mean of triplicate determinations; error bars are ± S.E. Variation in IL-1β with potassium concentration was significant (p < 0.0001, one-way ANOVA with significant linear trend for decrease in IL-1β with increasing extracellular potassium, slope −566.3, p < 0.001). b, effect of glybenclamide on IL-1β release from LPS-pretreated BMDM following SL1344 infection at a MOI of 30. c, caspase-1 processing detected by immunoblot of cell lysates following infection at different extracellular potassium concentrations as in a. Arrows to the right indicate unprocessed caspase-1 (Casp 1) and the processed p10 subunit (Casp 1 p10).
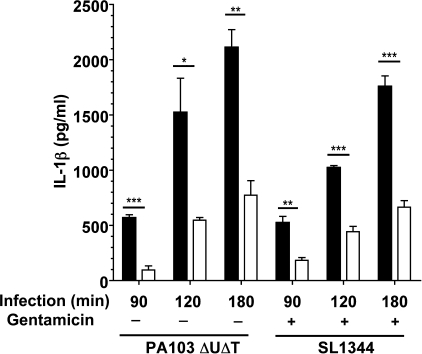
Other investigators have used different times of infection and/or included gentamicin to remove extracellular bacteria after initial infection. To exclude these factors as possible methodological explanations for the variance of our findings to other reports, we examined the effects of raising extracellular potassium on IL-1β secretion with different times of infection with PA103ΔUΔT (Fig. 6). At all the infection times tested, raising extracellular K+ to 140 mm produced a significant reduction in IL-1β secretion. Similarly, we repeated the infections of BMDM with S. typhimurium, but adding gentamicin after an initial 60-min infection period. Again, raised extracellular K+ inhibited IL-1β release irrespective of time of infection or with the addition of gentamicin (Fig. 6).
FIGURE 6.
Extracellular potassium inhibition of bacterial inflammasome activation is independent of length of time after infection. LPS-pretreated murine BMDM were infected with either P. aeruginosa PA103ΔUΔT strain or S. typhimurium SL1344 at a MOI of 30 for the indicated times at either low (5 mm, filled bars) or high (140 mm, open bars) extracellular [K+]. In addition, gentamicin was added to the cultures where indicated after 60 min. Columns show means of triplicate determinations; error bars are ± S.E. Differences between high and low extracellular [K+] were significant where indicated (**, p < 0.05; **, p < 0.01; ***, p < 0.0001, Student's t test).
Effects of Bacterial Infection on Levels of Intracellular K+
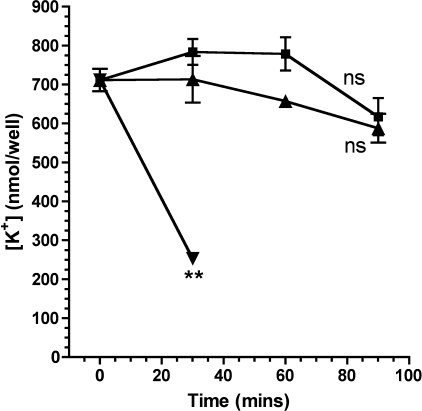
Given the observed dependence of inflammasome activation on extracellular K+ following both P. aeruginosa and S. typhimurium infection, we measured the intracellular K+ concentration in BMDM following infection with these microbes. As shown in Fig. 7, although there was a slight drop in measured cellular potassium levels, neither bacterium produced a significant change in intracellular K+ levels following infection. As a control, we measured intracellular K+ following a 30-min incubation with ATP. As expected, this led to a precipitous drop in intracellular K+ (Fig. 7), consistent with its activation of the P2X7 membrane pore (37).
FIGURE 7.
Intracellular potassium following bacterial infection and treatment with ATP. Murine BMDM were treated with ATP (inverted triangles) or infected at a MOI of 30 with P. aeruginosa PA103ΔUΔT strain (squares) or S. typhimurium SL1344 (triangles). Intracellular potassium was measured by flame photometry at the indicated times after treatment and expressed as nmol recovered per well containing 1 × 10⁶ cells. Results are means of 4–6 determinations; error bars ± S.E. ATP produced a significant fall in intracellular K+ concentration after 30 min (**, p < 0.01, Student's t test). Infection with either bacterium did not affect intracellular K+ concentration significantly (ns, non-significant: by t test of the final time point or difference of slope of the fitted line of linear regression from 0.0).
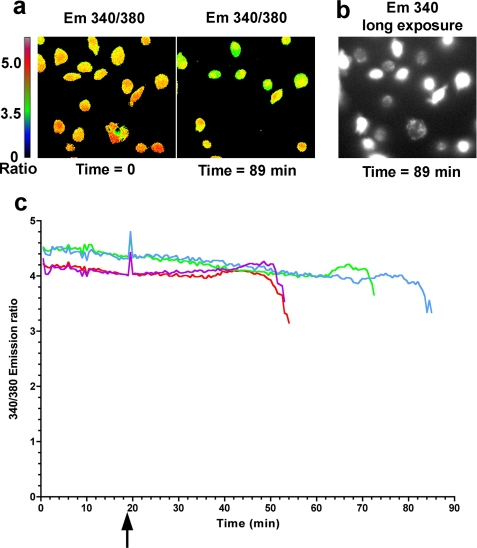
This method of measuring potassium within cells may not accurately reflect changes in potassium that occur in a minority of cells. To investigate this possibility, we followed levels of intracellular potassium in individual cells using the potassium sensitive fluorophore PBFI. Potassium levels are indicated by excitation of the fluorophore at 340 nm and 380 nm and measuring the ratio of emission at 500 nm between these two excitation wavelengths. This obviates artifactual changes in fluorescence measurements from photobleaching and changes in concentration of the dye. BMDMs were loaded with a cell permeant form of PBFI following which they were infected with different strains of P. aeruginosa and levels of intracellular potassium followed over time. Control cells showed a decrease in potassium levels following addition of the potassium ionophore valinomycin (detailed under “Experimental Procedures”). In cells infected with the PA103ΔpcrV strain no significant changes were observed in potassium levels within cells for up to 120 min after infection. Following infection with PA103ΔUΔT, we did observe changes in intracellular potassium levels in a minority of cells. Counting 673 cells in 10 separate experiments we found that a median of 14.84% of the cells showed a change in intracellular potassium (interquartile range 7.95–49.7). This was statistically significant from a null hypothesis value of 0 i.e. no cells showing a change in potassium (p = 0.002, Wilcoxon Signed Rank Test). A time-lapse recording of one such experiment is shown in supplemental Movie S1, translating the magnitude of PBFI fluorescence 340/380 ratio into a pseudo-colorized image. Representative images from the beginning and end of this experiment are shown in Fig. 8, a and b. Emission ratios from individual cells that showed a decline in intracellular potassium were measured over time; traces from four representative cells are shown in Fig. 8c. Following infection, these cells maintained their intracellular potassium for various periods of time following which they showed a rapid decline in potassium levels over a ∼5-min period until the signal declined below the level of detection. Increasing the gain of image acquisition showed a signal from PBFI did, however, remain in these cells albeit at a low level (Fig. 8b). The mean drop in PBFI fluorescence in cells that did show a change was 25.14% (n = 11 in three separate experiments, 95% confidence interval 14.9–35.4, significantly different from zero change, p = 0.0003, one sample Student's t test). Taken together, these data show that a minority of cells do show a drop in intracellular potassium in a TTSS-dependent fashion following infection with P. aeruginosa. Because most cells do not show a change, total levels of intracellular potassium following infection do not significantly decline (Fig. 7).
FIGURE 8.
Individual cell measurements of intracellular potassium following infection with P. aeruginosa. Cells loaded with the dye PBFI were infected at 19.5 min with PA103ΔUΔT strain at a MOI of 30. Cells were visualized every 30 s by measuring observed fluorescence at 500 nm at excitation wavelengths of both 340 and 380 nm. a shows the ratio of this fluorescence intensity at the indicated time points as a pseudo-colorized image according to the color scale shown to the left. b shows the same image as in a at 89 min but only the 340 excitation emission at much higher gain. c shows the PBFI fluorescence emission ratio for four individual cells over time; cells were infected at the time indicted by the arrow. Similar results were found in 11 experiments as outlined in the results.
The TTSS of P. aeruginosa Does Not Form a Leaky Pore
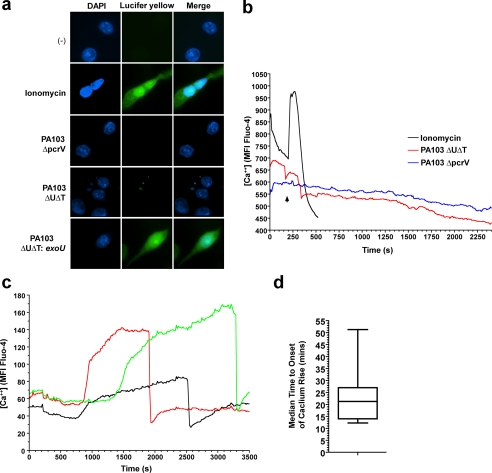
The observed changes in intracellular K+ following infection with P. aeruginosa suggests that interaction of cells with the TTSS of this microbe could lead to the formation of a leaky pore in the cell membrane which could mediate permeability to a number of different substances. To explore this further, we performed a number of assays to measure the entry or exit of a number of different molecules after infection of cells with PA103ΔUΔT. We infected RAW 264 murine macrophages with PA103ΔUΔT in the presence of the dye Lucifer yellow (MW 457). Under these conditions, any leakiness of the TTSS pore would allow entry of the dye into cells, where it can be readily detected by its intense fluorescence. This method has shown that the TTSS of Yersinia enterocolitica forms a leaky pore, but only in the absence of any translocated effectors (35). Under these conditions, we observed less than 1% of cells showing uptake of the dye (Fig. 9a). As a control, we performed the same assay after treating the cells with ionomycin which permeabilizes the cells (Fig. 9a). Additionally, we infected cells with the P. aeruginosa strain PA103ΔUΔT:ExoU that translocates ExoU, a potent phospholipase that rapidly permeabilizes cells and leads to cell death. This also produced extensive uptake of the dye (Fig. 9a), confirming the activity of the TTSS under these conditions.
FIGURE 9.
The P. aeruginosa type III secretion apparatus does not produce a leaky pore. a, RAW 264 murine macrophages were suspended in medium containing the fluorescent dye Lucifer yellow before treatment with ionomycin (5 μm) for 10 min, or infection with the indicated strains of PA103 at an MOI of 300 for 60 min. Following washing, entry of Lucifer yellow was detected by fluorescence microscopy (green fluorescence) and nuclei visualized by counterstaining with 4′,6-diamidino-2-phenylindole (DAPI) (blue). Images shown are representative of >300 cells analyzed. b, intracellular calcium concentration over time measured by Fluo-4 intensity in HeLa cells following treatment with 5 μm ionomycin (black line) or infection with PA103ΔUΔT (red line) or PA103ΔpcrV (blue line), both at an MOI of 150, at the arrow. Traces are integrated Fluo-4 mean fluorescence intensity (MFI) measured over an individual cell every 15 s. Identical traces were observed for >50 cells in each condition. c as in b but in cells infected with PA103ΔUΔT:ExoU. Three representative traces are shown out of more than 50 similar recordings. d, box and whisker plot showing the time to the onset of the calcium rise following infection with PA103ΔUΔT:ExoU. The box encloses the 25th to 75th percentile, with the line indicating the median value. The range is shown by the vertical bars. n = 10.
We then went on to test entry of smaller entities. We measured intracellular Ca2+ using the sensitive dye Fluo-4; we used HeLa cells as these provided a much clearer image than BMDM. Infection of cells loaded with this dye with either PA103ΔUΔT or PA103ΔpcrV produced no change in intracellular Ca2+ concentration, as measured by live cell imaging of fluorescence intensity of the Fluo-4 signal within the cells (Fig. 9b). Addition of ionomycin, however, rapidly permeabilized the cells, leading to an influx of Ca2+ from the extracellular medium as detected by the sharp rise in Fluo-4 fluorescence (Fig. 9b). The rapid decline in fluorescence signal following this rise likely reflects the subsequent complete loss of membrane barrier and leaking of the dye from the cell.
As a further control for the ability of this method to detect changes in intracellular Ca2+ concentration following infection, we repeated our observations but using infection with the P. aeruginosa strain PA103ΔUΔT:ExoU. Translocation of ExoU is reported to show a steady rise in intracellular Ca2+, prior to lysis of the cell membrane as the cell dies (38). Using this strain we observed that most cells showed a steady increase in intracellular Ca2+ concentration after an initial lag phase (Fig. 9c and supplemental Movie S2). The cells swell in this period and then suddenly rupture, leading to rapid loss of the Fluo-4 signal (Fig. 9c and supplemental Movie S2). This reflects cell lysis, as the cells become permeable to ethidium bromide contained in the culture medium, resulting in intense red nuclear fluorescence as shown in the supplemental Movie file. The time to the onset of the rise in Ca2+ concentration indicates the time required for the bacterium to elaborate a TTSS and begin translocation. The median time of this onset was 21.3 min (Fig. 9b); under the same conditions with the non-ExoU translocating bacteria no change in Ca2+ levels was seen for considerable periods beyond this time. Thus, under these conditions, there is no evidence of a leakiness following TTSS insertion that allows entry of Ca2+ into the cell.
DISCUSSION
The results presented here show, under a variety of experimental conditions, that raising extracellular K+ concentration above 90 mm is an effective inhibitor of activation of the NLRC4 inflammasome triggered by infection with a variety of strains of P. aeruginosa and by S. typhimurium. This activation can also be inhibited by blocking ATP-sensitive K+ channels with glybenclamide. Although most cells do not alter their intracellular K+ levels following infection, a significant minority show a drop in K+. This is a selective ion loss since no evidence could be found for a non-selective leaky pore following infection. Thus, we conclude that potassium efflux is required for NLRC4 activation of the inflammasome.
Why have other studies not observed an inhibitory effect of raised extracellular K+ concentration on NLRC4 inflammasome activation? In particular, reports of similar experiments using S. typhimurium did not find any reduction in inflammasome activation by raising extracellular K+ (21, 26, 39). We believe the key difference is the concentration of extracellular K+ required to inhibit the NLRC4 inflammasome, which is higher than the reported effective concentrations for inhibition of the NLRP3 inflammasome (36). Our data demonstrate that the extracellular K+ concentration needs to be above 90 mm before significant inhibition of the NLRC4 inflammasome is seen (Figs. 3 and 5). Inhibition of the NLRP3 inflammasome occurs at much lower extracellular K+ levels, although this does vary depending on the time of LPS pretreatment (36). Thus, Franchi et al. (26) apparently used an extracellular K+ concentration of 20 mm K+. This was sufficient to block the activation of the NLRP3 inflammasome by ATP but had no effect on S. typhimurium activation of the NLRP4 inflammasome. This would be entirely in keeping with our observations as well (Fig. 5). Similarly, Fink et al. (39) used an extracellular K+ concentration of 111 mm that inhibited NLRP1 activation by anthrax lethal toxin but did not inhibit inflammasome activation by S. typhimurium. Again, this level of K+ elevation did not produce dramatic reduction in NLRC4 activation in our hands (Figs. 3 and 5). Finally, Pétrilli et al. (21) did not see any inhibition of S. typhimurium activation of the NLRC4 inflammasome with extracellular K+ concentration of 130 mm. However, K+ levels were only raised after a 1 h infection period, which may well be sufficient time for the microbe to initiate inflammasome activation that is subsequently refractory to inhibition by raised extracellular K+. In conclusion, we feel that these differences in K+ concentration and time of addition of K+ account for the apparent differences in the results obtained in our study compared with other published experiments.
We did not find any significant drop in total intracellular K+ following infection with either P. aeruginosa or S. typhimurium (Fig. 7), which is in agreement with other studies (26). However, when we measured intracellular K+ in individual cells, we observed that a minority of cells (median of 14.84%) showed a reduction in potassium levels following infection. This is not sufficient to produce a significant loss in total cellular potassium (Fig. 7) but we believe could represent the cell population that triggers the inflammasome, activating caspase-1 and producing active IL-1β, as detected in our experiments. Why do not all cells show this decrease in potassium? Not all cells will become affected by TTSS processes during the time frame of our experiments; for example in one study using an ExoU secreting strain, after 4 h of infection only 40% cytotoxicity was observed (40). This reflects the need for the bacterium to elaborate a TTSS on contacting a cell, to establish a connection to the infected cell and then to pass a secreted toxin into the infected cell. In the relatively short times we used in our experiments, this will result in effective type III secretion in a minority of cells. It differs from ATP activation of the NLRP3 inflammasome, where opening of the P2X7 membrane pore would be expected to occur in every cell resulting in large scale efflux of potassium, as shown in Fig. 7.
However, despite the TTSS of P. aeruginosa resulting in potassium loss in some cells, it does not open a non-selective leaky pore on contact with the host cell membrane. We could not detect passage of calcium into cells (Fig. 9), and the dye Lucifer yellow could not enter infected cells when present in the medium (Fig. 9). The TTSS of the closely related organism, Y. enterocolitica, does form a leaky pore on contact with host cells (35), but only in the absence of any translocated effectors. The presence of effectors within the TTSS channel in this instance seems to plug any leakiness. The TTSS of P. aeruginosa is not leaky with or without translocated effectors. This is in agreement with studies demonstrating that TTSS exotoxins can only be translocated into host cells from a bacterium with a functional TTSS, and not when present in the culture supernatant (41, 42). It is also important to note that potassium loss alone is not sufficient for NLRC4 activation of the inflammasome, because in flagellin bearing strains such as PAO1, flagellin is absolutely required for inflammasome activation (28). We cannot presently explain how the PA103 strain of P. aeruginosa can activate the inflammasome, because it lacks flagellin (31). The data suggest that a pathogen-associated molecule that activates the NLRC4 inflammasome is translocated by the TTSS rather than generation of a non-selective pore in the cell membrane. Following this process, we propose that loss of potassium is required for subsequent activation of the inflammasome, perhaps by allowing oligomerization of inflammasome components. How the TTSS produces this selective potassium loss is not clear and will be the focus of future studies.
In conclusion, we demonstrate here that activation of the NLRC4 inflammasome is dependent on extracellular K+ concentration, but not as much as NLRP3. Our data show that infection with P. aeruginosa can result in potassium loss from a minority of cells. However, decline in potassium levels alone is not sufficient to result in NLRC4 activation, as other pathogen-derived signals are required.
Supplementary Material
Supplemental Data
Acknowledgments
We thank Allan Mowat and his group for help with culture of BMDMs.
*
This work was supported by the Wellcome Trust.
2
The abbreviations used are:
IL
interleukin
TTSS
type III secretion system
NLRC4
nucleotide-binding oligomerization domain, leucine-rich repeat, and caspase-activating recruitment domain (CARD) domain-containing protein 4
NLRP3
NLR pyrin domain-containing protein 3
ASC
apoptosis-associated speck-like protein containing a CARD
BMDM
bone-marrow derived macrophages
MOI
multiplicity of infection
PBFI
potassium-binding benzofuran isophthalate
ANOVA
analysis of variance
LPS
lipopolysaccharide
LDH
lactate dehydrogenase.
REFERENCES
- 1.Bergsbaken T., Fink S. L., Cookson B. T. (2009) Nat. Rev. Microbiol. 7, 99–109 [DOI] [PMC free article] [PubMed] [Google Scholar]
- 2.Martinon F., Mayor A., Tschopp J. (2009) Annu. Rev. Immunol. 27, 229–265 [DOI] [PubMed] [Google Scholar]
- 3.Yu H. B., Finlay B. B. (2008) Cell Host Microbe 4, 198–208 [DOI] [PubMed] [Google Scholar]
- 4.Franchi L., Eigenbrod T., Muñoz-Planillo R., Nuñez G. (2009) Nat. Immunol. 10, 241–247 [DOI] [PMC free article] [PubMed] [Google Scholar]
- 5.Dinarello C. A. (2009) Annu. Rev. Immunol. 27, 519–550 [DOI] [PubMed] [Google Scholar]
- 6.Ye Z., Ting J. P. (2008) Curr. Opin. Immunol. 20, 3–9 [DOI] [PubMed] [Google Scholar]
- 7.Mayor A., Martinon F., De Smedt T., Pétrilli V., Tschopp J. (2007) Nat. Immunol. 8, 497–503 [DOI] [PubMed] [Google Scholar]
- 8.Stehlik C., Lee S. H., Dorfleutner A., Stassinopoulos A., Sagara J., Reed J. C. (2003) J. Immunol. 171, 6154–6163 [DOI] [PubMed] [Google Scholar]
- 9.Ting J. P., Lovering R. C., Alnemri E. S., Bertin J., Boss J. M., Davis B. K., Flavell R. A., Girardin S. E., Godzik A., Harton J. A., Hoffman H. M., Hugot J. P., Inohara N., Mackenzie A., Maltais L. J., Nunez G., Ogura Y., Otten L. A., Philpott D., Reed J. C., Reith W., Schreiber S., Steimle V., Ward P. A. (2008) Immunity 28, 285–287 [DOI] [PMC free article] [PubMed] [Google Scholar]
- 10.Mariathasan S., Weiss D. S., Newton K., McBride J., O'Rourke K., Roose-Girma M., Lee W. P., Weinrauch Y., Monack D. M., Dixit V. M. (2006) Nature 440, 228–232 [DOI] [PubMed] [Google Scholar]
- 11.Sutterwala F. S., Ogura Y., Szczepanik M., Lara-Tejero M., Lichtenberger G. S., Grant E. P., Bertin J., Coyle A. J., Galán J. E., Askenase P. W., Flavell R. A. (2006) Immunity 24, 317–327 [DOI] [PubMed] [Google Scholar]
- 12.Martinon F., Pétrilli V., Mayor A., Tardivel A., Tschopp J. (2006) Nature 440, 237–241 [DOI] [PubMed] [Google Scholar]
- 13.Hornung V., Bauernfeind F., Halle A., Samstad E. O., Kono H., Rock K. L., Fitzgerald K. A., Latz E. (2008) Nat. Immunol. 9, 847–856 [DOI] [PMC free article] [PubMed] [Google Scholar]
- 14.Eisenbarth S. C., Colegio O. R., O'Connor W., Sutterwala F. S., Flavell R. A. (2008) Nature 453, 1122–1126 [DOI] [PMC free article] [PubMed] [Google Scholar]
- 15.Li H., Willingham S. B., Ting J. P., Re F. (2008) J. Immunol. 181, 17–21 [DOI] [PMC free article] [PubMed] [Google Scholar]
- 16.Cassel S. L., Eisenbarth S. C., Iyer S. S., Sadler J. J., Colegio O. R., Tephly L. A., Carter A. B., Rothman P. B., Flavell R. A., Sutterwala F. S. (2008) Proc. Natl. Acad. Sci. U.S.A. 105, 9035–9040 [DOI] [PMC free article] [PubMed] [Google Scholar]
- 17.Dostert C., Pétrilli V., Van Bruggen R., Steele C., Mossman B. T., Tschopp J. (2008) Science 320, 674–677 [DOI] [PMC free article] [PubMed] [Google Scholar]
- 18.Halle A., Hornung V., Petzold G. C., Stewart C. R., Monks B. G., Reinheckel T., Fitzgerald K. A., Latz E., Moore K. J., Golenbock D. T. (2008) Nat. Immunol. 9, 857–865 [DOI] [PMC free article] [PubMed] [Google Scholar]
- 19.Gurcel L., Abrami L., Girardin S., Tschopp J., van der Goot F. G. (2006) Cell 126, 1135–1145 [DOI] [PubMed] [Google Scholar]
- 20.Martinon F., Agostini L., Meylan E., Tschopp J. (2004) Curr. Biol. 14, 1929–1934 [DOI] [PubMed] [Google Scholar]
- 21.Pétrilli V., Papin S., Dostert C., Mayor A., Martinon F., Tschopp J. (2007) Cell Death Differ. 14, 1583–1589 [DOI] [PubMed] [Google Scholar]
- 22.Evans T. J. (2009) Future Microbiol. 4, 65–75 [DOI] [PubMed] [Google Scholar]
- 23.Brodsky I. E., Monack D. (2009) Semin. Immunol. 21, 199–207 [DOI] [PubMed] [Google Scholar]
- 24.Miao E. A., Alpuche-Aranda C. M., Dors M., Clark A. E., Bader M. W., Miller S. I., Aderem A. (2006) Nat. Immunol. 7, 569–575 [DOI] [PubMed] [Google Scholar]
- 25.Franchi L., Amer A., Body-Malapel M., Kanneganti T. D., Ozören N., Jagirdar R., Inohara N., Vandenabeele P., Bertin J., Coyle A., Grant E. P., Núñez G. (2006) Nat. Immunol. 7, 576–582 [DOI] [PubMed] [Google Scholar]
- 26.Franchi L., Kanneganti T. D., Dubyak G. R., Núñez G. (2007) J. Biol. Chem. 282, 18810–18818 [DOI] [PubMed] [Google Scholar]
- 27.Sutterwala F. S., Mijares L. A., Li L., Ogura Y., Kazmierczak B. I., Flavell R. A. (2007) J. Exp. Med. 204, 3235–3245 [DOI] [PMC free article] [PubMed] [Google Scholar]
- 28.Miao E. A., Ernst R. K., Dors M., Mao D. P., Aderem A. (2008) Proc. Natl. Acad. Sci. U.S.A. 105, 2562–2567 [DOI] [PMC free article] [PubMed] [Google Scholar]
- 29.Franchi L., Stoolman J., Kanneganti T. D., Verma A., Ramphal R., Núñez G. (2007) Eur. J. Immunol. 37, 3030–3039 [DOI] [PubMed] [Google Scholar]
- 30.Celada A., Gray P. W., Rinderknecht E., Schreiber R. D. (1984) J. Exp. Med. 160, 55–74 [DOI] [PMC free article] [PubMed] [Google Scholar]
- 31.Arora S. K., Dasgupta N., Lory S., Ramphal R. (2000) Infect. Immun. 68, 1474–1479 [DOI] [PMC free article] [PubMed] [Google Scholar]
- 32.Stirling F. R., Cuzick A., Kelly S. M., Oxley D., Evans T. J. (2006) Cell. Microbiol. 8, 1294–1309 [DOI] [PubMed] [Google Scholar]
- 33.Muruve D. A., Pétrilli V., Zaiss A. K., White L. R., Clark S. A., Ross P. J., Parks R. J., Tschopp J. (2008) Nature 452, 103–107 [DOI] [PubMed] [Google Scholar]
- 34.Minta A., Kao J. P., Tsien R. Y. (1989) J. Biol. Chem. 264, 8171–8178 [PubMed] [Google Scholar]
- 35.Neyt C., Cornelis G. R. (1999) Mol. Microbiol. 33, 971–981 [DOI] [PubMed] [Google Scholar]
- 36.Walev I., Reske K., Palmer M., Valeva A., Bhakdi S. (1995) EMBO J. 14, 1607–1614 [DOI] [PMC free article] [PubMed] [Google Scholar]
- 37.Ferrari D., Pizzirani C., Adinolfi E., Lemoli R. M., Curti A., Idzko M., Panther E., Di Virgilio F. (2006) J. Immunol. 176, 3877–3883 [DOI] [PubMed] [Google Scholar]
- 38.Jacob T., Lee R. J., Engel J. N., Machen T. E. (2002) Infect. Immun. 70, 6399–6408 [DOI] [PMC free article] [PubMed] [Google Scholar]
- 39.Fink S. L., Bergsbaken T., Cookson B. T. (2008) Proc. Natl. Acad. Sci. U.S.A. 105, 4312–4317 [DOI] [PMC free article] [PubMed] [Google Scholar]
- 40.Lee V. T., Smith R. S., Tümmler B., Lory S. (2005) Infect. Immun. 73, 1695–1705 [DOI] [PMC free article] [PubMed] [Google Scholar]
- 41.Sory M. P., Boland A., Lambermont I., Cornelis G. R. (1995) Proc. Natl. Acad. Sci. U.S.A. 92, 11998–12002 [DOI] [PMC free article] [PubMed] [Google Scholar]
- 42.McGuffie E. M., Frank D. W., Vincent T. S., Olson J. C. (1998) Infect. Immun. 66, 2607–2613 [DOI] [PMC free article] [PubMed] [Google Scholar]
Associated Data
This section collects any data citations, data availability statements, or supplementary materials included in this article.
Supplementary Materials
Supplemental Data
