BAC TransgeneOmics: a high-throughput method for exploration of protein function in mammals (original) (raw)
. Author manuscript; available in PMC: 2010 May 17.
Published in final edited form as: Nat Methods. 2008 Apr 6;5(5):409–415. doi: 10.1038/nmeth.1199
Abstract
The interpretation of genome sequences requires reliable and standardized methods to assess protein function at high throughput. Here we describe a fast and reliable pipeline to study protein function in mammalian cells based on protein tagging in bacterial artificial chromosomes (BACs). The large size of the BAC transgenes ensures the presence of most, if not all, regulatory elements and results in expression that closely matches that of the endogenous gene. We show that BAC transgenes can be rapidly and reliably generated using 96-well-format recombineering. After stable transfection of these transgenes into human tissue culture cells or mouse embryonic stem cells, the localization, protein-protein and/or protein-DNA interactions of the tagged protein are studied using generic, tag-based assays. The same high-throughput approach will be generally applicable to other model systems.
At a time when the ‘thousand-dollar genome’ seems a realistic goal for the near future, methods for dissecting the functions of the encoded genetic information lag far behind the genome sequence, both in throughput and in quality of the produced data. Genome sequencing and subsequent bioinformatics analysis have made it possible to study the function of genes in mammalian tissue culture cells using systematic reverse-genetic approaches1-3 and have radically improved researchers’ ability to identify human disease genes. Such studies typically identify single genes, whose biological function has often not yet been described. In order to place the proteins these genes encode in pathways, these studies must be followed by detailed molecular-level analysis, of which the most powerful types are protein localization and protein-protein interaction. The power of protein localization and protein-protein interaction studies can be seen from the genome-wide application of GFP localization and tandem affinity tag-based complex purification in the yeast Saccharomyces cerevisiae, which has produced a comprehensive picture of the core proteome of a simple, well-studied model system4-8. The key advantage of yeast for these studies was their efficient intrinsic homologous recombination, which allowed the same tag-coding sequence to be introduced at the endogenous locus of nearly every gene of the genome. The tagged proteins were then systematically analyzed through standardized, generic, tag-based assays.
To transfer this approach to mammalian cells, we require methods that produce data about localization and binding partners on a genome-wide scale. Any such method should satisfy at least two important criteria. First, it must provide reliable and reproducible expression of the tagged protein at levels and patterns matching those of the endogenous counterpart. Second, it must be an efficient and scalable procedure, suitable for high-throughput use.
Protein tagging in mammalian tissue culture cells is typically performed with cDNA-based transgenes that lack the normal endogenous noncoding regulatory information such as introns or 3′ untranslated regions (UTRs) and are usually driven by unrelated ubiquitous or tissue-specific promoters. As a result they do not reproduce the endogenous regulation at the transcriptional and post-transcriptional levels. Furthermore, the generation of sequence-verified, full-length cDNAs is expensive and laborious, especially for large or rare transcripts. As a result, comprehensive cDNA libraries are not available for most model organisms.
Transgenes based on large genomic clones such as bacterial artificial chromosomes (BACs) are often large enough to contain complete genes with all their endogenous regulatory sequences. Mapped BAC libraries are typically generated as part of genome sequencing projects and are readily available for most model organisms. The development of homologous recombination–based DNA engineering methods, commonly referred to as recombineering9,10, in Escherichia coli has enabled rapid and robust modification of these large constructs. We and others have previously described the successful use of recombineering to generate BAC transgenes and their use for expression and/or purification studies in mammalian tissue culture cells11,12, worms13, flies14, zebrafish15 and mice16,17. Recently, we have demonstrated that the fidelity of recombineering in E. coli is high enough to permit multiple DNA engineering steps to be carried out in liquid culture, thereby opening up a way for high-throughput application of this approach13.
Here we establish an efficient, generic and scalable approach for BAC-based transgenesis in mammalian tissue culture cells, which we term ‘BAC TransgeneOmics’. We describe high-throughput production of BAC transgenes using a robust procedure for 96-well-format recombineering and establish protocols for efficient, stable transfection of these large constructs. We demonstrate the versatility of this approach for the analysis of protein localization and protein-protein interactions and the mapping of DNA-binding sites of proteins.
RESULTS
BAC TransgeneOmics strategy
The general outline of our approach is shown in the flowchart of Figure 1a. First, we selected a suitable BAC clone containing the gene of interest and tagged it by recombineering in E. coli9,10,13,18. We then stably transfected the purified BAC transgene into cultured mammalian cells11,12 and performed protein localization, protein complex purification or chromatin immunopurification experiments either on transfected pools or after isolation of clones derived from single cells. The success rate at each step of the generation of transgenic cell lines was more than 80% (Fig. 1b), enabling the high-throughput application of this approach.
Figure 1.
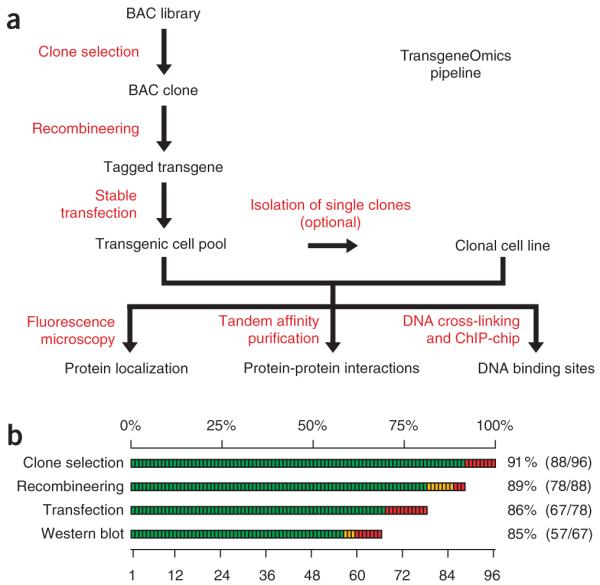
BAC TransgeneOmics pipeline. (a) Flow chart of the pipeline. (b) Efficiency of the BAC TransgeneOmics pipeline, with a summary of the efficiency of each experimental step. Green bars represent successful steps, yellow partially verified steps, red failure.
Design of N- and C-terminal tagging cassettes
As a generic protein tag, we selected a modified version of the ‘localization and affinity purification’ (LAP) tag19. This tag consists of (in the order used for purification) extended green fluorescent protein (EGFP) for localization and immunopurification, the PreScission protease cleavage site for native elution, S-peptide for a second affinity-purification step and a tobacco etch virus (TEV) protease cleavage site for a second native elution step. We constructed recombineering cassettes for tagging at either the N or C terminus of the protein. The N-terminal cassette (Fig. 2a) has a dual eukaryotic-prokaryotic promoter (PGK-gb2)20 driving a neomycin-kanamycin resistance gene within an artificial intron inside the tag coding sequence. The selection cassette is flanked by two loxP sites and can be permanently removed by Cre recombinase-mediated excision. The C-terminal cassette (Fig. 2b) contains the sequence encoding the tag followed by an internal ribosome entry site (IRES) in front of the neomycin resistance gene. In addition, a short bacterial promoter (gb3) drives the expression of the neomycin-kanamycin resistance gene in E. coli.
Figure 2.

Tagging cassettes and 96-well recombineering pipeline. (a,b) Tagging cassettes for C- and N-terminal end tagging. Schematic representation of a genomic region that contains the gene of interest (orange) and the cassettes for tagging at the N or C end. (a) In the N-terminal cassette, the neomycin-kanamycin resistance gene (neo) is placed inside an artificial intron flanked by loxP sites. (b) The C-terminal tag is inserted as a cassette with a neomycin resistance gene downstream of an internal ribosome entry site (IRES:neo). EGFP, enhanced green fluorescent protein; gb2, gb3, bacterial promoters; P, PreScission cleavage site; pgk, phosphoglycerate kinase (PGK) promoter; S, S-peptide; sa, splice acceptor; sd, splice donor; T, TEV cleavage site. (c) 96-well-format BAC recombineering, with actual time required for each experimental step shown. The cartoons at right represent the events that occur at the level of the individual bacterial cell along with the actual experimental manipulations. Bacterial cultures each containing a specific BAC clone and the pSC101gbaA plasmid are grown to early log phase at 30 °C (1). The temperature is shifted to 37 °C and expression of the proteins required for recombination is induced with l-arabinose (2). Cells are washed to remove the medium and the desalted tagging cassettes are electroporated (3,4). After recovery for 1 h (5), cells containing successfully recombined BACs are selected by overnight growth in the presence of kanamycin (6). Incubation at 37 °C also removes the recombination plasmid, which has the temperature-sensitive pSC101 origin of replication. Cm, chloramphenicol; SOC, rich medium for recovery after transformation; Tet, tetracyline; YENB, non-salt medium for electroporation.
High-throughput BAC tagging
To facilitate high-throughput production of the transgenic constructs, we developed a program (BACFinder) that automatically selects the most suitable BAC clone for any given mouse or human gene and generates the sets of PCR primers required for tagging and verification. An added advantage is that these cross-species BACs facilitate functional validation of the tagged transgene by specific RNAi knockdown of the endogenous gene product11,13.
We inserted the tagging cassettes, containing 50 nucleotides of PCR-introduced homology arms, into the BAC by recombineering, either behind the start codon (for the N-terminal tag) or in front of the stop codon (for the C-terminal tag) of the gene. All steps of transgene production were carried out in 96-well-plate format (Fig. 2). The E. coli cells that had successfully recombined the cassette were selected for kanamycin resistance in liquid culture. In the test experiment (Fig. 3a), about 90% of the reactions (88 of 96) survived the selection. In the control experiment (Fig. 3b), in which the transformation order was shifted so that the cassette and the BAC did not match, none of the clones grew under selection, indicating that the resistant cells are derived only from the specific recombineering reaction. By plating on selective agar, we determined that each saturated culture was derived from 10-200 independent recombination events (data not shown). We checked two independent clones for each reaction by PCR through the tag insertion point. Of the 88 BACs that grew in selective media, 85 (97%) yielded a PCR product of the expected size (see Supplementary Fig. 1 online).
Figure 3.

Pipeline fidelity and efficiency. (a,b) Fidelity of 96-well recombineering. Typical results of a 96-well-format recombineering experiment are shown (a). In the control experiment (b), the plate was inverted so that the BAC and the targeting cassettes did not match, resulting in virtually no background growth and thereby indicating that growth in selective medium is only a result of the intended recombination event and does not occur from random cassette integration. (c) Western blot analysis of 67 transgenic cell pools using an antibody to GFP. Lane 1 represents a wild-type HeLa cell control. For 57 cell pools (marked in green), a band of the expected size was detected (marked with *). For three genes, the band pattern did not represent the expected size (marked in yellow: lanes 3, 11, 57). For seven of the pools, no western blot band was observed (marked in red). In lane 9 (mUBE1), three bands matching the size of the human splice forms were detected. Numbers at left indicate molecular masses in kDa. More information on the tagged genes can be found in Supplementary Table 1 online.
A PCR check of the original, unmodified BACs showed that in most of the clones that failed to grow in selection, the targeted genomic region was missing (see Supplementary Fig. 1). This correlates well with the estimated 10% of chimeric, rearranged or wrongly mapped clones in the BACs used.
Generation of BAC transgenic cell lines
In a test of high-throughput transfection, 86% (67 of 78) of the transfected BACs gave antibiotic-resistant clones. For 90% (60 of 67) of the analyzed cell lines, we detected a distinct band on a western blot, indicating that almost all of the transgenic cells were expressing the transgene (Fig. 3c and Supplementary Table 1 online). In some cases, we observed additional specific bands that might have been caused by protein degradation or by endogenous variations resulting from alternative splicing, specific proteolytic processing in vivo or post-translational modifications.
The presence of endogenous transcriptional control elements in the transgene should translate into physiological expression levels. However, the integration site and potentially the number of integrated copies will be different in each independent cell line. To assess the copy number of the BAC transgenes in stably transfected cell lines, we used fluorescence in situ hybridization to locate the BAC clone in the nuclei of two transgenic cell lines (Supplementary Fig. 2 online). In both cases we detected the transgene at a single nuclear locus. A fluorescence in situ hybridization probe specific for the endogenous gene locus produced signal of similar size and intensity, indicating that the transgene has integrated in low or single copy number. The resolution of the method does not, however, allow us to precisely quantify the copy number of the transgene.
BAC transfection typically results in a pool of several independent lines. Even at the single-copy level, two independently generated lines might have different expression levels due to position effects and transgene fragmentation before integration. Although single cell–derived clones can be isolated if necessary, this step is very time consuming. As long as transgene expression does not differ substantially between the individual lines, it is preferable to perform the initial analyses directly on the clone pool. To evaluate the expression variation within the clone pools, we determined the percentage of cells expressing GFP in a pool of cells that was obtained after selection for G418 resistance selection. For 14 of 15 pools, more than 60% of the cells were GFP positive (Supplementary Table 2 online). To look into cell-to-cell variations in expression, we used fluorescence-activated cell sorting to analyze the GFP fluorescence intensity distribution within a pool of HeLa cells stably transfected with a mouse transgene consisting of the chromosome protein HP1β tagged with LAP. We found that the majority of the cells in the pool (59% or 88% for mouse HP1β tagged with LAP at the N or C terminus, respectively) expressed GFP at the same level (Supplementary Fig. 3 online). We also compared the relative expression level of mouse AURKB-LAP in the pool with five clonal cell lines by western blotting, which showed similar expression levels for the tagged and endogenous protein in the pool and clonal cell lines (Supplementary Fig. 3).
Our findings indicate that transgene expression levels do not vary significantly between independent BAC transgenic lines and clone pools and therefore can be used directly for downstream analyses. However, we note that this observation may not be for every transgene and will be gene dependent. In this case, single cell–derived lines can be generated and screened to identify an appropriate clone for further studies.
Tag-based protein localization
We selected 15 well-characterized genes for tagging and detection and reproduced the known localization patterns for 11 of them (Fig. 4a; Supplementary Fig. 3 and Supplementary Table 2). As expected, proteins that are subunits of a complex, such as AURKB and INCENP, localized to the same cell compartments.
Figure 4.

Localization and purification of tagged proteins. The evaluation of tag performance for protein localization and complex purification analyses is illustrated. The same 15 well-characterized genes were used for both assays (1, CDC2; 2, DYNC1H1; 3, DYNC1I1; 4, DYNLL1; 5, CDC23; 6, MIS12; 7, human MIS12; 8, TOR1AIP1; 9, INCENP; 10, AURKB; 11, Rab5C; 12, STAG2; 13, SGOL1; 14, TUBG1; 15, PCNA; all from mouse except as indicated). All genes were tagged at the C terminus; only Rab5C (11) was tagged at the N terminus. For further details, refer to Supplementary Table 2. (a) Localization. Localization of the tagged transgene with antibody to GFP is shown in red, that of antibody to α-tubulin in green and that of DNA in blue, localized with Hoechst 33342. Scale bars are 15 μm. Grayscale images show the GFP signal alone. (b) Purification. Silver-stained gel of the same 15 tagged proteins and their associated protein complexes is shown. Baits are marked with asterisks. Although some baits are barely visible, all of them were successfully identified by mass spectrometry (see Supplementary Table 2). Numbers at left indicate molecular masses in kDa.
To check whether the tag position influences the endogenous protein localization, we analyzed transgene expression for three proteins (HP1β, AURKB and Rab5C) tagged at both the N and C termini (Supplementary Fig. 3). LAP-tagged HP1β was readily detectable at its proper location in the nucleus and showed the expected dynamics through the cell cycle21,22 when tagged with either an N- or a C-terminal tag. In contrast, AURKB showed physiological localization dynamics through the cell cycle23 only when tagged at its C terminus, and Rab5C was found at its proper localization at endosomes only when tagged at its N terminus (Fig. 4a)24. These examples confirm that tagging of both termini is advisable, especially when the localization of the endogenous protein is unknown25.
Tag-based protein complex purification
To assess the utility of the LAP tag for affinity purification at endogenous expression levels, we purified the same 15 genes as described above. Because most of these proteins are known to form complexes during mitosis, we arrested cells in prometaphase using nocodazole. We copurified LAP-tagged bait proteins and endogenous prey proteins from cell extracts by two-step affinity purification. First the bait protein was pulled down with antibody to GFP (see Supplementary Methods online). Next, the recovered protein was specifically eluted by PreScission protease cleavage. The S-peptide part of the tag was then used for a second affinity-purification step. The isolated complexes were further analyzed by SDS-PAGE and silver staining to assess their purity and yield, followed by direct liquid chromatography–linked LTQ Fourier transform mass spectrometry (LC-MS/MS). We then identified protein interaction partners by database mining. Using 6 × 10⁷ cells cultured as monolayers, we were able to recover the baits for 15 of the 15 tested proteins (Supplementary Table 1). In a more wide-ranging selection of samples, we typically recover the bait in about 90% of cases (data not shown). Most of the immunoprecipitates showed a distinctive pattern of bands on a silver-stained SDS-PAGE gel (Fig. 4b), and copurifying proteins previously known to interact with the bait proteins were identified (Supplementary Table 1). For example the dynein, anaphase promoting complex/cyclosome (APC/C), cohesin and γ-tubulin complexes were purified in their entirety with this technique. For the APC/C complex, this is the first report of the isolation of the entire complex in mammalian cells by tag-based affinity purification.
Protein-DNA interaction analysis by tag-based ChIP
The determination of interaction sites for DNA binding proteins is another application that can greatly benefit from the BAC TransgeneOmics approach. Methods for genome-wide mapping of DNA binding sites based on chromatin immunopurification (ChIP) coupled with microarray analysis (ChIP-chip)26,27 or sequencing (ChIP-Seq)28-31 are available, but they usually rely on antibodies.
We evaluated the performance of the LAP cassette for ChIP using LAP-tagged transgenic cell lines for the human transcription factors forkhead box A1 (FOXA1), spliced X-box binding protein 1 (XBP1-S) and vitamin D receptor (VDR) in the human breast cancer cell line MCF7. All three lines showed expression patterns consistent with the physiological localization of the endogenous transcription factors (Supplementary Fig. 4 online). Furthermore, the interaction of VDR-LAP with a known VDR target site in MCF732 was dependent on the presence of its endogenous ligand vitamin D3 (Supplementary Fig. 5 online). Genome-scale ChIP-chip analysis (Supplementary Table 3 online) of VDR-LAP identified binding sites for putative target genes (Fig. 5a) that were highly enriched within 1 kb of transcription start sites (Fig. 5b) and may therefore indicate promoter regions.
Figure 5.

Identification of DNA-binding sites by chromatin immunopurification. (a) VDR-LAP binding is enriched in the promoter regions of putative VDR target genes. The binding profiles around the genes TPX2, RG9MTD2 and CLCN3 are shown as examples. (b) Distribution of VDR binding sites proximal to transcription start sites (TSSs). Frequencies of VDR binding sites residing within the downstream 10-kb or upstream 10-kb genomic regions were plotted to their relative positions to annotated TSSs. (c,d) Direct comparison of binding profiles for ChIP-chip assays using specific antibodies against the endogenous transcription factors (FOXA1 or XBP1) and the LAP tag across 800-kb genomic regions in MCF7 cells. The y axes in a, c and d denote minus log P values for enrichment of ChIP relative to input. Negative and positive values on the x axis in b indicate VDR binding regions located 5′ or 3′ of neighboring TSSs, respectively.
Recently, binding sites of FOXA1 and XBP1-S have been analyzed by ChIP33,34, and thus ChIP-grade antibodies against the endogenous proteins were available for a comparative analysis with our approach. We performed parallel ChIP-chip analyses with protein-specific antibodies (using the wild-type cell line) or a goat polyclonal antibody to EGFP directed against the LAP tag (using the transgenic lines). This comparison revealed similar binding profiles from the two approaches (Fig. 5c,d), with 87% (FOXA1) and 76% (XBP1-S) overlap of the identified binding sites (Supplementary Table 3).
These results showed that tag-based ChIP analysis produces results comparable to those of the conventional antibody-based approach.
BAC transgenesis in mouse ES cells
Although BAC tagging provides a convenient, quick way to assess protein function in mammalian cell culture, it is often desirable to study the role of a given protein during development and in adult organisms. With minor modifications, our BAC transgenesis protocol is applicable to embryonic stem (ES) cells. The example in Figure 6a,b show a BAC-transgenic ES cell line for GFP-tagged PCNA. As in the BAC-transgenic HeLa cells (Fig. 4a), PCNA-LAP showed dispersed nuclear localization in G1, consistent with the role of PCNA during DNA synthesis. The pluripotent ES cells can develop into any cell of the body, and they can be differentiated into many different cell types in vitro35-37. We generated ES-derived transgenic mice using laser-assisted eight-cell embryo injection technology38. At 13.5 days post coitum (d.p.c.), three out of the ten embryos showed fluorescence throughout the embryo, indicating that the transgenic ES cells had efficiently contributed to all cell lineages (Fig. 6c). Mouse embryonic fibroblasts derived from one of the transgenic embryos reproduced the expression pattern observed in the transgenic HeLa and ES cells (Fig. 6d,e). These findings indicate that the BAC transgenes can be used, through ES cells, to study protein function in transgenic mice and to derive transgenic primary cells.
Figure 6.

Generation of BAC-transgenic mice using mouse ES cells stably expressing mouse PCNA-LAP. (a) Immunolocalization of PCNA-LAP in fixed mouse ES cells (E14TG2a). (b) Overlay of the GFP staining (red) with α-tubulin (green) and DNA (blue) staining. (c) GFP fluorescence in isolated embryo (13.5 d.p.c.) derived from mouse PCNA transgenic ES cells. (d,e) Mouse embryonic fibroblasts (MEFs), isolated from inner organs of GFP-positive embryos, showed strong punctuated nuclear staining in S phase (arrowheads). Shown are differential interference contrast (DIC; d) and merged GFP signal (e) of living MEFs.
DISCUSSION
The analysis of protein localization and interaction, when complemented with phenotypic data from genome-scale loss-of-function screens, is often sufficient to unravel the molecular role of a protein of interest. Furthermore, the systematic analysis of protein localization and interaction data on a proteome scale would enable the assignment of putative functions for many proteins that do not produce detectable phenotypes in loss-of-function studies. Although these studies are feasible with the established antibody-based approaches, raising and testing specific antibodies for large sets of proteins can be very expensive and time consuming. In contrast, generic tag-based approaches are much more suitable for genome-scale application, as high-lighted by many recent yeast studies4,7,8.
The approach that we present here is the first solution for protein tagging in mammalian tissue culture cells that is comparable with that in yeast, in terms of both throughput and quality of the obtained data. The use of BACs for transgenesis enables the expression of the transgene from its native genomic environment, which includes most, if not all, regulatory elements, a situation closely resembling that of endogenous gene targeting. The method is applicable to very large genes, which are difficult to obtain as cDNAs. Unlike cDNA-derived transgenes, a single BAC transgene covers all alternative splice variants, except in the case of an alternative first (for N-terminal tagging) or last (for C-terminal tagging) exon. In most cases the addition of an exogenous tag has no obvious effect on protein function. There are cases, however, when the tag would not be tolerated, for example because of the presence of an important functional domain close to the tag insertion point. In such cases tagging of the opposite protein terminus is recommended. The tag combination that we use performs very well for protein localization, tandem affinity purification and ChIP. However, for further applications, tagging cassettes with different affinity epitopes and/or fluorescent proteins can be easily generated.
Notably, the BAC tagging approach can be applied, through ES cells, to protein function exploration within the multicellular context of the developing mouse embryo or adult mice. Furthermore, transgenic mice are a source of transgenic primary cells that are typically difficult to generate or maintain by other methods, and thus this method provides a reliable approach for protein tagging in many primary cell types.
The format of the BAC transgenic pipeline permits automation of most experimental steps. Although we have used standard cell culture techniques in the current study, automated cell culture systems are available from several commercial suppliers. Automated imaging and image analysis is rapidly evolving and already permits sophisticated localization based screens39,40. With the increasing sensitivity of mass spectrometry, protein interaction partners can be rapidly identified upon affinity purification from relatively small number of cells and affinity purification and mass spectrometry might soon be feasible in 96-well format. All these approaches will greatly benefit from the method we describe here.
Perhaps the most important step forward with this approach is that it can be easily transferred to any model system that permits stable transgenesis. The scalable format and highly efficient 96-well recombineering approach open up the possibility for rapid generation of comprehensive tagged BAC transgene resources with genome wide coverage, for which we propose the term ‘TransgeneOmes’. The method described has a success rate of 80-90% at each step of the pipeline, which enables the generation of hundreds of transgenic constructs and tens of transformed cell lines per person per month.
Supplementary Material
Supplementary Table 3
Supplementary Text and Figures
ACKNOWLEDGMENTS
We are grateful to J. Ellenberg and Z. Maliga for stimulating discussions, to K. Neugebauer for the help in establishing the ChIP protocol, and to O. Hudecz, C. Stingl and G. Mitulovic (Institute of Molecular Pathology) and A. Ssykor, M. Biesold, D. Richter, K. Kozak and D. Drechsel (Max Planck Institute for Molecular Cell Biology and Genetics) for excellent assistance. We thank I. Cheesman for helpful discussions. This work has been supported by the 6th Framework Program of the European Union, Integrated Project ‘MitoCheck’ (LSHG-CT-2004-503464), and by NGFN2 grant SMP-RNAi (01GR0402). Work in the laboratories of J.-M.P. and K.M. is supported by Boehringer Ingelheim, the GenAu Program, the Austrian Research Promotion Agency (FFG), the European Science Foundation and the Austrian Science Fund (FWF) via the EuroDynaProgram. A.F.S. received funding from the 6th Framework Program of the European Union, Integrated Project ‘Heroic’ (LSHG-CT-2005-018883). K.P.W. is supported by grant 1R01HG004428-01 from the National Human Genome Research Institute of the US National Institutes of Health. R.K. is supported by a long-term fellowship of the Human Frontier Science Program Organization. Y.T. was supported by the Uehara Memorial Foundation.
APPENDIX
METHODS
Supplementary protocols
Description of the antibodies, plasmids, strains and cell lines used, as well as detailed protocols for 96-well recombineering, BAC transfection, LAP-based localization, purification and ChIP-chip mapping of DNA binding sites, can be found in the Supplementary Methods.
Footnotes
Database accession codes.
The ChIP/chip data has been submitted to the Gene Expression Omnibus database with accession number GSE10845.
References
- 1.Kittler R, et al. Genome-scale RNAi profiling of cell division in human tissue culture cells. Nat. Cell Biol. 2007;9:1401–1412. doi: 10.1038/ncb1659. [DOI] [PubMed] [Google Scholar]
- 2.Paddison PJ, et al. A resource for large-scale RNA-interference-based screens in mammals. Nature. 2004;428:427–431. doi: 10.1038/nature02370. [DOI] [PubMed] [Google Scholar]
- 3.Kittler R, et al. An endoribonuclease-prepared siRNA screen in human cells identifies genes essential for cell division. Nature. 2004;432:1036–1040. doi: 10.1038/nature03159. [DOI] [PubMed] [Google Scholar]
- 4.Gavin AC, et al. Proteome survey reveals modularity of the yeast cell machinery. Nature. 2006;440:631–636. doi: 10.1038/nature04532. [DOI] [PubMed] [Google Scholar]
- 5.Gavin AC, et al. Functional organization of the yeast proteome by systematic analysis of protein complexes. Nature. 2002;415:141–147. doi: 10.1038/415141a. [DOI] [PubMed] [Google Scholar]
- 6.Ghaemmaghami S, et al. Global analysis of protein expression in yeast. Nature. 2003;425:737–741. doi: 10.1038/nature02046. [DOI] [PubMed] [Google Scholar]
- 7.Huh WK, et al. Global analysis of protein localization in budding yeast. Nature. 2003;425:686–691. doi: 10.1038/nature02026. [DOI] [PubMed] [Google Scholar]
- 8.Krogan NJ, et al. Global landscape of protein complexes in the yeast Saccharomyces cerevisiae. Nature. 2006;440:637–643. doi: 10.1038/nature04670. [DOI] [PubMed] [Google Scholar]
- 9.Muyrers JP, Zhang Y, Testa G, Stewart AF. Rapid modification of bacterial artificial chromosomes by ET-recombination. Nucleic Acids Res. 1999;27:1555–1557. doi: 10.1093/nar/27.6.1555. [DOI] [PMC free article] [PubMed] [Google Scholar]
- 10.Zhang Y, Buchholz F, Muyrers J, Stewart A. A new logic for DNA engineering using recombination in Escherichia coli. Nat. Genet. 1998;20:123–128. doi: 10.1038/2417. [DOI] [PubMed] [Google Scholar]
- 11.Kittler R, et al. RNA interference rescue by bacterial artificial chromosome transgenesis in mammalian tissue culture cells. Proc. Natl. Acad. Sci. USA. 2005;102:2396–2401. doi: 10.1073/pnas.0409861102. [DOI] [PMC free article] [PubMed] [Google Scholar]
- 12.Lipp JJ, Hirota T, Poser I, Peters JM. Aurora B controls the association of condensin I but not condensin II with mitotic chromosomes. J. Cell Sci. 2007;120:1245–1255. doi: 10.1242/jcs.03425. [DOI] [PubMed] [Google Scholar]
- 13.Sarov M, et al. A recombineering pipeline for functional genomics applied to Caenorhabditis elegans. Nat. Methods. 2006;3:839–844. doi: 10.1038/nmeth933. [DOI] [PubMed] [Google Scholar]
- 14.Venken KJ, He Y, Hoskins RA, Bellen HJ. P[acman]: a BAC transgenic platform for targeted insertion of large DNA fragments in D. melanogaster. Science. 2006;314:1747–1751. doi: 10.1126/science.1134426. [DOI] [PubMed] [Google Scholar]
- 15.Yang Z, et al. Modified bacterial artificial chromosomes for zebrafish transgenesis. Methods. 2006;39:183–188. doi: 10.1016/j.ymeth.2006.04.011. [DOI] [PubMed] [Google Scholar]
- 16.Testa G, et al. BAC engineering for the generation of ES cell-targeting constructs and mouse transgenes. Methods Mol. Biol. 2004;256:123–139. doi: 10.1385/1-59259-753-X:123. [DOI] [PubMed] [Google Scholar]
- 17.Yang L, Guan T, Gerace L. Integral membrane proteins of the nuclear envelope are dispersed throughout the endoplasmic reticulum during mitosis. J. Cell Biol. 1997;137:1199–1210. doi: 10.1083/jcb.137.6.1199. [DOI] [PMC free article] [PubMed] [Google Scholar]
- 18.Copeland NG, Jenkins NA, Court DL. Recombineering: a powerful new tool for mouse functional genomics. Nat. Rev. Genet. 2001;2:769–779. doi: 10.1038/35093556. [DOI] [PubMed] [Google Scholar]
- 19.Cheeseman IM, Desai A. A combined approach for the localization and tandem affinity purification of protein complexes from metazoans. Sci. STKE. 2005;266:pl1. doi: 10.1126/stke.2662005pl1. [DOI] [PubMed] [Google Scholar]
- 20.Angrand PO, Daigle N, van der Hoeven F, Scholer HR, Stewart AF. Simplified generation of targeting constructs using ET recombination. Nucleic Acids Res. 1999;27:e16. doi: 10.1093/nar/27.17.e16. [DOI] [PMC free article] [PubMed] [Google Scholar]
- 21.Fischle W, et al. Regulation of HP1-chromatin binding by histone H3 methylation and phosphorylation. Nature. 2005;438:1116–1122. doi: 10.1038/nature04219. [DOI] [PubMed] [Google Scholar]
- 22.Hayakawa T, Haraguchi T, Masumoto H, Hiraoka Y. Cell cycle behavior of human HP1 subtypes: distinct molecular domains of HP1 are required for their centromeric localization during interphase and metaphase. J. Cell Sci. 2003;116:3327–3338. doi: 10.1242/jcs.00635. [DOI] [PubMed] [Google Scholar]
- 23.Carmena M, Earnshaw WC. The cellular geography of aurora kinases. Nat. Rev. Mol. Cell Biol. 2003;4:842–854. doi: 10.1038/nrm1245. [DOI] [PubMed] [Google Scholar]
- 24.Barbieri MA, et al. Epidermal growth factor and membrane trafficking. EGF receptor activation of endocytosis requires Rab5a. J. Cell Biol. 2000;151:539–550. doi: 10.1083/jcb.151.3.539. [DOI] [PMC free article] [PubMed] [Google Scholar]
- 25.Simpson JC, Wellenreuther R, Poustka A, Pepperkok R, Wiemann S. Systematic subcellular localization of novel proteins identified by large-scale cDNA sequencing. EMBO Rep. 2000;1:287–292. doi: 10.1093/embo-reports/kvd058. [DOI] [PMC free article] [PubMed] [Google Scholar]
- 26.Ren B, et al. Genome-wide location and function of DNA binding proteins. Science. 2000;290:2306–2309. doi: 10.1126/science.290.5500.2306. [DOI] [PubMed] [Google Scholar]
- 27.Iyer VR, et al. Genomic binding sites of the yeast cell-cycle transcription factors SBF and MBF. Nature. 2001;409:533–538. doi: 10.1038/35054095. [DOI] [PubMed] [Google Scholar]
- 28.Barski A, et al. High-resolution profiling of histone methylations in the human genome. Cell. 2007;129:823–837. doi: 10.1016/j.cell.2007.05.009. [DOI] [PubMed] [Google Scholar]
- 29.Johnson DS, Mortazavi A, Myers RM, Wold B. Genome-wide mapping of in vivo protein-DNA interactions. Science. 2007;316:1497–1502. doi: 10.1126/science.1141319. [DOI] [PubMed] [Google Scholar]
- 30.Mikkelsen TS, et al. Genome-wide maps of chromatin state in pluripotent and lineage-committed cells. Nature. 2007;448:553–560. doi: 10.1038/nature06008. [DOI] [PMC free article] [PubMed] [Google Scholar]
- 31.Robertson G, et al. Genome-wide profiles of STAT1 DNA association using chromatin immunoprecipitation and massively parallel sequencing. Nat. Methods. 2007;4:651–657. doi: 10.1038/nmeth1068. [DOI] [PubMed] [Google Scholar]
- 32.Seoane S, Perez-Fernandez R. The vitamin D receptor represses transcription of the pituitary transcription factor Pit-1 gene without involvement of the retinoid X receptor. Mol. Endocrinol. 2006;20:735–748. doi: 10.1210/me.2005-0253. [DOI] [PubMed] [Google Scholar]
- 33.Carroll JS, et al. Chromosome-wide mapping of estrogen receptor binding reveals long-range regulation requiring the forkhead protein FoxA1. Cell. 2005;122:33–43. doi: 10.1016/j.cell.2005.05.008. [DOI] [PubMed] [Google Scholar]
- 34.Shen Y, Hendershot LM. Identification of ERdj3 and OBF-1/BOB-1/OCA-B as direct targets of XBP-1 during plasma cell differentiation. J. Immunol. 2007;179:2969–2978. doi: 10.4049/jimmunol.179.5.2969. [DOI] [PubMed] [Google Scholar]
- 35.Choi D, et al. In vitro differentiation of mouse embryonic stem cells: enrichment of endodermal cells in the embryoid body. Stem Cells. 2005;23:817–827. doi: 10.1634/stemcells.2004-0262. [DOI] [PubMed] [Google Scholar]
- 36.Haase I, et al. In vitro differentiation of murine embryonic stem cells into keratinocyte-like cells. Eur. J. Cell Biol. 2007;86:801–805. doi: 10.1016/j.ejcb.2007.07.001. [DOI] [PubMed] [Google Scholar]
- 37.Soundararajan P, Lindsey BW, Leopold C, Rafuse VF. Easy and rapid differentiation of embryonic stem cells into functional motoneurons using sonic hedgehog-producing cells. Stem Cells. 2007;25:1697–1706. doi: 10.1634/stemcells.2006-0654. [DOI] [PubMed] [Google Scholar]
- 38.Poueymirou WT, et al. F0 generation mice fully derived from gene-targeted embryonic stem cells allowing immediate phenotypic analyses. Nat. Biotechnol. 2007;25:91–99. doi: 10.1038/nbt1263. [DOI] [PubMed] [Google Scholar]
- 39.Neumann B, et al. High-throughput RNAi screening by time-lapse imaging of live human cells. Nat. Methods. 2006;3:385–390. doi: 10.1038/nmeth876. [DOI] [PubMed] [Google Scholar]
- 40.Pepperkok R, Ellenberg J. High-throughput fluorescence microscopy for systems biology. Nat. Rev. Mol. Cell Biol. 2006;7:690–696. doi: 10.1038/nrm1979. [DOI] [PubMed] [Google Scholar]
Associated Data
This section collects any data citations, data availability statements, or supplementary materials included in this article.
Supplementary Materials
Supplementary Table 3
Supplementary Text and Figures