Detecting 22q11.2 Deletions by Use of Multiplex Ligation-Dependent Probe Amplification on DNA from Neonatal Dried Blood Spot Samples (original) (raw)
Abstract
The 22q11 deletion syndrome, which is caused by a 1.5- to 3.0-megabase hemizygous deletion in chromosome 22q11.2, has a prevalence of 1/2000 to 1/4000. However, the syndrome presents with highly variable phenotypes and thus may be underestimated among Danish newborns. To establish a true incidence of 22q11.2 deletions among certain manifestations, eg, congenital heart disease, on selected Danes, a multiplex ligation-dependant probe amplification (MLPA) analysis was designed. The analysis was planned to be performed on DNA extracted from dried blood spot samples (DBSS) obtained from Guthrie cards collected during neonatal screening programs. However, the DNA concentration necessary for a standard MLPA analysis (20 ng) could not be attained from DBSS, and a novel MLPA design was developed to permit for analysis on limited amounts of DNA (2 ng). A pilot study is reported here that validates the new MLPA design using nine patients diagnosed with the 22q11.2 deletion and 101 controls. All deletions were identified using DNA extracted from DBSS, and no copy number variations were detected in the controls, resulting in a specificity and sensitivity of 100%. It is thereby concluded that the novel MLPA probe design is successful and reliable using minimal amounts of DNA. This allows for use of DBSS samples in a retrospective study of 22q11.2 deletion among certain manifestations associated with DiGeorge Syndrome.
The 22q11 deletion syndrome (22q11 DS) is one of the most frequent syndromes, with an estimated prevalence of 1/2000 to 1/4000 live births.1 In 1991, it was found to be caused by a deletion of 1.5 to 3 megabases on chromosome 22q11.2 by Scambler (among others).2 It became evident that 22q11 DS encompassed the formerly known DiGeorge sequence, velo-cardio-facial syndrome, Shprintzen syndrome, and Takao syndrome or CATCH 22.3 Today, the abbreviation 22q11 DS is used.1
Genomic rearrangements such as microdeletions and duplications of chromosome 22q11 are due to the presence of several copies of repeat sequence (Low-Copy Repeat, LCR22), which mediate nonallelic homologues recombination.4 Such LCRs might allow for mispairing and unequal crossing over between homologous chromosomes or allow intrachromosomal recombination and thereby generate a number of rearrangements and copy number changes.4 The extents of 22q11 deletions are variable, but approximately 87% of 22q11 DS deletions are thought to extend from LCR22-A to LCR22-D covering 3 megabases.5,6 Since 2002 it has been possible to detect copy number variations by multiplex ligation-dependent probe amplification (MLPA), and this method has been shown to be superior to fluorescence in situ hybridization (FISH).7,8 The clinical diagnostic consequence of this was demonstrated by Stachon et al9 who retested a group of 62 patients suspected of 22q11 DS. MLPA confirmed 22q11.2 deletions among 51 patients with positive FISH tests, and detected 2 deletions among the 11 patients with FISH negative results.9
We wished to perform MLPA analysis using dried blood spot samples (DBSS) punched out from Guthrie cards collected via the national phenylketonuria (PKU) neonatal screening program.10 This approach would enable us to achieve an early diagnosis of 22q11.2 deletion, which is very important to prevent or treat medical complications, alleviate the associated cognitive/psychological difficulties by instituting relevant support, and to provide information on the possible hereditary implications for close relatives. In addition, this approach facilitates research of the correlation between various conditions and 22q11.2 deletion, eg, congenital heart disease.
However, current extraction techniques produce a minute amount of DNA from DBSS (<2 ng/μl), which is insufficient to comply with standard MLPA analysis. Therefore, a novel design of MLPA probes has been developed in collaboration with MRC-Holland (Amsterdam, Holland) to permit MLPA analysis on small amounts of DNA. Here a pilot project is reported validating the new probe design.
Materials and Methods
Nine children with verified 22q11.2 deletions were recruited among members of The Danish Support Group for Carriers of 22q11 DS and Their Families. All copy number variations were diagnosed by FISH. Furthermore, 101 controls were picked at random among samples in the Danish PKU Register after approval from by PKU Steering Committee. DBSS with a diameter of 3.2 mm were punched out from the Guthrie card of each individual and stored at −20°C until DNA extraction.
DNA Extraction
Genomic DNA was extracted from the 3.2-mm punch using QIAamp DNA Micro Kit according to manufacturers protocol (Qiagen, Hilden, Germany). In brief, the blood spot was placed in 180 μl ATL buffer and 20 μl proteinase K and incubated at 56°C at 900 rpm for 1 hour. A volume of 200 μl buffer AL with 1 μl 1 carrier RNA was added and the sample was further incubated at 70°C shaking at 900 rpm for 10 minutes. The lysate was transferred to a QIAamp MinElute Column and centrifuged at 6000 × g for 1 minute. Flow-through was discarded and 500 μl buffer AW1 was added and centrifuged at 6000 × g for 1 minute. The step was repeated with buffer AW2. Flow-through was discarded and the membrane was dried at full speed (20,000 × g) for 3 minutes. Subsequently, the DNA was then eluted in 50 μl AE buffer by centrifugation at 20,000 × g for 1 minute. DNA concentrations were quantified using Quant-iT PicoGreen dsDNA reagent according to the manufacturer's protocol (Invitrogen, Carlsbad, CA) and the DNA was stored at 4°C until use.
MLPA Analysis
MLPA is a PCR based technique, which has proven to be valid in detecting gene dosage abnormality by relative quantifications of up to 50 different nucleic acid sequences in a single reaction.11 The standard MLPA technique requires a minimum of 20 ng DNA, and functions by quantifying probes that are added to genomic DNA samples and amplified in a multiplex manner. The relative quantity of each PCR product is proportional to the number of copies of target sequence. A redesigned SALSA sMLPA KIT X018-A1 probe mix (not commercially available) developed for 22q11 analysis on very small amounts of DNA was applied. SALSA sMLPA probemixes contain three DNA control fragments (D-fragments) of 94, 100 and 105 nucleotides (nt). The fragments at 94 nt and 105 nt are denaturation control fragments and the 100 nt fragment is a ligation-dependent control fragment. This mix only requires 2 ng of DNA due to the optimized probe design described elsewhere.12 In short, the rationale behind the probe optimization is to increase the GC content in one end of the universal primer sequence and decrease it in the other end. As a consequence the PCR reaction becomes more specific and less starting DNA material is required. This probe set detects copy number changes at seven loci within the long arm of chromosome 22 (Figure 1A). In addition, it contains fourteen reference probes in different regions not associated with chromosome 22q11.2 (see Supplemental Table S1 at http://jmd.amjpathol.org). MLPA was performed according to a modified protocol supplied by the manufacturer (MRC-Holland). In short, 3.2 to 9.1 ng genomic DNA and 1.5 μl additive was denatured and hybridized to 1.5 μl probe-mix (1 fmol/reaction = 125 pM per oligonucleotide) along with 1.5 μl MLPA buffer. The mix was incubated for 1 minute at 95°C followed by 16 hours' hybridization at 60°C. Next, the probes were ligated at 54°C for 15 minutes followed by an inactivation step of 5 minutes at 98°C. The PCR reaction was prepared using all of the ligation mix, PCR primers, polymerase, buffers, and water, and were amplified with the following conditions: 95°C for 20 seconds, 65°C for 80 seconds, for 35 cycles, followed by a final extension for 20 minutes at 72°C. Capillary electrophoresis was performed using ABI 3100 Genetic Analyzer (Applied Biosystems, Foster City, CA). A mix of 0.7 μl PCR reaction, 8.9 μl Hi-Di formamide and 0.4 μl GeneScan 600 LIZ Size Standard (Applied Biosystems) was denatured for 2 minutes at 95°C, spun down, and loaded. The nine patient samples were analyzed along with five control samples and all data were verified by a second MLPA reaction. Subsequently 96 control samples were run to evaluate assay specificity.
Figure 1.
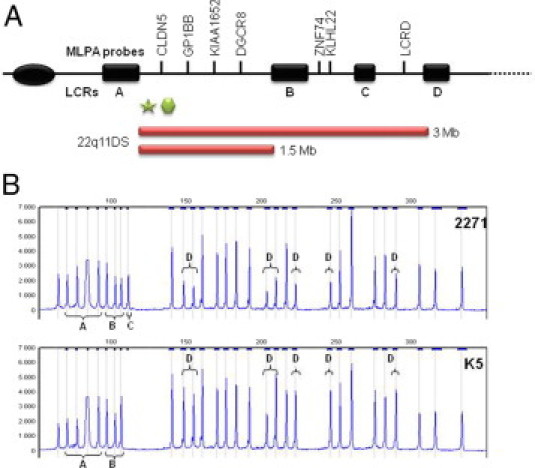
A: A schematic representation of the physical map of chromosome 22q11 showing the locations of MLPA probes (top), LCR22s (black boxes), N25 FISH probe (green star), TUPLE1 FISH probe (hexagon), and the most common 22q11 deletions (red bars). B: An example of a MLPA electropherogram showing reduced signals of 22q11 probes and control fragments: Q-fragments (A), D-fragments (B), Chr. X fragment (C), and 22q11 probe signals (D).
Data Analysis
ABI result files were normalized using the GeneMarker Software (Softgenetics, State College, PA), with a predefined panel. The purpose of the panel was to outline the position of expected probe products in the electropherogram based on PCR product length. Markers pointed out a range where a group of alleles were expected to appear, and bins indicated the specific base pair position of each allele. Raw data were normalized using Internal Probe Normalization, which adjusted peak intensities based on the intensities of the probes designated as controls in the Panel Editor. Normalization minimized or removed the effects of preferential amplification of smaller fragments during PCR. Peak intensities were thereby adjusted to the same scale within one sample for comparative purposes. The peak area data created by GeneMarker were imported to an Excel spread sheet for simple copy number calculations. The peak area of each probe was normalized by dividing its value with the sum of all control probe peak areas for that individual. To determine the relative copy number, this normalized probe peak area was divided with the average of the normalized peak areas for the same probe from control individuals in the same run.
Results
The DNA extracted from DBSS ranged in concentration between 0.8 and 2.28 ng/μL (mean 1.51 ng/μL ± 0.44) (Table 1). Four μL of each DNA sample (3.18 to 9.1 ng) were used in the MLPA reaction. This minimal amount could explain the visible DNA quantity fragments (Q-fragments) at 70, 76, 82, and 88 nt, which appear when less than 100 ng DNA is used (Figure 1B). High peak signals from two DNA denaturation control (D-fragments) at 94 and 105 nt and the ligation-dependant peak at 100 nt were also observed for each sample, indicating successful denaturation and ligation. Peak area data generated by GeneMarker software formed the basis for simple copy number computations. Reduced peak signal of 22q11 probes DGCR8, CLDN5, GP1BB, KIAA1652 (LCR A-B), KLKL22, ZNF74 (LCR B-C), and LCRD (LCR C-D) were observed in nine samples as predicted (Figure 2, Table 1). These probes spanned the region of 22q11.2, which is known to contain the deletions. Furthermore, calculations resulted in values of the 22q11 LCR22 A−D genes between 0.40 and 0.62 (mean 0.51 ± 0.056) corresponding to a copy number value of one (Table 1) and reference gene values between 0.83 and 1.24 (mean 1.00 ± 0.076) corresponding to the copy number value of two. All control samples displayed values between 0.81 and 1.17 (mean 1.00 ± 0.070) corresponding to a copy number value of two.
Table 1.
Relative Copy Number Values for 14 Control Probes and Seven 22q11 Probes in 10 Patients and Five Control Subjects
| Patient ID (ng/μL DNA) | ||||||||||||||
|---|---|---|---|---|---|---|---|---|---|---|---|---|---|---|
| Probe ID | 0019 | 1760 | 1907 | 2037 | 1053 | 2069 | 2271 | 5235 | 5682 | K1 | K2 | K3 | K4 | K5 |
| (1.79) | (1.10) | (1.30) | (1.19) | (1.55) | (1.23) | (0.98) | (1.67) | (1.81) | (0.80) | (2.28) | (2.01) | (2.01) | (1.47) | |
| 10p15 | 1.01 | 0.96 | 0.98 | 0.91 | 1.01 | 0.97 | 0.92 | 0.98 | 0.88 | 1.16 | 0.91 | 1.02 | 0.99 | 1.03 |
| 13q12 | 1.02 | 1.01 | 1.01 | 1.10 | 0.98 | 0.94 | 1.02 | 0.98 | 1.00 | 1.10 | 1.00 | 1.04 | 0.98 | 0.91 |
| 13q34 | 0.98 | 0.97 | 1.01 | 0.97 | 0.84 | 1.05 | 1.06 | 1.19 | 0.95 | 1.17 | 1.07 | 1.02 | 1.15 | 1.12 |
| 18p11 | 1.01 | 0.88 | 0.96 | 0.90 | 0.98 | 1.05 | 1.12 | 1.10 | 0.87 | 1.09 | 0.94 | 1.01 | 1.10 | 0.99 |
| 18q11 | 0.94 | 1.03 | 1.06 | 1.05 | 1.09 | 0.98 | 1.12 | 0.88 | 1.00 | 0.97 | 1.09 | 0.99 | 0.99 | 0.96 |
| 18q21 | 1.04 | 1.10 | 0.97 | 1.01 | 1.11 | 0.88 | 0.98 | 0.88 | 1.10 | 1.01 | 1.03 | 1.01 | 0.97 | 1.02 |
| 18q23 | 1.03 | 0.99 | 1.08 | 0.93 | 1.03 | 1.07 | 0.99 | 0.98 | 1.08 | 0.90 | 0.93 | 0.96 | 0.97 | 0.89 |
| 1q22 | 0.94 | 0.98 | 0.98 | 1.01 | 1.02 | 0.93 | 0.94 | 0.89 | 0.95 | 1.08 | 1.05 | 0.97 | 1.05 | 0.98 |
| 21q11 | 0.96 | 1.00 | 0.98 | 1.12 | 1.02 | 1.04 | 0.91 | 1.13 | 1.03 | 0.81 | 1.06 | 1.02 | 1.13 | 1.07 |
| 21q21 | 1.11 | 1.06 | 1.00 | 1.05 | 0.88 | 1.07 | 1.07 | 0.87 | 1.02 | 1.07 | 1.02 | 1.04 | 0.97 | 1.07 |
| 21q22 | 0.98 | 1.00 | 0.96 | 1.05 | 0.97 | 0.97 | 0.91 | 0.96 | 0.99 | 0.93 | 0.98 | 0.99 | 0.99 | 1.02 |
| 4q35 | 1.00 | 1.02 | 1.04 | 0.94 | 1.11 | 0.97 | 1.01 | 1.06 | 1.00 | 1.06 | 1.01 | 0.99 | 0.96 | 0.97 |
| 8p23 | 0.91 | 0.99 | 0.89 | 1.01 | 0.99 | 1.07 | 1.03 | 1.12 | 1.02 | 0.95 | 0.96 | 1.09 | 0.94 | 1.08 |
| 9q34 | 1.04 | 0.99 | 0.99 | 0.97 | 0.90 | 0.96 | 0.96 | 0.96 | 0.99 | 0.86 | 0.99 | 0.88 | 0.85 | 0.97 |
| A-B DGCR8 | 0.50 | 0.56 | 0.44 | 0.51 | 0.40 | 0.52 | 0.53 | 0.48 | 0.54 | 1.11 | 0.92 | 1.03 | 1.00 | 0.93 |
| A-B CLDN5 | 0.57 | 0.62 | 0.49 | 0.52 | 0.54 | 0.58 | 0.44 | 0.50 | 0.61 | 0.90 | 1.07 | 1.02 | 1.06 | 0.96 |
| A-B GP1BB | 0.51 | 0.52 | 0.43 | 0.47 | 0.49 | 0.42 | 0.44 | 0.51 | 0.41 | 0.90 | 0.96 | 1.03 | 0.85 | 0.97 |
| A-B KIAA1652 | 0.50 | 0.48 | 0.48 | 0.52 | 0.51 | 0.50 | 0.44 | 0.59 | 0.43 | 0.95 | 1.07 | 1.01 | 1.01 | 0.96 |
| B-C KLHL22 | 0.48 | 0.47 | 0.46 | 0.54 | 0.45 | 0.40 | 0.56 | 0.49 | 0.46 | 0.98 | 0.91 | 1.07 | 1.00 | 1.03 |
| B-C ZNF74 | 0.51 | 0.54 | 0.62 | 0.47 | 0.62 | 0.50 | 0.45 | 0.54 | 0.59 | 0.95 | 1.00 | 1.04 | 0.98 | 1.03 |
| C-D LCRD | 0.59 | 0.56 | 0.54 | 0.58 | 0.54 | 0.53 | 0.49 | 0.47 | 0.57 | 0.99 | 1.07 | 1.02 | 0.96 | 0.95 |
Figure 2.
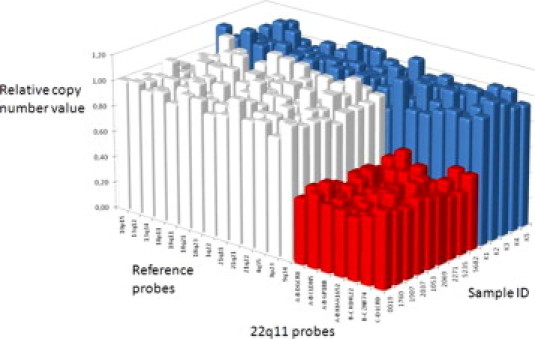
Graphical view of relative copy number values of all probes from each patient. Blue blocks represent the control group. White blocks represent the patients' control probes, and red blocks represent the patients' deleted probes.
DNA was subjected to MLPA analysis using an optimized probe mix for small amounts of DNA.12 All patients tested positive for a deletion in the 22q11.2 region. Of 63 probe ligation events in that region, 63 resulted in a correct copy number value giving rise to a sensitivity of 100%. Furthermore, all probes in 101 control samples, and all control probes in the 22q11 DS patients demonstrated a copy number value of two, which resulted in a specificity of 100%.
Discussion
The Danish PKU Register contains Guthrie cards collected since 1985 from almost every Danish citizen who attended the neonatal screening program. Due to the Central Person Register, it is possible to retrieve a DBSS from any person of interest. With the SALSA sMLPA KIT X018-A1 it is possible to screen selected groups of persons presenting with various symptoms of 22q11 DS for deletions/duplications of chromosome 22q11.2 using limited amounts of DNA material, exemplified here by using DNA available from neonatal blood samples.
The technique proved to be a reliable and accurate method to detect 22q11 deletions with sensitivity and specificity of 100%. As stated by others,7,8 MLPA has many advantages, as compared with standard FISH analysis: It is rapid, highly cost beneficial, and has a high resolution. FISH analysis is often based on commercially available probing for TUPLE1 or N25 situated in the proximal part of the typically deleted region. (Figure 1A) These probes can detect most 22q11 DS cases, but aberrations located distally to the probes are, of course, not detected. In addition, FISH does not provide any information about the size or extent of a deletion. On the contrary, the present 22q11 MLPA mix contains seven probes spanning the LCR A-D region. Thus, MLPA identifies both typical and atypical aberrations8,13,14,15,16 throughout the 22q11.2 region, and the MLPA results are suggestive of the extent of the deletion.
Other groups have pinpointed the advantages of MLPA, not only compared with FISH analysis, but also with quantitative PCR and microarrays.9,17 However, until now, none of the techniques, including MLPA, are able to analyze multiple loci using only a few nanograms of DNA. By optimizing the MLPA PCR reaction, we accomplished detection of copy number variations in a multiplex manner on as little as 3.2 ng DNA.
This advanced methodological sensitivity creates new potential in the area of molecular genetics. Since Guthrie in 196918 discovered that blood collected on filter paper is feasible in newborn screening for PKU, DBSS have routinely been used to determining the levels of many disease markers19 and the samples are in some countries or regions stored in biobanks subsequently.
Since DBSS are a limited and very valuable DNA source, it is highly beneficial that only one 3.2-mm punch is required for the analysis. This novel technique for 22q11.2 copy number variations detection allows for retrospective and prospective studies based on a single punch from these samples, eg, screening of a group of children with one or more manifestations of the 22q11 DS. Moreover, the probes in this kit can be combined with probes from other sensitive kits and thereby enable screening for several syndromes in one test, since the MLPA technique amplifies several probes at different chromosomes simultaneously. This permits early diagnosis, treatment, and possibly, prevention of disease-related difficulties. Furthermore, the screening results provide helpful information for close relatives that are concerned about hereditary implications.
It is an additional advantage that blood sample drawing is unnecessary. Today, analysis for syndromes requires blood samples. With the MLPA technique reported here, DNA can be extracted directly from Guthrie cards and evaluated without additional patient contact and unnecessary distress to the family.
Conclusion
It is confirmed that the SALSA sMLPA KIT X018-A1 is a valid way of detecting copy number variations on chromosome 22q11.2 when using DNA extracted from DBSS (0.8 to 2.28 ng/μL). It is thus possible to perform an early DNA analysis for 22q11.2 deletion in a noninvasive way using a single 3.2-mm punch from DBSS.
Footnotes
Web Extra Material
SALSA MLPA SX018-A1 DiGeorge probemix
References
- 1.Kobrynski LJ, Sullivan KE. Velocardiofacial syndrome. DiGeorge syndrome: the chromosome 22q112 deletion syndromes. Lancet. 2007;370:1443–1452. doi: 10.1016/S0140-6736(07)61601-8. [DOI] [PubMed] [Google Scholar]
- 2.Scambler PJ, Carey AH, Wyse RK, Roach S, Dumanski JP, Nordenskjold M, Williamson R. Microdeletions within 22q11 associated with sporadic and familial DiGeorge syndrome. Genomics. 1991;10:201–206. doi: 10.1016/0888-7543(91)90501-5. [DOI] [PubMed] [Google Scholar]
- 3.Wilson DI, Burn J, Scambler P, Goodship J. DiGeorge syndrome: part of CATCH 22. J Med Genet. 1993;30:852–856. doi: 10.1136/jmg.30.10.852. [DOI] [PMC free article] [PubMed] [Google Scholar]
- 4.Edelmann L, Pandita RK, Spiteri E, Funke B, Goldberg R, Palanisamy N, Chaganti RS, Magenis E, Shprintzen RJ, Morrow BE. A common molecular basis for rearrangement disorders on chromosome 22q11. Hum Mol Genet. 1999;8:1157–1167. doi: 10.1093/hmg/8.7.1157. [DOI] [PubMed] [Google Scholar]
- 5.Shaikh TH, Kurahashi H, Saitta SC, O'Hare AM, Hu P, Roe BA, Driscoll DA, Donald-McGinn DM, Zackai EH, Budarf ML, Emanuel BS. Chromosome 22-specific low copy repeats and the 22q11.2 deletion syndrome: genomic organization and deletion endpoint analysis. Hum Mol Genet. 2000;9:489–501. doi: 10.1093/hmg/9.4.489. [DOI] [PubMed] [Google Scholar]
- 6.Lindsay EA. Chromosomal microdeletions: dissecting del22q11 syndrome. Nat Rev Genet. 2001;2:858–868. doi: 10.1038/35098574. [DOI] [PubMed] [Google Scholar]
- 7.Fernandez L, Lapunzina P, Arjona D, Lopez P I, Garcia-Guereta L, Elorza D, Burgueros M, De Torres ML, Mori MA, Palomares M, Garcia-Alix A, Delicado A. Comparative study of three diagnostic approaches (FISH. STRs and MLPA) in 30 patients with 22q112 deletion syndrome. Clin Genet. 2005;68:373–378. doi: 10.1111/j.1399-0004.2005.00493.x. [DOI] [PubMed] [Google Scholar]
- 8.Vorstman JA, Jalali GR, Rappaport EF, Hacker AM, Scott C, Emanuel BS. MLPA: a rapid, reliable, and sensitive method for detection and analysis of abnormalities of 22q. Hum Mutat. 2006;27:814–821. doi: 10.1002/humu.20330. [DOI] [PMC free article] [PubMed] [Google Scholar]
- 9.Stachon AC, Baskin B, Smith AC, Shugar A, Cytrynbaum C, Fishman L, Mendoza-Londono R, Klatt R, Teebi A, Ray PN, Weksberg R. Molecular diagnosis of 22q11.2 deletion and duplication by multiplex ligation dependent probe amplification. Am J Med Genet A. 2007;143A:2924–2930. doi: 10.1002/ajmg.a.32101. [DOI] [PubMed] [Google Scholar]
- 10.Norgaard-Pedersen B, Simonsen H. Biological specimen banks in neonatal screening. Acta Paediatr Suppl. 1999;88:106–109. doi: 10.1111/j.1651-2227.1999.tb01172.x. [DOI] [PubMed] [Google Scholar]
- 11.Schouten JP, McElgunn CJ, Waaijer R, Zwijnenburg D, Diepvens F, Pals G. Relative quantification of 40 nucleic acid sequences by multiplex ligation-dependent probe amplification. Nucleic Acids Res. 2002;30:e57. doi: 10.1093/nar/gnf056. [DOI] [PMC free article] [PubMed] [Google Scholar]
- 12.Sorensen KM, Andersen PS, Larsen LA, Schwartz M, Schouten JP, Nygren AO. Multiplex ligation-dependent probe amplification technique for copy number analysis on small amounts of DNA material. Anal Chem. 2008, Dec 1;80(23):9363–9368. doi: 10.1021/ac801688c. [DOI] [PubMed] [Google Scholar]
- 13.Uddin RK, Zhang Y, Siu VM, Fan YS, O'Reilly RL, Rao J, Singh SM. Breakpoint Associated with a novel 2.3 Mb deletion in the VCFS region of 22q11 and the role of Alu (SINE) in recurring microdeletions. BMC Med Genet. 2006;7:18. doi: 10.1186/1471-2350-7-18. [DOI] [PMC free article] [PubMed] [Google Scholar]
- 14.Weksberg R, Stachon AC, Squire JA, Moldovan L, Bayani J, Meyn S, Chow E, Bassett AS. Molecular characterization of deletion breakpoints in adults with 22q11 deletion syndrome. Hum Genet. 2007;120:837–845. doi: 10.1007/s00439-006-0242-x. [DOI] [PMC free article] [PubMed] [Google Scholar]
- 15.Nogueira SI, Hacker AM, Bellucco FT, Christofolini DM, Kulikowski LD, Cernach MC, Emanuel BS, Melaragno MI. Atypical 22q11.2 deletion in a patient with DGS/VCFS spectrum. Eur J Med Genet. 2008;51:226–230. doi: 10.1016/j.ejmg.2008.02.001. [DOI] [PMC free article] [PubMed] [Google Scholar]
- 16.Ben-Shachar S, Ou Z, Shaw CA, Belmont JW, Patel MS, Hummel M, Amato S, Tartaglia N, Berg J, Sutton VR, Lalani SR, Chinault AC, Cheung SW, Lupski JR, Patel A. 22q11.2 distal deletion: a recurrent genomic disorder distinct from DiGeorge syndrome and velocardiofacial syndrome. Am J Hum Genet. 2008;82:214–221. doi: 10.1016/j.ajhg.2007.09.014. [DOI] [PMC free article] [PubMed] [Google Scholar]
- 17.Yang C, Huang CH, Cheong ML, Hung KL, Lin LH, Yu YS, Chien CC, Huang HC, Chen CW, Huang CJ. Unambiguous molecular detections with multiple genetic approach for the complicated chromosome 22q11 deletion syndrome. BMC Med Genet. 2009;10:16. doi: 10.1186/1471-2350-10-16. [DOI] [PMC free article] [PubMed] [Google Scholar]
- 18.Guthrie R. Screening for phenylketonuria. Triangle. 1969;9:104–109. [PubMed] [Google Scholar]
- 19.Guthrie R. The origin of newborn screening. Screening. 1992;1:5–15. doi: 10.1016/0925-6164(92)90025-z. [DOI] [PubMed] [Google Scholar]
Associated Data
This section collects any data citations, data availability statements, or supplementary materials included in this article.
Supplementary Materials
SALSA MLPA SX018-A1 DiGeorge probemix