A 1.5 million–base pair inversion polymorphism in families with Williams-Beuren syndrome (original) (raw)
. Author manuscript; available in PMC: 2010 Jun 22.
Published in final edited form as: Nat Genet. 2001 Nov;29(3):321–325. doi: 10.1038/ng753
Abstract
Williams-Beuren syndrome (WBS) is most often caused by hemizygous deletion of a 1.5-Mb interval encompassing at least 17 genes at 7q11.23 (refs. 1, 2). As with many other haploinsufficiency diseases, the mechanism underlying the WBS deletion is thought to be unequal meiotic recombination, probably mediated by the highly homologous DNA that flanks the commonly deleted region3. Here, we report the use of interphase fluorescence in situ hybridization (FISH) and pulsed-field gel electrophoresis (PFGE) to identify a genomic polymorphism in families with WBS, consisting of an inversion of the WBS region. We have observed that the inversion is hemizygous in 3 of 11 (27%) atypical affected individuals who show a subset of the WBS phenotypic spectrum but do not carry the typical WBS microdeletion. Two of these individuals also have a parent who carries the inversion. In addition, in 4 of 12 (33%) families with a proband carrying the WBS deletion, we observed the inversion exclusively in the parent transmitting the disease-related chromosome. These results suggest the presence of a newly identified genomic variant within the population that may be associated with the disease. It may result in predisposition to primarily WBS-causing microdeletions, but may also cause translocations and inversions.
The WBS phenotype, occurring in 1 of every 20,000 individuals worldwide, includes congenital vascular and heart disease, dysmorphic facies, growth deficiency, infantile hypercalcemia, mental retardation, unique cognitive profile and a characteristic personality4,5. Diagnosis of WBS includes testing for hemizygosity at 7q11.23 by FISH using a probe encompassing the elastin gene (ELN)1. In more than 95% of cases, there is a defined 1.5-Mb deletion (Fig. 1), but for the remaining individuals with WBS, there is no detectable chromosomal rearrangement6–8. In addition, in atypical affected individuals having a subset of symptoms, other chromosome rearrangements that usually affect 7q11.23 (and other parts of chromosome 7) have been described (Table 1)9–12.
Fig. 1.

The WBS region at 7q11.23. The rearrangement breakpoints in translocation patient 11719 and inversion patient 15441, as determined by FISH, are shown (top). We determined the locations of _Not_I sites for PFGE on the basis of both DNA sequence analysis and published work23. The four probes used for interphase FISH are represented in color as they appear in Fig. 2. The 18 probes used to fine-map the inversion breakpoints and to test for subtle chromosome rearrangements are indicated by gray circles. (left to right: RP11-421B22, RP5-845I21, RP4-635O5, HSC7E610, CTB-23I15, CTA-208H19, CTA-315H11, cos16g10, cos82c2, cos34b3, RP11-122H9, cos209c11, RP11-267N24, RP11-54H15, CTB-139P11, CTA-356E1, CTB-122E10, HSC7E139). Genes are depicted as arrows where the transcriptional orientation (5′ to 3′) is known, and as blocks when it is not known. An additional seven genes mapping between WBSCR14 and ELN were recently reported at the 2001 International Congress of Human Genetics (L.F. Magano et al.). DNA sequence scaffolds from Celera (component 3 assembly) and the public genome project are shown. Repetitive gene sequences within the duplicons are color-coded as in the legend; the duplicons themselves are presented as large vertical boxes shaded blue. The duplicons consist of actively transcribed genes (FKBP6, GTF2I, GTF2IRD2 and NCF1), highly conserved pseudogenes with near-identical genomic structure (GTF2IP1, GTF2IP2, NCF1P1, NCF1P2, GTF2IRD2P1, FKBP6P1, FKBP6P2) and pseudogenes corresponding to ancestral progenitors found at other sites on chromosome 7 (_PMS2_-like genes, three STAG3 pseudogenes and POM pseudogenes)13–17,24. Blocks of direct and inverted repeats exist between the duplicons. These are represented as A, B and C according to established nomenclature24. They include directly repeated blocks of DNA sequences greater than 65 kb in length with 98% identity within clones CTA-269P13 and CTA-350L10, and larger, inverted blocks spanning more than 120 kb, also with 98% identity within clones RP11-313P13 and RP5-953A4. We also identified a 1-kb sequence with 85% similarity to the pMD24 telomere-associated sequence18 in each WBS duplicon (in the same orientation as GTF2I/GTF2IP1). All probes are available upon request; additional information can be found at http://www.genet.sickkids.on.ca/chromosome7/. The minimal regions to which the inversion breakpoints could be localized, based on our analysis, are depicted by horizontal boxes at the bottom of the figure.
Table 1.
Clinical features of families with WBS having the inversion polymorphism
| Individual/relationship | Karyotype | Phenotype | FISHa |
|---|---|---|---|
| (i) Individuals with atypical WBS with chromosomal rearrangement | |||
| 11719 (proband) | 46 XX t(6;7)(q27;q11.23) | severe supravalvular aortic stenosis, hydrops fetalis; died shortly after birth | INV |
| 11976 (father of 11719) | 46 XY | no clinical phenotype | INV |
| 15441 (proband) | 46 XX inv(7)(q11.23;q21.3)b | ectrodactyly, WBS facies, developmental delay, strabismus, WBS-like behavior profile, lordosis, chronic otitis media, normal growth, inattention | INV |
| 16582 (mother of 15441) | 46 XX | no clinical phenotype | INV |
| 11532 (proband) | 46 XYt(6;7)(p10;p10) | WBS facies in childhood, developmental delay | not INV |
| (ii) Individuals with atypical WBS without cytogenetic rearrangement | |||
| 12503 (proband) | 46 XX | WBS facies, malocclusion, strabismus, joint tightness, hypersensitivity to sound, WBS-like behavior profile, developmental delay | INV |
| 16180 (mother of 12503) | 46 XX | no clinical phenotype | not INV |
| 16179 (father of 12503) | 46 XY | no clinical phenotype | not INV |
| plus seven other probands | four were 46 XXthree were 46 XY | various subset of WBS symptoms | all were not INV |
| (iii) transmitting parents of a WBS proband with the common deletion | |||
| 11107 (mother) | 46 XX | no clinical phenotype | INV |
| 8580 (father) | 46 XY | no clinical phenotype | INV |
| 9619 (mother) | 46 XX | no clinical phenotype | INV |
| 9912 (mother) | 46 XX | no clinical phenotype | INV |
| plus eight other transmitting parents | seven were 46 XXone was 46 XY | no clinical phenotype | all were not INV |
We determined that the intrachromosomal segmental DNA duplications flanking the WBS region (often called duplicons) are approximately 400 kb long (Fig. 1). These segmental duplications are comprised of blocks of nearly identical DNA (>95% identity), occurring in the same and opposite orientations. They contain transcribed genes, conserved pseudogenes with nearly identical genomic structure, pseudogenes corresponding to their ancestral progenitors found at other sites on chromosome 7 (refs.13–17) and putative telomere-associated repeats18. Misalignment and unequal cross-over of DNA sequences positioned in direct orientation within each of the larger duplicons could lead to a deletion as observed in WBS or to a duplication, which has not yet been observed. By contrast, misalignment and unequal cross-over of DNA sequences positioned in inverted orientation could lead to an inversion of the intervening region. In light of these findings, as well as observations made in other diseases19–22, we hypothesized that undetected genomic variation might exist at 7q11.23, contributing to the pathogenesis or mechanism underlying WBS.
To test for chromosomal inversion or duplication at 7q11.23, we initially carried out interphase FISH analysis of 11 individuals with atypical WBS and their parents (when available). The atypical individuals could be divided into two groups: (i) three with an inversion or translocation on chromosome 7 and (ii) eight with no detectable cytogenetic chromosomal rearrangement (Table 1). Using combinations of probes in three-color interphase FISH experiments (with two probes from within the common deletion and one from outside), we were able to determine the orientation of the 1.5-Mb WBS region relative to flanking DNA (Fig. 2). We could also estimate changes in copy number resulting from duplications or smaller deletions, as well as define boundaries of chromosome rearrangement.
Fig. 2.

Detection and characterization of the 1.5-Mb inversion in families with WBS by three-color interphase FISH. The inversion polymorphism is seen on one chromosome 7 in individuals with atypical WBS (12503, 15441) and from a parent transmitting WBS (11107), but not in a control individual. We used two different clone sets for FISH, both with two probes from within the common WBS-deletion interval, but with the third either telomeric (a) or centromeric (b) to the region. The order of probes along a normal chromosome 7 are shown above each figure (the black boxes along the line represent duplicons). a, The probes, from centromere to telomere, are CTA-208H19 (green), RP5-1186P10 (yellow) and CTB-139P11 (red; see Fig. 1). On the normal chromosome (N), the signals appear in the expected order. On the inverted chromosome (INV), the green signal appears between the red and yellow, indicating that an inversion of the region has occurred. b, The probes are, from centromere to telomere, RP11-815K3 (red), CTA-208H19 (green) and RP5-1186P10 (yellow). On the inverted chromosome (INV), the yellow signal appears between the red and green, indicating an inversion of the region. From our combined data, which include the FISH shown here, and by using additional probes, we show that the inversion breakpoints reside within the duplicon region (Fig. 1).
We identified an inversion of the 7q11.23 WBS region on the rearranged chromosome in atypical individuals 11719 and 15441, who carried a balanced translocation and a paracentric inversion, respectively (Figs. 2 and 3 and Table 1). We also detected the inversion in an individual with atypical WBS (12503), who, upon extensive FISH analysis, did not appear to have any other chromosomal anomaly. The father of affected individual 11719 and the mother of affected individual 15441, both phenotypically normal, also carried a hemizygous inversion of the WBS region. We did not observe any rearrangement in the other individuals with atypical WBS (Table 1).
Fig. 3.
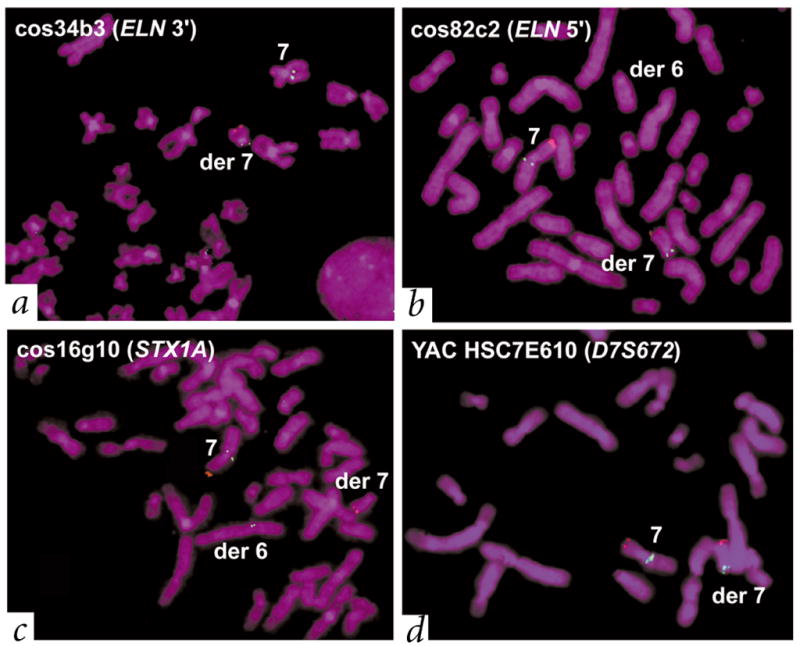
Individual with atypical WBS (11719) with a t(6;7)(q27;q11.23) translocation also carried the WBS inversion. The father (11976) of this affected individual also carries the inversion but not the translocation (Table 1). We used a control probe on chromosome 7p22 (RP11-13N3 containing LFNG, red) to identify the derivative chromosome 7. We used multiple test probes (green) to determine the site of the translocation and the extent of the inversion in patient 11719. a, b, We mapped the translocation breakpoint to the immediate 5′ end of ELN, on the basis of either the presence or absence of signals on the derivative chromosomes (see Fig. 1 for location; note that no deletions in the region were detectable). Characterization of the WBS inversion. c, d, We observed that probes cos34b3 and cos82c2 had the same pattern of hybridization to the translocation chromosomes as HSC7E610 (hybridizing to the derivative chromosome 7), whereas cos16g10 hybridized to the derivative chromosome 6. This suggests a probe order of HSC7E610 (D7S672)–cos34b3 (3′ ELN)–cos82c2 (5′ ELN)–cos16g10 (STX1A). On a normal chromosome, however, the known order of probes is 7cen–HSC7E610 (D7S672)–duplicon–cos16g10 (STX1A)–cos82c2 (5′ ELN)–cos34b3 (3′ ELN)–duplicon–7qter (see Fig. 1). Thus, patient 11719 carried the WBS inversion. The combined results of testing 20 probes using the same strategy indicate that the inversion breakpoints in this patient occurred within the duplicons.
Our observation of inversions in the parents of two unrelated individuals with atypical WBS carrying more complex chromosome rearrangements prompted us to examine parents of individuals with typical WBS (who carry the microdeletion). We reasoned that in a parent carrying an inversion on one chromosome, there may be difficulties in chromosome pairing at meiosis, resulting in the WBS deletion. Using the same interphase FISH assay, we observed a heterozygous inversion in 4 of 12 (33%) families (Fig. 2 and Table 1). In all cases, the inversion was present only in the parental genome (three maternal, one paternal) transmitting the chromosome that had presumably undergone unequal recombination, as determined by polymorphic marker analysis (_P_=0.0038 versus non-transmitting chromosomes; Fig. 4). We did not observe the inversion in the non-transmitting WBS parents, or in 7 of the 8 individuals with atypical WBS who had no cytogenetically visible chromosome rearrangement (Table 1), or in the 26 unrelated, unaffected control individuals. We did not observe chromosomal duplication in any of the cases studied.
Fig. 4.
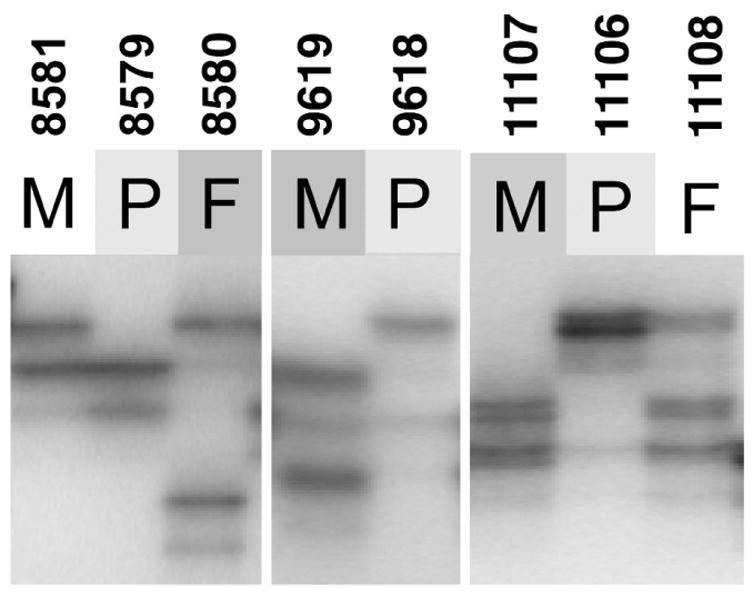
Polymorphic DNA marker analysis in families with WBS. Analysis of the WBS-deletion region at 7q11.23 identifies the microdeletion-containing chromosome in WBS probands to be inherited from the parent carrying the inversion. Representative results are shown for three families with WS13 (D7S3197), a polymorphic (TAGA)n repeat marker that resides within the unique 5′ end of GTF2I and, therefore, within the WBS microdeletion (Fig. 1). Proband 8579 shows loss of the paternal allele (8580), whereas probands 9618 and 11106 show loss of the maternal allele (9619 and 11107). In each case, these are the parents that carry the inversion chromosome (see Table 1). P, proband; F, father; M, mother.
To confirm our initial observations and to define the extent of the inversion in different individuals, we carried out additional FISH and PFGE experiments. Using combinations of FISH probes to examine interphase and metaphase chromosome preparations, we consistently saw that the inversion breakpoints in each individual studied occurs within the duplicon region (Figs. 2 and 3). For example, by examining metaphase chromosomes of patient 11719 [t(6;7)(q27;q11.23)], we were able to study the proximal and distal parts of the WBS region in isolation, as they reside on different derivative chromosomes. Probes mapping outside the WBS region were always located on the expected derivative translocation chromosome; however, probes residing between either duplicon and the translocation breakpoint (which was mapped to the 5′ end of ELN; Figs. 1 and 3) within the WBS region always hybridized to the derivative chromosome. This is opposite to what would be expected in normal chromosomes. Although the inversion breakpoints could be mapped within the 400-kb repeat interval, the precise site of rearrangement could not be determined because the DNA sequences among the duplicons are nearly identical.
Using PFGE blot–hybridization analysis with the diagnostic rarely cutting restriction endonuclease _Not_I and _GTF2I_-specific probes, we detected a new fragment ranging from 500–600 kb only in individuals shown by FISH to carry the inversion polymorphism (Fig. 5). Generation of a new _Not_I fragment in this size range is consistent with expected structural changes in the chromosome that would arise from an inversion occurring via recombination between the flanking duplicons (Fig. 1)23,24. Variation in size of the _Not_I junction fragments could be due to the breakpoints occurring within different segments of inverted blocks of repeat between the duplicons (Fig. 1, blocks A, B, C). Notably, the phenotypically normal inversion breakpoint carriers studied by PFGE (8580, 11107, 9912) all have similarly sized _Not_I junction fragments (600 kb), whereas an atypical WBS individual (12503) carries a smaller fragment (approximately 500 kb; Fig. 5). It is possible that a subtle rearrangement accompanying the inversion or polymorphism could contribute to this difference.
Fig. 5.
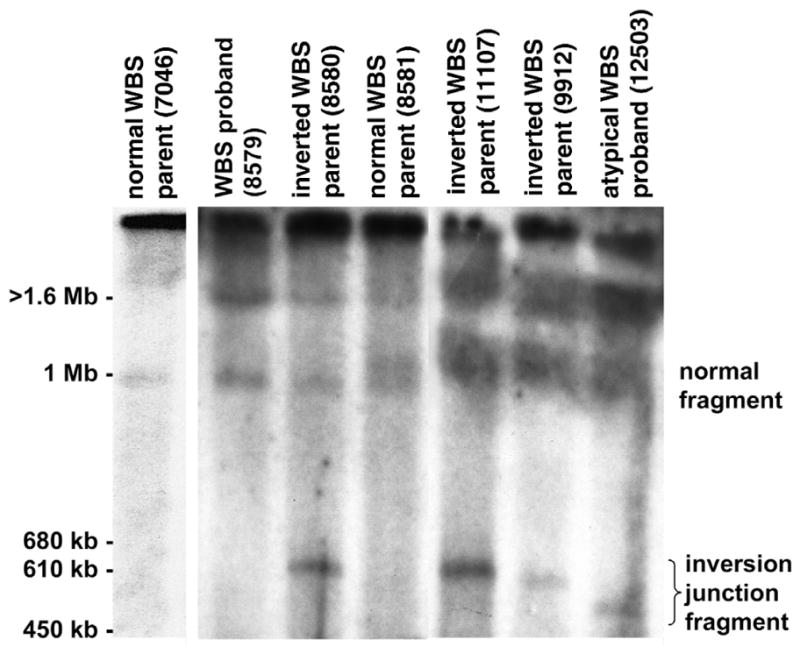
A new _Not_I–PFGE restriction fragment in individuals carrying the WBS inversion. _Not_I-digested genomic DNA from families with WBS was fractionated by PFGE and examined by blot-hybridization analysis using a _GTF2I_-specific probe (corresponding to the 3′ UTR of GTF2I; nt 2134–2638 of GenBank NM_032999). A representative result with resolution of fragments in the 450 kb–1.6 Mb range is shown. We observed a new _Not_I junction fragment only in those individuals (8580, 11107, 9912, 12503) shown by FISH to carry the WBS inversion. In normal individuals, the GTF2I probe should detect _Not_I fragments 3 Mb and 1 Mb in size on the centromeric and telomeric side of the WBS region, respectively. Note that GTF2I is present at each end of the WBS region and therefore hybridizes to two _Not_I fragments (see Fig. 1)23. Our results (lane 2, WBS proband 8579) and those previously published23 show that the 1.5-Mb microdeletion observed in individuals with WBS leads to the formation of a 4-Mb junction fragment, in addition to the 3-Mb and 1-Mb _Not_I fragments present on nondeleted (normal) chromosomes. The 3-Mb and 4-Mb _Not_I fragments remain in the compression zone on this gel; the 1-Mb band is visible (lane 2). In carriers of the WBS inversion, the _Not_I junction fragment is in the 500–600 kb range. This size is consistent with what would be predicted if the inversion breakpoints occurred within the duplicons, as was known to be the case based on our FISH results (see Fig. 1). Such an event would lead to a reduction in size of the 1-Mb _Not_I-fragment on the rearranged chromosome, as we observed when probing with GTF2I (the identity of the new 500–600-kb fragment was also confirmed by hybridization with an _HIP1-_gene probe). The extent in reduction of size of the 1-Mb _Not_I fragment would depend on the site of the inversion breakpoint(s) within the duplicon. In parent 8581 with WBS (lane 4), who does not carry the inversion, we observed a 1.1-Mb _Not_I fragment in addition to the normal 1-Mb fragment. This may be due to size polymorphism within the WBS region occurring on one chromosome.
Our results indicate that the WBS region can undergo two relatively large genomic rearrangements, deletion and inversion, both apparently mediated by the repeating units flanking the interval. The presence of the inversion in parents of children with WBS suggests that this genomic variant may lead to disturbances in meiosis predisposing to chromosome rearrangements in future generations. This phenomenon has also been reported for the olfactory receptor gene cluster region on chromosome 8p25. As the number of reported families with WBS with more than one affected individual is small26, this would be a rare event. Most inversion carriers do not have any obvious phenotypic features, although in at least two individuals (12503 and 15441) the inversion seems to be associated with many WBS symptoms (Table 1). Our data indicate that the inversion breakpoints in these two individuals reside within the duplicons, just as in each of the other phenotypically normal WBS-inversion cases studied. It appears from PFGE experiments that either the site of the breakpoint(s) or the extent of rearrangement in individual 12503 could be different. It may be that breakpoint(s) in 12503 and 15441 interrupt or affect the expression of functional gene(s) located within or near the duplicon (it is also possible that there is a mutation or rearrangement that we have not yet found). We hypothesize that GTF2I may be affected because it is located partially inside the telomeric duplicon. In addition, we observed that GTF2I is deleted in individuals with WBS who carry sub-WBS deletions and have a phenotype similar to that of individuals 12503 and 15441 (ref. 10).
The majority (~67%) of WBS-region interstitial deletions have been shown to be due to unbalanced recombination during meiosis (interchromosomal rearrangement); fewer (~33%) seem to arise due to intrachromosomal recombination3. To determine if the inversion polymorphism is associated with one or both events and to provide better estimates of recurrence risk to siblings, we will need to expand our study to include grandparents and sibs. So far, our finding that approximately 30% of transmitting chromosomes in families with WBS carry a genomic inversion provides new insight into the mechanism underlying the disease. The FISH and PFGE tests we describe for detection of the inversion will be valuable in assisting in clinical diagnosis of WBS and for family planning. Our findings also support the idea that genomic polymorphism may be an important contributor in other disease-associated recurrent chromosomal rearrangements that were previously thought to be stochastic in nature.
Methods
Patient samples and controls
We ascertained WBS probands through the University of Arizona Genetics Program (15441), Virginia Commonwealth University (12503), Yale University School of Medicine (4 atypical individuals), McMaster University Medical Centre (1 atypical individual) and The Hospital for Sick Children, Toronto (remaining atypical and all individuals with classic WBS). We diagnosed WBS using recognized diagnostic criteria. We followed local guidelines for human subject experimentation. Proband 11719 was a neonate with severe supravalvular aortic stenosis and hydrops fetalis12, who died shortly after birth. Proband 12503 is an 18-year-old female with WBS-like facial features, developmental delay, hypersensitivity to sound, malocclusion, strabismus, joint tightness and WBS-like behavior. Proband 15441 is a 16-year-old female with ectrodactyly of the feet, WBS-like facial features, strabismus, musculoskeletal abnormalities, mild developmental delay, recurrent otitis media resulting in hearing loss, hyperactivity and WBS-like behavior. In addition to the WBS inversion, she also has a larger inversion on chromosome 7 with breakpoints at 7q11.2 (over 1 Mb proximal to the WBS deletion, near D7S726) and at 7q21.3 (within the SHFM1 critical region). The families with WBS were of different ethnic backgrounds; we therefore used as controls 26 randomly selected non-WBS cell lines and blood samples (52 chromosomes) from ethnically diverse sources.
Using Fisher’s exact test, we compared the frequency of the inversion on the chromosomes of parents with WBS who transmitted the WBS deletion to their child with its frequency on control chromosomes. For this analysis, the disease-transmitting chromosomes came from the transmitting parent in the 12 families with typical WBS deletion (_n_=24) and the control chromosomes came from both the control group (_n_=52) and the non-transmitting parents of individuals with WBS (_n_=16).
Mapping and sequence analysis
We assembled an integrated genetic, physical, DNA-sequence and gene map spanning the WBS region using new mapping data, our published data14 and other published information23,24 and annotating all available DNA sequence (Fig. 1). We identified a pMD24-like telomere-associated sequence using BLAST. We carried out percent identity plot (PIP) analysis on the completed sequence of clones CTA-350L10, CTA-269P13, RP11-313P13 and RP5-953A4 using the automated analysis server PipMaker27. We generated additional genetic markers for the studies, including WS13 (D7S3197; Fig. 4). We carried out polymorphic marker analysis by gel electrophoresis and the hybridization of products PCR-amplified from peripheral blood lymphocyte genomic DNA.
Fluorescence in situ hybridization (FISH)
The protocols for FISH analysis were based on techniques established by our group28,29. Briefly, for metaphase analysis, we cultured lymphocytes for 68–72 h, synchronized them with BrdU (0.18 μg/ml, Sigma) and then washed and re-cultured them for 6 h in α-MEM with thymidine (2.5 μg/ml; Sigma). We collected cells, prepared slides by hypotonic treatment, and then fixed and air-dried them. For interphase analysis, we dried slides from cell lines or peripheral blood at room temperature for 3 days. Before hybridization, we denatured all slides in 70% formamide/2 × SSC for 30 s at 70 °C and dehydrated them with ethanol. We isolated genomic DNA from clones and labeled it with either biotin (green) or digoxigenin (red) to generate 500-bp fragments. For the dual-color signal (yellow), we labeled DNA separately with biotin and digoxigenin, and then mixed it. Probes were denatured for 5 min at 75 °C and hybridized to slides overnight (37 °C in 50% formamide with _C_0_t_-1 DNA). We washed the slides and added detection solution, then stained them with DAPI and examined them under a fluorescence microscope. Using these experimental conditions, the efficiency with which we detected metaphase chromosomes was 90–99%, enabling assessment of the position of the hybridization signal relative to the rearrangement breakpoint. We randomized the individuals with WBS, family members and controls to avoid bias in the interpretation of results. We examined approximately 100 mitotic figures for each probe tested. In assessing inter-phase cells, we scored only those chromosomes where all three probes could be visualized in close alignment with each other (we scored at least 25 chromosomes for each individual).
Pulsed-field gel electrophoresis
We embedded patient lymphoblast cell lines in low–melting point agarose at a concentration of approximately 107 cells/ml and prepared high–molecular weight DNA by incubation with sodium sarkosyl and proteinase K. We digested the DNA blocks with _Not_I restriction endonuclease (New England Biolabs) and size-fractionated them through 1% agarose using a CHEF-II apparatus. We ran multiple gels under different conditions (the conditions shown in Fig. 5 were 40–90 s pulse-time at 7 V/cm for 20 h). We used undigested Saccharomyces cerevisiae chromosomes as size markers. We transferred the gels to nylon membranes and hybridized them in Ambion hybridization buffer at 50 °C, then washed them at 55 °C.
Accession numbers
GenBank accession numbers: WS10, G68164; WS11, G68161; WS12, G68162; WS13, G68163; pMD24, AF020782; cos24g11, AZ757825/AZ757826.
Acknowledgments
We thank the affected families and their clinical support staff for continued assistance on this project, as well as The Centre for Applied Genomics at the Hospital for Sick Children in Toronto, the Canadian Genetic Diseases Network, and P. Marsden for technical support. The work is sponsored by the Canadian Institutes for Health Research (CIHR). L.C.T. is a Distinguished Scientist of the CIHR and Seller Chair of Cystic Fibrosis Research; L.R.O. and S.W.S. are Scholars of the CIHR.
References
- 1.Ewart AK, et al. Hemizygosity at the elastin locus in a developmental disorder, Williams syndrome. Nature Genet. 1993;5:11–16. doi: 10.1038/ng0993-11. [DOI] [PubMed] [Google Scholar]
- 2.Osborne LR. Williams-Beuren syndrome—unraveling the mysteries of a microdeletion disorder. Mol Genet Metab. 1999;67:1–10. doi: 10.1006/mgme.1999.2844. [DOI] [PubMed] [Google Scholar]
- 3.Baumer A, et al. High level of unequal meiotic crossovers at the origin of the 22q11. 2 and 7q11.23 deletions. Hum Mol Genet. 1998;7:887–894. doi: 10.1093/hmg/7.5.887. [DOI] [PubMed] [Google Scholar]
- 4.Greenberg F. Williams syndrome professional symposium. Am J Med Genet Suppl. 1990;6:85–88. doi: 10.1002/ajmg.1320370617. [DOI] [PubMed] [Google Scholar]
- 5.Pober BR, Dykens EM. Williams syndrome: an overview of medical, cognitive, and behavioural features. Child Adoles Psychiatr Clin N Am. 1996;5:929–943. [Google Scholar]
- 6.Lowery MC, et al. Strong correlation of elastin deletions, detected by FISH, with Williams syndrome: evaluation of 235 patients. Am J Hum Genet. 1995;57:49–53. [PMC free article] [PubMed] [Google Scholar]
- 7.Nickerson E, Greenberg F, Keating MT, McCaskill C, Shaffer LG. Deletions of the elastin gene at 7q11.23 occur in approximately 90% of patients with Williams syndrome. Am J Hum Genet. 1995;56:1156–1161. [PMC free article] [PubMed] [Google Scholar]
- 8.Mari A, et al. Analysis of the elastin gene in 60 patients with clinical diagnosis of Williams syndrome. Hum Genet. 1995;96:444–448. doi: 10.1007/BF00191804. [DOI] [PubMed] [Google Scholar]
- 9.Frangiskakis JM, et al. LIM-kinase1 hemizygosity implicated in impaired visuospatial constructive cognition. Cell. 1996;86:59–69. doi: 10.1016/s0092-8674(00)80077-x. [DOI] [PubMed] [Google Scholar]
- 10.Botta A, et al. Detection of an atypical 7q11.23 deletion in Williams syndrome patients which does not include the STX1A and FZD3 genes. J Med Genet. 1999;36:478–480. [PMC free article] [PubMed] [Google Scholar]
- 11.Tassabehji M, et al. Williams syndrome: use of chromosomal microdeletions as a tool to dissect cognitive and physical phenotypes. Am J Hum Genet. 1999;64:118–125. doi: 10.1086/302214. [DOI] [PMC free article] [PubMed] [Google Scholar]
- 12.von Dadelszen P, et al. De novo 46,XX,t(6;7)(q27;q11;23) associated with severe cardiovascular manifestations characteristic of supravalvular aortic stenosis and Williams syndrome. Am J Med Genet. 2000;90:270–275. doi: 10.1002/(sici)1096-8628(20000214)90:4<270::aid-ajmg2>3.0.co;2-r. [DOI] [PubMed] [Google Scholar]
- 13.Perez-Jurado LA, et al. A duplicated gene in the breakpoint regions of the 7q11.23 Williams-Beuren syndrome deletion encodes the initiator binding protein TFII-I and BAP-135, a phosphorylation target of BTK. Hum Mol Genet. 1998;7:325–334. doi: 10.1093/hmg/7.3.325. [DOI] [PubMed] [Google Scholar]
- 14.Osborne LR, et al. PMS2-related genes flank the rearrangement breakpoints associated with Williams syndrome and other disease on human chromosome 7. Genomics. 1997;45:402–406. doi: 10.1006/geno.1997.4923. [DOI] [PubMed] [Google Scholar]
- 15.Pezzi N, et al. STAG3, a novel gene encoding a protein involved in meiotic chromosome pairing and location of STAG3-related genes flanking the Williams-Beuren syndrome deletion. FASEB J. 2000;14:581–592. doi: 10.1096/fasebj.14.3.581. [DOI] [PubMed] [Google Scholar]
- 16.Görlach A, et al. A p47–phox pseudogene carries the most common mutation causing p47–phox-deficient chronic granulomatous disease. J Clin Invest. 1997;100:1907–1918. doi: 10.1172/JCI119721. [DOI] [PMC free article] [PubMed] [Google Scholar]
- 17.Meng X, Lu X, Morris CA, Keating MT. A novel human gene FKBP6 is deleted in Williams syndrome. Genomics. 1998;52:130–137. doi: 10.1006/geno.1998.5412. [DOI] [PubMed] [Google Scholar]
- 18.Chute I, Le Y, Ashley T, Dobson MJ. The telomere-associated DNA from human chromosome 20p contains a pseudotelomere structure and shares sequences with the subtelomeric regions of 4q and 18p. Genomics. 1997;46:51–60. doi: 10.1006/geno.1997.5007. [DOI] [PubMed] [Google Scholar]
- 19.Lakich D, Kazazian HH, Jr, Antonarakis SE, Gitschier J. Inversions disrupting the factor VIII gene are a common cause of severe haemophilia A. Nature Genet. 1993;5:236–241. doi: 10.1038/ng1193-236. [DOI] [PubMed] [Google Scholar]
- 20.Small K, Iber J, Warren ST. Emerin deletion reveals a common X-chromosome inversion mediated by inverted repeats. Nature Genet. 1997;16:96–99. doi: 10.1038/ng0597-96. [DOI] [PubMed] [Google Scholar]
- 21.Jobling MA, et al. A selective difference between human Y-chromosomal DNA haplotypes. Curr Biol. 1998;8:1391–1394. doi: 10.1016/s0960-9822(98)00020-7. [DOI] [PubMed] [Google Scholar]
- 22.Ji Y, Eichler EE, Schwartz S, Nicholls RD. Structure of chromosomal duplicons and their role in mediating human genomic disorders. Genome Res. 2000;10:597–610. doi: 10.1101/gr.10.5.597. [DOI] [PubMed] [Google Scholar]
- 23.Peoples R, et al. A physical map, including a BAC/PAC clone contig, of the Williams-Beuren syndrome–deletion region at 7q11.23. Am J Hum Genet. 2000;66:47–68. doi: 10.1086/302722. [DOI] [PMC free article] [PubMed] [Google Scholar]
- 24.Valero MC, de Luis O, Cruces J, Perez Jurado LA. Fine-scale comparative mapping of the human 7q11.23 region and the orthologous region on mouse chromosome 5G: the low-copy repeats that flank the Williams-Beuren syndrome deletion arose at breakpoint sites of an evolutionary inversion(s) Genomics. 2000;69:1–13. doi: 10.1006/geno.2000.6312. [DOI] [PubMed] [Google Scholar]
- 25.Giglio S, et al. Olfactory receptor-gene clusters, genomic-inversion polymorphisms, and common chromosome rearrangements. Am J Hum Genet. 2001;68:874–883. doi: 10.1086/319506. [DOI] [PMC free article] [PubMed] [Google Scholar]
- 26.Kara-Mostefa A, et al. Recurrent Williams-Beuren syndrome in a sibship suggestive of maternal germline mosaicism. Am J Hum Genet. 1999;64:1475–1478. doi: 10.1086/302362. [DOI] [PMC free article] [PubMed] [Google Scholar]
- 27.Schwartz S, et al. PipMaker—a web server for aligning two genomic DNA sequences. Genome Res. 2000;10:577–586. doi: 10.1101/gr.10.4.577. [DOI] [PMC free article] [PubMed] [Google Scholar]
- 28.Heng HH, Tsui LC. Modes of DAPI banding and simultaneous in situ hybridization. Chromosoma. 1993;102:325–332. doi: 10.1007/BF00661275. [DOI] [PubMed] [Google Scholar]
- 29.Heng HH, Squire J, Tsui LC. High-resolution mapping of mammalian genes by in situ hybridization to free chromatin. Proc Natl Acad Sci USA. 1992;89:9509–9513. doi: 10.1073/pnas.89.20.9509. [DOI] [PMC free article] [PubMed] [Google Scholar]
- 30.Crackower MA, et al. Characterization of the split hand/split foot malformation locus SHFM1 at 7q21.3-q22.1 and analysis of a candidate gene for its expression during limb development. Hum Mol Genet. 1996;5:571–579. doi: 10.1093/hmg/5.5.571. [DOI] [PubMed] [Google Scholar]