Plasticity and stability of visual field maps in adult primary visual cortex (original) (raw)
. Author manuscript; available in PMC: 2010 Jul 2.
Published in final edited form as: Nat Rev Neurosci. 2009 Nov 11;10(12):873–884. doi: 10.1038/nrn2741
Preface
It is important to understand the balance between cortical plasticity and stability in various systems and spatial scales in the adult brain. We review measurements of adult plasticity in primary visual cortex (V1), a structure that has a key role in distributing visual information. There are claims of plasticity at multiple spatial scales in adult V1, but many inconsistencies in the data raise questions about the extent and nature of such plasticity. Understanding is further limited by a lack of quantitative models to guide the interpretation of the data. These problems limit efforts to translate research findings about adult cortical plasticity into significant clinical, educational and policy applications.
Introduction
Early life-experience significantly influences brain development; the neural and behavioral effects of developmental plasticity have been observed in systems serving perception, movement, language, and emotion1-4. Distinct neural systems have different requirements for plasticity versus stability across the lifespan. Several systems require cortical plasticity. Sensory system signals typically remain plastic in response to changes in environmental inputs throughout the lifespan (adaptation5-8). Neural processes mediating learning and forgetting also require neuronal plasticity in adulthood. Another need for adult plasticity arises at the interface between sensory and motor systems, as muscles fatigue or sensory transducers change with age (i.e. vestibulo-ocular reflex arc9-14).
Cortical network stability is also needed. For example, path-finding for long-range projections between brain areas is challenging and once paths are established re-routing could cause havoc. Excessive plasticity may disrupt the function of computational circuitry for stereoscopic depth, motion perception, or object identification, and may change the correspondence between visual and cortical space; such changes would require downstream circuits - such as those that control visually-guided reaching – to continuously update their interpretation of sensory signals. Consequently, several molecular mechanisms exist for stabilization of neural pathways after development15-17.
There can be no serious debate as to whether the brain is plastic or not: it is both. A better question is to investigate distinct systems and understand the conditions under which each system is plastic or stable. It is also important to learn whether the degree or even the nature of brain plasticity is influenced by specific types of injury, or specific attempts at rehabilitation.
This review summarizes the conflicting literature on plasticity in one important system, adult primary visual cortex (area V1). Area V1 is the dominant cortical relay station distributing visual sensory input to the rest of the neocortex; its function requires a balance between stability and plasticity. Many reports argue that adult V1 is highly plastic, but inconsistencies across these reports suggest that the data have not been interpreted correctly and that, in fact, adult V1 has only limited plasticity. We stress the need to resolve these important inconsistencies.
V1 inputs from the two eyes
Ocular input is plastic during development
In experiments of lasting importance, Hubel and Wiesel demonstrated that depriving one eye of retinal contrast (eyelid suture) during development reduces the number of neurons responsive to contrast presented to that eye18-20. The reduced V1 representation of the deprived eye can be detected in various ways. For example, using a stain for the metabolic enzyme cytochrome oxidase (CO) one can visualize a distinctive pattern of light and dark bands on the cortical surface. These two types of bands receive their dominant input from different eyes. The eye preference within each band extends to a degree through the cortical depth and thus these regions are called ocular dominance columns. Visual deprivation in one eye reduces the proportion of cortex dominated by input from that eye. Amblyopia, a reduced visual acuity in one eye that is not explained by lens or retinal structural abnormalities, may be caused by this experience-dependent process.
Developmental plasticity also influences V1 binocular inputs at spatial scales finer than the ocular dominance columns 21, 22. Adams and Horton 21 explain that the photoreceptors that lie directly beneath (i.e. ‘in the shadow of’) one eye's blood vessels “are condemned to a life of idleness owing to their location.” As a consequence, projections from these shadow-photoreceptors yield their V1 territory to their industrious counterparts from the other eye.
Wiesel and Hubel 23 recognized that experience-dependent plasticity can be harmful: “One may reasonably ask whether mechanisms in which neural connexions become impaired through abnormal experience can possibly serve any use, or possess any survival value.” They go on to point out that in some cases developmental plasticity can be helpful. A recent example comes from the neurological literature. In adults, loss of the occipital lobe has devastating and permanent consequences, typically leading to complete blindness in half of the visual field. Yet, some children in which an occipital lobe fails to develop24 or who have a hemisphere removed25, 26 still develop visual sensitivity and awareness in the entire visual field. In this example, developmental plasticity is useful.
Adult ocular input is stable
In adulthood the system shifts to favor stability. Adams et al. 27 measured the width of the ocular dominance columns in six V1 samples of adult humans (Figure 1). In five of six cases an adult eye was enucleated, and the time between enucleation and death ranged from five days to 22 years. Following death, V1 was processed by flattening and CO-staining. Even after many years of monocular vision, the staining pattern showed the normal pattern of ocular dominance columns; the loss of an eye in adulthood did not reduce the width of the columns from the enucleated eye. The sixth case demonstrated that the CO-staining technique is sensitive enough to measure a developmental change in ocular dominance column width27; this case showed a difference between the left (larger) and the right (smaller) ocular dominance column widths of a 94-year-old man whose right eye was injured in childhood.
Figure 1. The ocular dominance columns and visual field map in primary visual cortex (V1).
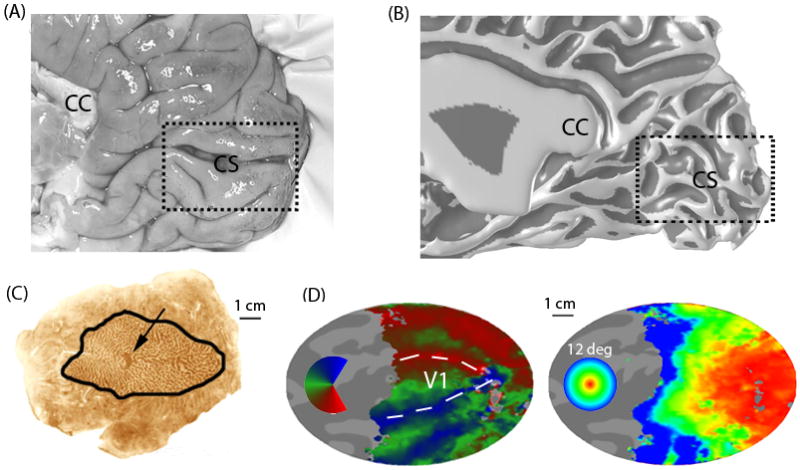
(A) A medial view of the posterior right hemisphere of a post-mortem human brain. Human V1 is located principally in the calcarine sulcus, though its full extent frequently goes to occipital pole onto the ventral-lateral surface. CS - calcarine sulcus; CC corpus callosum. (B) The white/gray matter surface measured using MRI in a living subject. The surface rendering is inflated to increase the visibility of the sulci; it is shaded to emphasize the sulcal (dark) and gyral (light) regions. (C) A flattened post-mortem brain showing right calcarine and surrounding cortex from a subject with an enucleated left eye. The outlined region is V1. The cytochome oxidase staining forms light and dark bands that reveal the ocular dominance columns. The dark spot (arrow) is the projection zone from the left eye's blind spot (optic disk). (D) Calcarine and surrounding cortex computationally flattened from the MR-derived surface mesh. The color overlays identify the stimulus angle (left) or eccentricity (right) that most effectively stimulates each cortical location (measured using fMRI). Angle and eccentricity (up to 12 deg from the fovea) are measured with respect to fixation. The angle and eccentricity maps together define the V1 visual field map86. The boundary between V1 and V2 can be identified in the angle map from the locations that respond best to the vertical meridians (arrows). Scale bars: 1 cm. [[I think it might be better to put 3 arrowhears instead of one outlining the borders between V1/V2 in this figure (i.e the head of the arrows would trace the border). As it is for the unfamiliar reader it may be difficult to figure out what the arrow points to]]
Interventions reactivate ocular input plasticity
There is interest in finding pharmacological and behavioral manipulations of the nervous system that enhance adult plasticity. One approach is to find molecules that promote stability and then to eliminate these molecules. The degradation of chondroitin sulfate proteoglycans, a component of the extracellular matrix that inhibits axonal sprouting, reactivates ocular dominance column plasticity28; and knock-out mice lacking functional paired immunoglobulin like receptor B (PirB) display enhanced ocular dominance plasticity17, 29, 30 at all ages.
Another approach is to modulate the neurotransmitter environment. The timing of the critical period for ocular dominance in mice, which begins 3 week after birth and achieves maximal sensitivity one month after birth, can be significantly delayed by modifying genes that are essential for neurotransmitter development and release31. Reduced inhibition (in GAD65 knockout mice) early in life prevents experience-dependent ocular dominance plasticity. This can be rescued by treatment with benzodiazepines32.
Adult plasticity can also be influenced by experience. For example, the critical period can be delayed by dark-rearing33-36, or even re-activated by housing adult animals in a completely dark stimulus environment37, 38. Engaging plasticity mechanisms during development appears to enhance adult plasticity; hence, juvenile behavioral training might be effective in expanding the capacity for adult plasticity39-41. Discovering pharmacological agents and behavioral protocols that increase adult plasticity offers hope of finding more effective treatments for amblyopia.
V1 receptive fields
An important approach for understanding experience-dependent plasticity in adulthood is to measure V1 spiking activity after localized retinal lesions. Because the population properties of V1 neurons are well documented, changes in V1 population responses can be detected. For example, many V1 neurons are orientation selective, some are motion-direction selective; some receptive fields span several millimeters (in cortical coordinates) and some fractions of a millimeter. The variety of V1 neuron properties and receptive field sizes is partly due to the diversity of the V1 inputs (Figure 2); these arise from distinct cell classes in the lateral geniculate nucleus (LGN), distinct patterns of connections within V1 42, 43, extrastriate cortex44, 45 and thalamic nuclei such as the pulvinar46-48. Hence, deafferentation of the retinogeniculate input is expected to change – though not necessarily eliminate entirely - the responses of the sampled V1 population.
Figure 2. V1 neurons receive a diverse source of inputs.
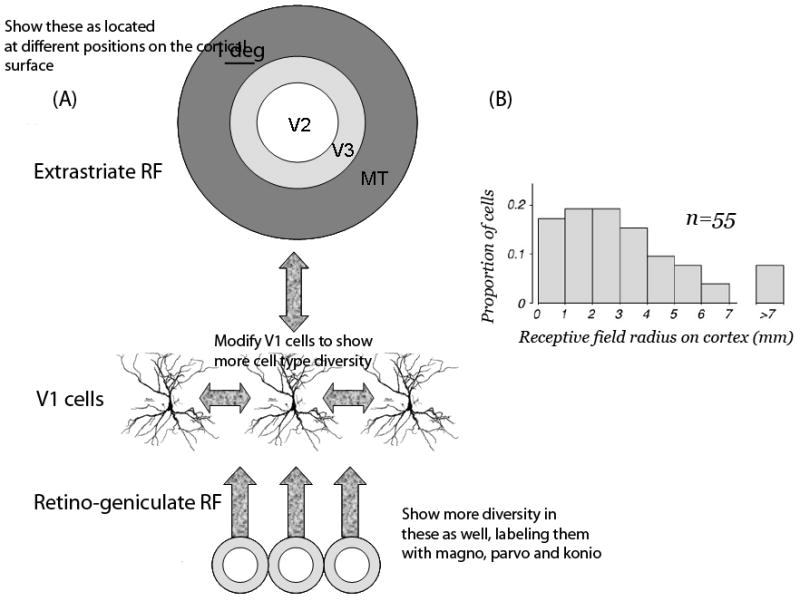
A V1 neuron may receive input from the lateral geniculate nucleus (LGN), extrastriate cortex (V2, V3, MT and other extrastriate sources), lateral connections between V1 neurons, and the pulvinar a large nucleus in the thalamus. In healthy V1, the reported receptive field (RF) size can differ by a factor of 4 depending on the nature of the mapping stimulus.44 (A) Inputs to V1 neurons have a wide range of receptive field sizes. The receptive field (RF) size of center-surround LGN inputs (bottom) is small compared to the RF size of extrastriate sources (top). Extrastriate sources have receptive field sizes that vary and can be larger than 5 deg in diameter 125. V1 neurons can also receive input from other V1 neurons with RF centers separated by a degree or more. The variations in estimated RF size probably result from different contributions from the pathways that deliver the input signals to the V1 neuron. (B) From the V1 visual field map, it is possible to express estimates of the RF center radius on the cortical surface. The radius of V1 RFs is often larger than 3mm; more than 10% of the neurons have a radius exceeding 5mm (From REF124, Fig 13A). The surround influence generally extends beyond 7mm.
The literature describing the effect of retinal lesions on LGN and V1 population receptive field spiking patterns contains many conflicting reports. One possible reason for these differences is that V1 receptive field properties are typically compared between populations of neurons observed at different times – until recently there was no opportunity to monitor the same cell pre- and post-lesion. Another reason is the limited ability to measure cells of a particular type, and it is possible that the degree of adult plasticity depends on the particular class of V1 cells. New methods in volume imaging and chronic implantable electrode arrays should make more sophisticated measurements possible within the next few years49-54.
Adult binocular retinal lesions
Kaas et al. 55 used a laser pulse to create a 500um diameter photoreceptor lesion in adult cats. This 500um retinal lesion projected to a V1 zone of roughly 4 mm. This lesion projection zone (LPZ) receives only a monocular input. Measuring the single unit responses at various times after the lesion they observed “no notable change in retinotopic organization.”
They further deprived V1 of input by removing the second eye. After 2-6 months, they found neurons at the border of the monocular V1 LPZ that responded to visual stimuli. The photoreceptors that were the principal inputs to these neurons had been destroyed. Instead, the neurons received input from intact photoreceptors that were displaced from the normal position (ectopic). The authors concluded that “… the present results, together with those from the somatosensory system, imply that basic neuronal properties such as receptive field location are maintained in a dynamic state in sensory-perceptual systems of adult mammals. Such adult plasticity may be important, not only in recoveries from brain damage and adjustments to other impairments, but also in our abilities to maintain, alter, and improve sensorimotor and perceptual skills.” No behavioral experiments were performed to show improved performance to stimuli detected through the spared photoreceptors.
A similar experiment was subsequently performed in monkeys56. Binocular lesions covering the central 2° of the visual field resulted in an unresponsive V1 LPZ immediately following the lesions. But 75 days later about half of the neurons sampled within the LPZ did respond to a stimulus. These responses were weak and the receptive fields were unusually large, with “diffuse borders that were difficult to map precisely.” In addition, the response latencies in these neurons had doubled. Moreover, CO-staining “revealed depressed activity in the foveal region, especially in layers IVa and IVc compared to surrounding cortex with intact retinal input.” 56 Subsequent CO measurements confirmed that “CO levels in cortical scotomas remained severely depressed for months after retinal lesions, even when the other eye was enucleated.”57 Thus, at least at the spatial scale of the CO measurements, there was no substantial adult plasticity.
Gilbert and colleagues 58, 59 made binocular, localized photoreceptor lesions in cats and monkeys. In monkeys these lesions were about 1 mm diameter on the retina, centered 1 mm below the fovea; such a lesion creates a 3-5° scotoma in the visual field, creating an 8mm diameter cortical LPZ. They sampled V1 receptive field properties at fixed cortical sites before and following the lesion. Immediately after the lesion they report a 5-fold expansion in mean receptive field size; this remained a “several fold” expansion two months later. “At the end of this period [two months] all cortical sites could be activated by visual stimuli.” The responses within the LPZ differed from normal cortex, being more ‘bursty’ (Darian-Smith, personal communication). The authors do not specify what fraction of the neurons was responsive. A later study60 reported increased sprouting of long-range laterally projecting axons near the border of the V1 LPZ, suggesting that this sprouting may be the anatomical basis for putative signal spreading from nearby (non-deafferented) V1 regions to the interior of the LPZ.
Giannikopoulos et al.61, Fig. 2B report a reduced likelihood of encountering a spiking unit in cat V1 following binocular, central lesions. Twelve weeks post-lesion they report the probability of encountering a spiking cell more than 3 mm inside the LPZ as less than 10% per penetration. This probability remains unchanged for at least three months, contrasting with reports of significant reorganization by this time55, 58. A year later, this probability increased to 40%61, Fig. 2B, but this increase cannot be interpreted unambiguously because the authors also reported that the probability of identifying a unit in normal cortex also increased significantly (65% to 90%) during that time.
A dispute: responses following monocular lesions
Several investigators found no reorganization of V1 receptive fields following monocular lesions55, 62-64. Others reported a 2.5-5 mm spread of activity in the LPZ 65-67. Indeed, Schmid et al. reported up to 5mm reorganization after such lesions and no further effect following subsequent removal of the other eye 67. An initial hypothesis to explain this striking experimental difference was that the retinal ganglion cell layer had been destroyed in some55, 62-64 but not other studies67. To test this idea, Calford et al 66 performed a complete retinal lesion and confirmed the results of Schmid et al67. The difference between the results from these two studies and the other experimental reports remains unexplained.
Murakami et al. 64 made electrophysiological measurements in alert behaving macaques following monocular deafferentation. They reported no significant V1 reorganization, yet the macaques showed evidence of perceptual filling-in; that is, perceptual completion of missing information such as occurs across the retinal blind spot. This suggests that the observed behavioral filling-in is not likely to be mediated by V1 neurons, in agreement with REF68.
Following lesions that deafferent the monocular crescent of cat V1, which represents the far periphery of the visual field, “most neurons in the deprived peripheral representation remained unresponsive to visual stimuli even more than 1 year after treatment.”69 This contrasts with reports from the same authors showing significant changes in response following relatively central deafferentation65, 67, 70.
A dispute: receptive field sizes and orientation
Chino et al. 63 used long-duration (0.5s) laser pulses, 1 mm diameter, to lesion both the photoreceptors and cells in the inner retinal layers of one eye. They made a corresponding, but larger, lesion in the second eye to completely deafferent the LPZ. Sampling the neural populations 90 days following the second lesion the “overall responsiveness under optimal stimulus conditions was clearly reduced”, and yet they found “strikingly normal orientation tuning, direction selectivity, and spatial frequency tuning when high-contrast (< 40%) stimuli were used.” Giannikopoulos et al. 61 contradicted this report. Working in cats with a 10 deg lesion centered on the area centralis, they report that “orientation tuning was found to be significantly decreased at distances >1 mm inside the LPZ, and it deteriorated with increasing distance from the border irrespective of recovery time.” Chino et al. further reported an average receptive field size of 2.8° for neurons in the LPZ compared to 2.19° for neurons in the adjacent cortex 63, Table 1; this receptive field expansion is much smaller than that described by Gilbert and Wiesel 58.
A dispute: time course of plasticity
Heinen and Skavenski reported no neural activity inside the LPZ until three weeks post retinal lesion56. Gilbert and Wiesel 58 and Darian-Smith and Gilbert 71 reported measuring responsive units within minutes of a binocular lesion but larger changes were seen ∼2 months post lesion. Schmid et al. 67, 70 and Calford et al. 65 reported large-scale reorganization minutes to hours following monocular retinal lesions, while Chino et al. 62 found that receptive fields of neurons in the LPZ are stable following monocular lesions and then reorganize within hours following enucleation of the other eye.
Pettet and Gilbert 72 describe V1 as so dynamic and mutable that large-scale reorganization can be induced by simply depriving the retina of stimulus contrast. Specifically, they report that occluding a portion of the retina while stimulating the surround (called an artificial scotoma), induced a 5-fold expansion of receptive fields centered in the artificial scotoma. DeAngelis et al.73 report that exposure to an artificial scotoma causes no change in either the size or internal structure of V1 receptive fields but only a short term increase in responsiveness in some cells (see also DeWeerd et al. 68). Using intracellular methods, Nowak et al. 74 report “no significant difference between adaptation to a scotoma and adaptation to a gray screen.”
Post-lesion BOLD responses in the V1 LPZ of adult macaque are small or absent
Using fMRI, Smirnakis et al.75 monitored response in the V1-LPZ in adult macaques for several months following bilateral retinal lesions. They did not observe any change in the profile of functional fMRI signal activity across the LPZ border. These results agree with Yinon et al. 76who reported little reorganization following deafferentation of adult cat V1 by interrupting geniculo-cortical afferents. The fMRI measurements also agree with prior results from studies measuring CO activity, another metabolic marker57.
Smirnakis et al.75 also made multi-unit electrophysiological recordings at the end of the fMRI experiments using a linear electrode array spanning the border between the V1-LPZ and adjacent, healthy cortex. In healthy cortex, all the electrodes measured powerful stimulus-driven multi-unit activity. But in the V1-LPZ classical receptive fields could not be found; the responses were either absent, weak, or atypical (transient and driven from the extraclassical receptive field) as previously reported56. Further, the weak V1-LPZ responses had a longer latency (93 ms) than the responses just outside the LPZ (68 ms). The relative difference in timing is qualitatively consistent with those reported in REF56 and the difference in absolute latency between the two studies might be due to differences in the stimulus contrast. Smirnakis et al. concluded that “neuronal responses in the LPZ do not recover to anything approaching their normal state.”
Different views of reorganization in the LGN
Eysel and colleagues measured responses in the cat LGN following peripheral (∼18-22°) retinal damage77-81. Neurons receiving input from cells at the border of the lesion had receptive field positions that were shifted “up to five degrees” from the expected location. Only a small number (33) of such cells were found in a study involving 244 electrode penetrations 78.
Eysel et al.80 suggest that “the cells with displaced receptive fields after long-term deafferentation received fibres of the fast-conducting (Y) type according to stimulus response latency criteria, after electrical stimulation near the optic chiasm.” In the primate these might correspond to the axons of the retinal parasol (Y) cells whose dendritic arbors normally cover a larger portion of the visual field than those of co-located parvocellular neurons82. Hence, these responses in the LGN LPZ could be functional changes that enhance the effectiveness of existing synapses, or could simply reflect the residual inputs from the Y cells. But in other reports Eysel et al. 79 discount changes in the LGN as the source of cortical recovery because comparable lesions performed in the cat area centralis resulted in “no deviation from the normal retino-geniculate topography and no receptive field displacements.” This is not a very sensitive measurement, however, because the expected size of the visual receptive field displacement in the LGN representation of the cat area centralis (∼0.3 degrees) is very close to the detection limit in the LGN recordings. In cortex the effects of foveal lesion are easier to detect because of the expanded foveal representation.
Subsequently authors generally dismissed the possibility that differences between the pre- and post-lesion V1-LPZ responses have a thalamic origin58, 71. For example, Gilbert and Wiesel58 emphasized that “at a time when the initial cortical scotoma had disappeared … there was still a large unresponsive area in the LGN (about 1 mm in diameter, corresponding topographically to the size of the retinal scotoma).” However, a small surface area in the LGN projects to a large area in V1, so this observation does not eliminate the possibility that a significant fraction of the post-lesion V1 responses may originate in the LGN.
Finally, it is possible that functional recovery at the border of the retinal lesion might contribute to the changes as retinal inflammation abates57 or the retina itself reorganizes83.
V1 visual field maps
In much of visual cortex neurons are arranged so that receptive field centers form an orderly map of the visual field: neighbouring neurons have overlapping receptive fields whose centers represent neighbouring locations in the image (Figure 1)84-86. These visual field maps, also called retinotopic or topographic maps, are created by a precise developmental process. Functional magnetic resonance imaging (fMRI) has made it possible to quantify visual-field maps in macaque87, 88 and humans86, and several studies have investigated the stability of these maps.
Developmental plasticity of visual field maps
Developmental plasticity of the V1 visual field map was reported in human rod monochromats; these are subjects born with a genetic defect that causes a malfunction in cone photo-transduction89. The normal eye has a pure cone (rod-free) region in the central 0.6° of the macula, called the fovea; a predominantly cone region extends to at least 1° radius90, 91. In rod monochromats, however, no cone signals are present in this region; consequently, the 1 cm2 V1 projection zone of signals from the fovea should receive no input27, 92. Indeed, in normal subjects rod-initiated signals produce no BOLD fMRI response in this large area93. In some rod monochromats, however, the entire zone is responsive89; in others, a small silent zone remained. Thus, developmental plasticity creates rod-driven receptive fields in a cortical location that in normal controls is a cone-only projection zone89, Fig 1C, 94, 95, 96.
There is no evidence that the defective cone photo-transduction in rod monochromats97-99, 100, 101 directly influences cortical structure or ganglion cell morphology101, 102. In one report it was assumed that the unusual cortical responses in the rod monochromats must be explained by the development of novel functional connections – such as new projections – from rod initiated signals89. However, other mechanisms might also explain the results. For example, rod signals could normally be present in this zone but suppressed by cone signals; failure of cone development could eliminate this suppression, unmasking the rod signal.
V1 map stability despite large eye misalignments
In healthy V1, binocular neurons receive left and right eye inputs that represent corresponding visual field locations; following surgical rotation of an eye, V1 inputs from the two eyes no longer represent corresponding visual field positions (Figure 3). After Hubel and Wiesel's work on developmental plasticity of binocularity, other investigators asked whether surgically rotating one eye in a kitten could invoke experience-dependent mechanisms that alter the retinotopic maps and compensate for the eye rotation103, 104. Both groups reported no experience-dependent plasticity in response to eye rotation; the V1 maps from the two eyes remained misaligned.
Figure 3. No reorganization of the V1 visual field map after eye rotation.
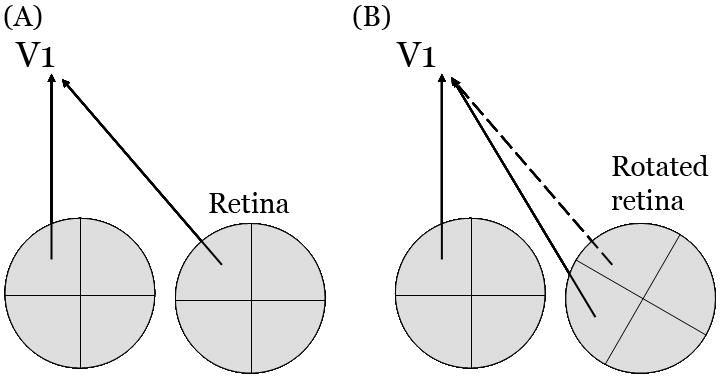
(A) Normally locations in the two eyes that receive corresponding images send their signals to corresponding locations in cortex. (B) Following surgical rotation of one eye, V1 inputs from the two eyes no longer represent corresponding visual field locations (solid lines). In principle, developmental plasticity could compensate for this misalignment by reconnecting retina and cortex (dashed line). Developmental plasticity does not correct the inappropriate mapping caused by eye rotation; the original, and now incorrect, mapping is preserved (solid lines).
The maps also fail to re-align following experimental deviation of one eye (strabismus). Strabismic cats have relatively few binocular neurons and behaviorally they are stereo-blind105 Still, some binocular V1 neurons develop in these cats, and neither developmental nor adult plasticity brings the visual field representation from the deviated eye into register with the normal eye106 However, for modest amounts of misalignment (< 10°) the maps from the two eyes may be brought back into register further downstream, in an extrastriate visual map106, 107
In summary, V1 maps develop an abnormal organization in certain developmental cases (rod monochromats). The observed deviations represent an extension of a centimeter or so around silenced cortex. But more extensive reorganization has not been found; there is no significant developmental reorganization after eye rotation or strabismus.
V1 responses in adults with macular degeneration
In subjects with binocular macular degeneration, a region of V1 is deprived of normal retinogeniculate input. The first fMRI data from a human subject with age-related macular degeneration (AMD) were obtained from a 60-year-old woman108. In this patient, bilateral lesions surrounded the spared central fovea, depriving a region of V1 of its normal input and complete blindness (absolute scotoma) in this part of the visual field. This subject had a large unresponsive zone in V1 in the LPZ. In this adult subject, unlike in the congenital rod monochromats, the LPZ remained unresponsive.
Baker and colleagues 109, 110 measured subjects with extensive binocular macular lesions. The subjects were presented a set of targets (faces, objects) in the spared periphery and asked to identify when a target was presented twice in a row. These authors found a substantial fMRI response in the LPZ (1.2%). In most of the subjects there is a silent V1 zone, 1-3 cm in width, separating the peripheral response from responses near the occipital pole (Supplemental Figure 1). The cortical responses in these subjects differ from the single-unit measurements, which suggest an expansion of cortical activation adjacent to LPZ, not in regions separated by several centimeters. In one or possibly two of the MD subjects, however, there is a continuous spread from the border of the peripheral retinal responses to the occipital pole. This activation might share a common mechanism with single unit data, though its extent is measured in centimeters, whereas the maximal spread of activity quoted by single unit studies is <=5mm.
V1 Task-dependent modulations in MD subjects
To understand the difference between the results in REFs108-110, Masuda et al. 111 scanned adult subjects with macular degeneration, using both a passive viewing condition (as in REF108) and a stimulus-related judgment task (as in REF109). During the passive viewing task, there was a silent LPZ whose location corresponded to the size and position of the scotoma (confirming REF108). During the stimulus-related judgment task the cortical response spread into the LPZ more than in controls (similar to REF109). In control subjects the peripheral V1 response did not differ between the two tasks. The authors hypothesized that the spread of the V1 response in some JMD subjects is caused by cortical signals initiated by the task-demands, and not by a large transformation of the feedforward pathways carrying the retinal stimulation111.
Masuda et al. observed a small modulation near the occipital pole in both MD subjects and controls during the judgment task (Figure 4, subject C1; filled squares in Figure 5a). The nature of occipital pole activations during stimulus-related judgment tasks of peripheral targets is an interesting topic that is being investigated112. If occipital pole activation is present in controls, the argument for plasticity in MD subjects is weakened. The location of occipital pole activation with respect to the V1 map is not firmly established. This will be particularly difficult in MD subjects because these subjects cannot have foveal cortex mapped. It may be possible to localize these occipital activations with respect to V1 from anatomical measurements of the Stria of Gennari113-116.
Figure 4. V1 responses in humans with central retinal lesions.
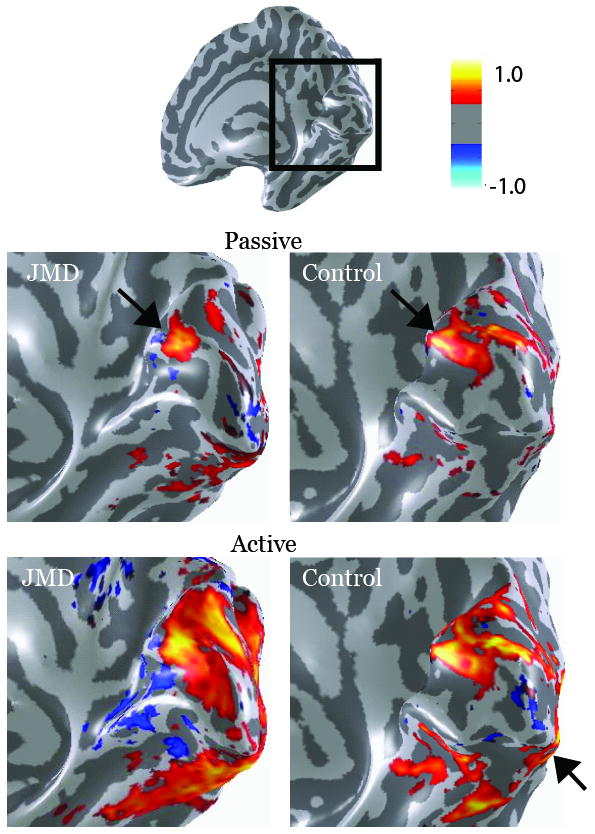
The four main images show an expanded posterior view of the calcarine sulcus (box on the upper inset). The color overlays compare fMRI responses in a juvenile macular degeneration (JMD) subject with a large central scotoma and spared vision in the lower peripheral field (left) and a Control with a similar “artificial” scotoma (right). In the Passive condition subjects passively viewed a visual stimulus presented in the peripheral visual field near the lower vertical meridian. In both subjects this produced a modest response in anterior calcarine at the location corresponding to the position of the stimulus in the peripheral visual field near the lower vertical meridian (upper images; arrows). In the Active condition subjects were asked to remember the visual stimulus from trial-to-trial (lower images). In this condition responses in the JMD subject spread significantly towards the occipital pole, and responses increased in other regions, such as the ventral surface. But in the Control there was no significant expansion of the BOLD signal into posterior calcarine. In both the JMD and the Control the Active task increased responses broadly, including near the occipital pole (arrow). The location of this activation with respect to V1 has not yet been defined with any certainty. The color bar indicates the amplitude of the BOLD response (percent modulation), either in synchrony (red) or out of synchrony (blue) with the stimulus. Only modulations exceeding 0.3% coherence are shown.
Figure 5. The expected effect of retinal lesions on V1 responses.
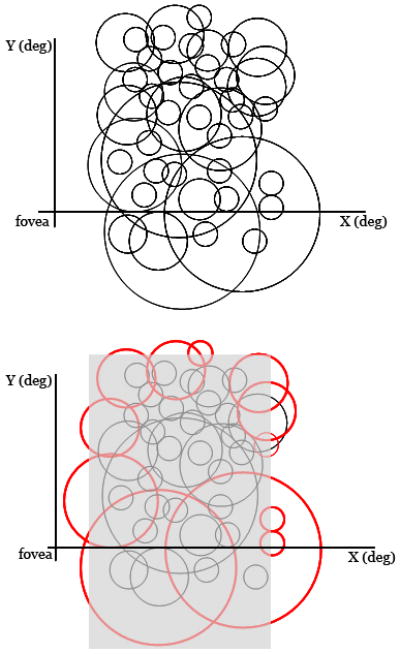
(A) This schematic illustrates the diverse receptive fields of neurons expected to be found within a region of V1. The black circles show the size of neurons' RFs plotted on a representation of the visual field. The RF sizes vary and (partly) overlap. (B) The same RFs are shown with a transparent gray rectangle that indicates the portion of the visual field blinded by a simulated retinal lesion. The retinal lesion is located in the center of the RFs that are sampled from this part of cortex. The effect of the retinal lesion is to reduce the number of responsive neurons within the LPZ. Assuming no cortical plasticity, we still expect some cells to continue to respond to signals placed on adjacent regions of spared retina (red circles). Such neurons will necessarily have RFs that are displaced (ectopic) from their pre-lesion position. A reduction in the number of post-lesion responsive cells and ectopic RFs of these cells have been observed61. Such data should be construed as supporting adult cortical plasticity only if the reduction in number of responsive cells and the change in the properties of the ectopic RFs differ significantly from a model that assumes no plasticity. A complete model should include quantitative specification of the RF size distribution, experimental factors (retinal penumbra due to inflammation or swelling), and models of retinal plasticity83.
A dispute: V1 LPZ responses and the PRL
Subjects deprived of foveal vision often develop an alternative preferred retinal locus (PRL) within intact peripheral retina. Schumacher et al.117 measured fMRI responses in six subjects with macular degeneration and a PRL. They too found that stimuli presented in the PRL cause a response in the LPZ near the occipital pole, several centimeters from the intact regions. In contrast, stimuli presented to the healthy periphery outside the PRL did not produce an LPZ response. Dilks et al.118 examined the same experimental question and concluded the opposite: They found the same occipital pole response to peripheral stimuli inside or away from the PRL.
The results in REF117 suggest a specific colonization of signals from the cortical representation of the PRL and cortex in the occipital pole, while the results in REF118 suggest that any relationship between peripheral signals and the occipital pole is general, lacking cortical specificity.
Human fMRI summary
The opportunity to measure brain activity in humans provides a great deal of valuable information. An advantage is the opportunity to acquire efficiently information about perception (Supplemental Material). The human neuroimaging methods also provide structural and functional information over the entire brain that enables comparisons of major structural features, such as gray matter thickness119. But, there are also important limitations. For example, the inability to obtain retinal histology means we cannot exclude the possibility that retinal pathology is incomplete or fuzzy, or has changing borders83. Also, the neuroimaging data do not establish specific plasticity mechanisms; in fact, the data permit a number of explanations that one would be hard pressed to call plasticity. For example, it is widely agreed that task-related demands influence the BOLD responses in human V1120-122. The task-dependent V1 responses in the JMD subjects may arise from this existing circuitry, via extrastriate cortex or sub-cortical structures111. The removal of the retinogeniculate signal may expose these responses in V1 even though there may be no significant change in the existing circuitry. More research is needed to establish whether JMD and control response differences are explained by the development of new circuitry or increased response amplitude on existing pathways.
Conclusions
The extent and nature of adult V1 plasticity remains uncertain. The assertion that “Plasticity in adult V1 has been demonstrated by multiple independent lines of evidence from more than twenty studies in three species”123 masks the many inconsistencies in the experimental literature. The unanswered questions include: What proportion of neurons remains responsive? Are receptive field sizes enlarged post-lesion or not, and if so by how much? Is orientation tuning normal or altered? Does reorganization occur only after binocular lesions or after monocular lesions? What is the time course of reorganization and what does it depend on? What are the specific neural circuits that reorganize, and which stay fixed?
Modeling the effects of lesions
What we know about plasticity is limited by current experimental paradigms. A particular problem is the approach of reporting deviations from a poorly specified model of V1 receptive field structure as plasticity. This is like flattening a car tire and then claiming that changes in the steering properties, which may become more severe over time, are evidence of steering plasticity.
A specific problem is that the most widely used receptive field model is based on the assumption that V1 neurons all have small, classical receptive fields. Yet, we know that the receptive field sizes at each cortical location span a significant range, are dynamic, and depend on the mapping stimulus. The V1 receptive field center radius represented on the cortical surface includes many cells with small sizes (2mm), but 20% of the neurons have a radius greater than or equal to 5 mm 124, Figure 13. Also, there are large differences between extrastriate input and thalamic input; for example, the spatial extent of axonal fields and their corresponding influence on the properties of V1 receptive fields differ considerably between thalamic and extrastriate V1 inputs 44, 45, 124-126. Quantitative models that incorporate these properties, and that enable us to predict the responses following retinal lesions, are necessary before we can interpret the population responses following retinal lesions.
Integrating data from multiple methods
It should become possible to use quantitative V1 models to interpret data from a range of experimental methods. Some researchers suggest that data obtained with methods that do not directly measure neuronal spiking should be discounted: “Any analysis of plastic reorganization at a neuronal locus needs a veridical measure of changes in the functional output — that is, spiking responses of the neurons in question. In a study of the effect of retinal lesions on adult primary visual cortex (V1), Smirnakis et al. propose that there is limited, if any, cortical reorganization. Their results are based, however, on BOLD (blood-oxygen-level-dependent) fMRI (functional magnetic resonance imaging), which provides an unreliable gauge of spiking activity 123.” However, we think it is unwise to dismiss the BOLD signal or other non-spiking measures, such as CO activity. Each measurement method provides a new opportunity to understand the full range of cortical responses, and should be taken into account in the context of its own limitations.
Interpreting displaced receptive fields
There is one measurement method in the literature that deserves special comment. Electrophysiology studies generally claim that receptive fields displaced from their usual position — described as ‘piled-up’ at the border of the V1-LPZ — are evidence of reorganization 55, 58, 61-63, 65, 66, 70, 71. This claim is widespread, but we think it is wrong.
If one could identify with some certainty that a V1 neuron is driven entirely by lesioned photoreceptors, then a post-lesion response in that same neuron would be evidence for plasticity. Electrophysiological measurements, however, do not follow individual neurons from pre- to post-lesion. Rather, single-unit recordings compare samples from a neural population pre- and post-lesion. It is quite likely that some neurons in the V1-LPZ will respond pre-lesion to input from photoreceptors at the margin of the damaged retina83 (Figure 5). V1 responses might also arise from neurons with large receptive fields, lateral connections intrinsic to V1, or feedback from extrastriate sources. Consequently, even if no post-lesion reorganization occurs, we expect to find receptive fields whose centers pile-up just beyond the margin of the lesion.
Any plausible model of V1 neurons would predict that removing retinal input alters the population responses, but does not abolish them. To establish reorganization requires a demonstration that the number and properties of ectopic receptive fields differs from model predictions when retinal inputs are simply silenced. In the absence of a model, empiricists demonstrate plasticity by showing that the sampled neuronal population changes over time. This approach is subject to significant sampling bias: different populations of neurons are sampled at different times following experimental manipulations. For example, in one study the probability of isolating a neuron inside the V1 LPZ is 1/6th the probability of isolating a neuron in control cortex (fig. 2B of REF 61). Most V1 neurons are thought to survive after V1-deafferentiation, so this reduction in sampling probability is likely because the majority of deafferented neurons are quiet and therefore harder to isolate post-deafferentiation. Because there is no way of knowing a-priori which subset of neurons (∼10-20% of units) will be detected post-lesion, we are probably comparing different neuronal populations. Differences between the pre- and post-lesion samples might be misinterpreted as plasticity. Following V1 population responses after the lesion does not entirely solve the problem, as the recording bias likely depends on the functional state of the retinal penumbra.
A more decisive approach for the future will be to apply chronic recording methods. New methods are being developed that isolate and follow the responses of individual neuronal units over time 50-52. This approach bypasses the need for a general model and may reduce the powerful recording bias demonstrated in the LPZ61, Fig. 2B. Until methods and models for this analysis are created, the presence of responsive neurons with ectopic receptive fields should not be treated as a decisive measure of plasticity.
Future directions
We write this view in the hope that reviewing the significant contradictions about V1 adult plasticity will speed efforts to resolve them. We described a need for better theoretical models of healthy cortical signals at the cellular and system scale to interpret experimental measurements following retinal lesions models. We add that such models will be needed at many scales. For example, it is likely that changes at the scale of dendritic and axonal arbors also exist, and models will be essential to understand the effect of synaptic scale changes at the receptive-field or network level. Further experiments assessing whether specific cellular and neuroimaging measures of adult cortical plasticity influence perception and behavior also will be needed before we can establish which neurobiological measurements are meaningful in clinical, educational, and policy applications.
Text Box: Restoring vision.
New experimental evidence for the existence of adult cortical plasticity is sometimes used to market behavioral training methods for people suffering from neurological disease or injury. The commercial applications claim that certain behavioral regimens will slow or even reverse neurological disorders such as dementia or blindness caused by stroke. The research papers reviewed in this article are sometimes cited to support these commercial claims.
It is worth noting, therefore, that in our experience the scientists involved in the experiments do not suggest that findings in adult V1 plasticity offer a plausible mechanism of restoring visual field loss caused by retinal or optic nerve damage. This can be deduced from first principles: information that is not present in the retina cannot be extracted by V1 processing. The best one might hope for is that plasticity will improve the processing of signals that originate in the spared retina. But there are no substantiated claims of adult behavioral improvement that can be traced to the development of ectopic V1 receptive fields.
This specific objection does not deny all reports that visual performance in a ‘blind’ region of the visual field may improve after visual training. But there are many potential sources for improvements in task performance apart from the work reviewed here, and it is important to recognize that the source of the improved visual performance might differ depending on the specific nature of the loss. For example, some authors suggest that visual performance improvements following retinal damage may be explained by learning new eye movement habits127. When geniculo-cortical pathways are damaged it might also be possible to help patients by teaching them to interpret the residual sub-cortical signals that arrive through the colliculus and pulvinar128, 129. Correctly identifying the neural source of behavioral improvements has practical consequences; if we understand the basis for the improvement, rehabilitation strategies can focus on developing the mechanisms that are appropriate for that patient.
Supplementary Material
Supplemental Figures 1-3
Acknowledgments
Supported by RO1 EY03164 and EY015000 (BW) and HHMI, Dana Foundation, R01 EY019272, and DoD PT074693P19, and R21 NS059607 (SM). We thank Joyce Farrell, Ralph Freeman, Hiroshi Horiguchi, Jonathan Horton, Netta Levin, Nikos Logothetis, Michael Schmid, Anthony Morland, Andreas Tolias, Xinmiao Peng and Jonathan Winawer for comments and help with figures.
Glossary
Critical period
A period after birth when neural connections have a large capacity for plasticity compared to adulthood.
V1 ocular dominance columns
Most V1 neurons respond preferentially to inputs from one eye or the other. Cells with common preference are organized into columns that alternate with columns of neurons with the opposite preference.
Receptive field
The region in the visual field where presentation of a stimulus influences a neuron's response.
GAD65 knockout mice
A knock-out mouse of the gene coding for GAD65 (one of the main two glutamic acid decarboxylase isoforms); the mouse model is used to study the effects of inhibition on visual system plasticity during the critical period for ocular dominance.
Visual field map
The receptive field centers of nearby neurons in visual cortex generally represent nearby positions in the visual field, forming an orderly map of at least a portion of the visual field.
Fovea
The primate retina contains a small central region depression (pit) that has very high photoreceptor density and is used for high acuity vision.
Area centralis
Many species lacking a retinal fovea (pit) have a central retinal region with relatively higher photoreceptor density that serves the animal's high acuity vision.
Macula
The central portion of the primate retina that is covered by a yellow pigment (macular pigment). It includes the fovea.
Macular degeneration
A loss of vision due to disease in the central (macular) portion of the retina.
Amblyopia
A developmental disorder of the visual nervous system. The amblyopic eye has decreased visual acuity that is not explained by structural abnormalities of the lens or retina.
Scotoma
A blind spot in the visual field.
Binocular neurons
Neurons which respond to stimulation of either eye.
Stereo-blindness
The inability to combine information from the two eyes to perceive depth. Stereo-blindness is a typical result of strabismus (eye misalignment) that was not corrected in early childhood.
Preferred retinal locus (PRL)
When the fovea is damaged people often place the region of interest on an intact retinal location in the spared periphery, the PRL.
Monocular crescent
A crescent shaped region within primate primary visual cortex that receives input from only one (the contralateral) eye.
Parasol cells
A class of retinal ganglion cells identified by their large dendritic arbors. These cells comprise 10% of the retinal ganglion cells and project to the magnocellular layers of the lateral geniculate nucleus.
Midget cells
A class of retinal ganglion cells with small dendritic arbors. These cells comprise approximately 80% of the retinal ganglion cells and project to the parvocellular layers of the lateral geniculate nucleus.
Y cells
Ganglion cells in cat exhibiting non-linear spatial summation in the cat retina. They may be homologous to the primate parasol cells.
Adaptation and plasticity
Neuronal activity patterns frequently adjust to changes of input statistics inputs as well as to shifting demands on their outputs. For example, the neural response to a flash of light differs depending on recent exposure to light or the ambient lighting context. Similarly, eye movements and temperature sensitivity depend on events in the recent past. These adjustments occur throughout the lifespan, and neuroscientists have carried out many studies of this phenomenon, called sensory or motor adaptation.
Cortical plasticity or reorganization also refers to a change in neural properties as the input statistics change (e.g., a retinal lesion) or the output demands change (e.g., muscle fatigue). While the distinction between the terms adaptation and plasticity is not sharp, there are several phenotypic characteristics that are commonly used to differentiate when investigators use adaptation and when plasticity (see Table).
| Measurement | Plasticity | Adaptation |
|---|---|---|
| Temporal scale of cause | Longer than inciting factor | Short (∼tracking input statistics) |
| Temporal scale of effect | Long | Short (∼tracking input statistics) |
| Anatomical connectivity | Likely to change | Unlikely to change |
| Receptive field: space | May change | May change |
| Receptive field: gain | May change | May change |
| Reversibility | Not typical, or takes long | Yes |
Adaptation is a relatively short term adjustment that is often made in response to fluctuations in the dynamic range of inputs or outputs. A prototypical example is the change in the cone photocurrent after exposure to a bright light (light adaptation). This change reverses in minutes after some time in the dark (dark adaptation). In this case, there is no particular thought that the neural circuits are transformed by the light or dark exposures.
Plastic reorganization typically describes a long-term change in the neuronal circuit. In the case of deafferentation, for example, the growth of new axons and dendrites to form new circuits to process or store information is considered plasticity.
In cases where neural tissue is injured, both processes typically operate at overlapping time scales in a way that is difficult to separate. For example, suppose half of the input signals to a neuron are suddenly silenced. This will alter the statistical structure of the neuron's input, change its input resistance. Properties such as synaptic gain are likely to change in the short-term. In the long-term, this may become very difficult or impossible to reverse, and the adaptation may be followed by dendritic sprouting, new synapses and potentially new neuronal circuit properties.
References
- 1.Gregory RL. Concepts and mechanisms of perception. 1974 [Google Scholar]
- 2.Krageloh-Mann I. Imaging of early brain injury and cortical plasticity. Exp Neurol. 2004;190 Suppl 1:S84–90. doi: 10.1016/j.expneurol.2004.05.037. [DOI] [PubMed] [Google Scholar]
- 3.Pollak SD. Early adversity and mechanisms of plasticity: integrating affective neuroscience with developmental approaches to psychopathology. Dev Psychopathol. 2005;17:735–52. doi: 10.1017/S0954579405050352. [DOI] [PubMed] [Google Scholar]
- 4.Cicchetti D, Manly JT. Operationalizing child maltreatment: developmental processes and outcomes. Dev Psychopathol. 2001;13:755–7. [PubMed] [Google Scholar]
- 5.Baylor DA. Photoreceptor signals and vision. Proctor lecture. Invest Ophthalmol Vis Sci. 1987;28:34–49. [PubMed] [Google Scholar]
- 6.Dunn FA, Lankheet MJ, Rieke F. Light adaptation in cone vision involves switching between receptor and post-receptor sites. Nature. 2007;449:603–6. doi: 10.1038/nature06150. [DOI] [PubMed] [Google Scholar]
- 7.Rushton WAH. Visual Adaptation. Proceedings of the Royal Society of London B. 1965;16:20–46. doi: 10.1098/rspb.1965.0024. [DOI] [PubMed] [Google Scholar]
- 8.Wade AR, Wandell BA. Chromatic light adaptation measured using functional magnetic resonance imaging. J Neurosci. 2002;22:8148–57. doi: 10.1523/JNEUROSCI.22-18-08148.2002. [DOI] [PMC free article] [PubMed] [Google Scholar]
- 9.Lisberger SG, Miles FA, Optican LM. Frequency-selective adaptation: evidence for channels in the vestibulo-ocular reflex? J Neurosci. 1983;3:1234–44. doi: 10.1523/JNEUROSCI.03-06-01234.1983. [DOI] [PMC free article] [PubMed] [Google Scholar]
- 10.Optican LM, Miles FA. Visually induced adaptive changes in primate saccadic oculomotor control signals. J Neurophysiol. 1985;54:940–58. doi: 10.1152/jn.1985.54.4.940. [DOI] [PubMed] [Google Scholar]
- 11.Gonshor A, Jones GM. Extreme vestibulo-ocular adaptation induced by prolonged optical reversal of vision. J Physiol. 1976;256:381–414. doi: 10.1113/jphysiol.1976.sp011330. [DOI] [PMC free article] [PubMed] [Google Scholar]
- 12.Gonshor A, Jones GM. Short-term adaptive changes in the human vestibulo-ocular reflex arc. J Physiol. 1976;256:361–379. doi: 10.1113/jphysiol.1976.sp011329. [DOI] [PMC free article] [PubMed] [Google Scholar]
- 13.Jones GM. Plasticity in the adult vestibulo-ocular reflex arc. Philos Trans R Soc Lond B Biol Sci. 1977;278:319–34. doi: 10.1098/rstb.1977.0045. [DOI] [PubMed] [Google Scholar]
- 14.Dodge R. Habituation to rotation. J exp Psychol. 1923;6:1–35. [Google Scholar]
- 15.Grados-Munro EM, Fournier AE. Myelin-associated inhibitors of axon regeneration. J Neurosci Res. 2003;74:479–85. doi: 10.1002/jnr.10803. [DOI] [PubMed] [Google Scholar]
- 16.Kastin AJ, Pan W. Targeting neurite growth inhibitors to induce CNS regeneration. Curr Pharm Des. 2005;11:1247–53. doi: 10.2174/1381612053507440. [DOI] [PubMed] [Google Scholar]
- 17.Syken J, Grandpre T, Kanold PO, Shatz CJ. PirB restricts ocular-dominance plasticity in visual cortex. Science. 2006;313:1795–800. doi: 10.1126/science.1128232. [DOI] [PubMed] [Google Scholar]
- 18.Hubel DH, Wiesel TN. Receptive fields of cells in striate cortex of very young, visually inexperienced kittens. Journal of Neurophysiology. 1963;26:994–1002. doi: 10.1152/jn.1963.26.6.994. [DOI] [PubMed] [Google Scholar]
- 19.Hubel DH, Wiesel TN. Ferrier lecture. Functional architecture of macaque monkey visual cortex. Proc R Soc Lond B Biol Sci. 1977;198:1–59. doi: 10.1098/rspb.1977.0085. [DOI] [PubMed] [Google Scholar]
- 20.Wiesel TN, Hubel DH. Single-cell responses in striate cortex of kittens deprived of vision in one eye. Journal of Neurophysiology. 1963;26:1003–1017. doi: 10.1152/jn.1963.26.6.1003. [DOI] [PubMed] [Google Scholar]
- 21.Adams DL, Horton JC. Shadows cast by retinal blood vessels mapped in primary visual cortex. Science. 2002;298:572–6. doi: 10.1126/science.1074887. [DOI] [PMC free article] [PubMed] [Google Scholar]
- 22.Adams DL, Horton JC. The representation of retinal blood vessels in primate striate cortex. J Neurosci. 2003;23:5984–97. doi: 10.1523/JNEUROSCI.23-14-05984.2003. [DOI] [PMC free article] [PubMed] [Google Scholar]
- 23.Hubel DH, Wiesel TN. The period of susceptibility to the physiological effects of unilateral eye closure in kittens. J Physiol. 1970;206:419–36. doi: 10.1113/jphysiol.1970.sp009022. [DOI] [PMC free article] [PubMed] [Google Scholar]
- 24.Muckli L, Naumer MJ, Singer W. Bilateral visual field maps in a patient with only one hemisphere. Proc Natl Acad Sci U S A. doi: 10.1073/pnas.0809688106. in press. [DOI] [PMC free article] [PubMed] [Google Scholar]
- 25.Werth R. Visual functions without the occipital lobe or after cerebral hemispherectomy in infancy. Eur J Neurosci. 2006;24:2932–44. doi: 10.1111/j.1460-9568.2006.05171.x. [DOI] [PubMed] [Google Scholar]
- 26.Holloway V, et al. The reorganization of sensorimotor function in children after hemispherectomy. A functional MRI and somatosensory evoked potential study. Brain. 2000;123(Pt 12):2432–44. doi: 10.1093/brain/123.12.2432. [DOI] [PubMed] [Google Scholar]
- 27.Adams DL, Sincich LC, Horton JC. Complete pattern of ocular dominance columns in human primary visual cortex. J Neurosci. 2007;27:10391–403. doi: 10.1523/JNEUROSCI.2923-07.2007. [DOI] [PMC free article] [PubMed] [Google Scholar]
- 28.Pizzorusso T, et al. Reactivation of ocular dominance plasticity in the adult visual cortex. Science. 2002;298:1248–51. doi: 10.1126/science.1072699. [DOI] [PubMed] [Google Scholar]
- 29.Atwal JK, et al. PirB is a functional receptor for myelin inhibitors of axonal regeneration. Science. 2008;322:967–70. doi: 10.1126/science.1161151. [DOI] [PubMed] [Google Scholar]
- 30.McGee AW, Yang Y, Fischer QS, Daw NW, Strittmatter SM. Experience-driven plasticity of visual cortex limited by myelin and Nogo receptor. Science. 2005;309:2222–6. doi: 10.1126/science.1114362. [DOI] [PMC free article] [PubMed] [Google Scholar]
- 31.Hensch TK. Critical period plasticity in local cortical circuits. Nat Rev Neurosci. 2005;6:877–88. doi: 10.1038/nrn1787. [DOI] [PubMed] [Google Scholar]
- 32.Hensch TK, et al. Local GABA circuit control of experience-dependent plasticity in developing visual cortex. Science. 1998;282:1504–8. doi: 10.1126/science.282.5393.1504. [DOI] [PMC free article] [PubMed] [Google Scholar]
- 33.Cynader M, Mitchell DE. Prolonged sensitivity to monocular deprivation in dark-reared cats. J Neurophysiol. 1980;43:1026–40. doi: 10.1152/jn.1980.43.4.1026. [DOI] [PubMed] [Google Scholar]
- 34.Cynader M, Timney BN, Mitchell DE. Period of susceptibility of kitten visual cortex to the effects of monocular deprivation extends beyond six months of age. Brain Res. 1980;191:545–50. doi: 10.1016/0006-8993(80)91303-7. [DOI] [PubMed] [Google Scholar]
- 35.Mower GD, Caplan CJ, Christen WG, Duffy FH. Dark rearing prolongs physiological but not anatomical plasticity of the cat visual cortex. J Comp Neurol. 1985;235:448–66. doi: 10.1002/cne.902350404. [DOI] [PubMed] [Google Scholar]
- 36.Timney B, Mitchell DE, Cynader M. Behavioral evidence for prolonged sensitivity to effects of monocular deprivation in dark-reared cats. J Neurophysiol. 1980;43:1041–54. doi: 10.1152/jn.1980.43.4.1041. [DOI] [PubMed] [Google Scholar]
- 37.He HY, Hodos W, Quinlan EM. Visual deprivation reactivates rapid ocular dominance plasticity in adult visual cortex. J Neurosci. 2006;26:2951–5. doi: 10.1523/JNEUROSCI.5554-05.2006. [DOI] [PMC free article] [PubMed] [Google Scholar]
- 38.He HY, Ray B, Dennis K, Quinlan EM. Experience-dependent recovery of vision following chronic deprivation amblyopia. Nat Neurosci. 2007;10:1134–6. doi: 10.1038/nn1965. [DOI] [PubMed] [Google Scholar]
- 39.Linkenhoker BA, Knudsen EI. Incremental training increases the plasticity of the auditory space map in adult barn owls. Nature. 2002;419:293–6. doi: 10.1038/nature01002. [DOI] [PubMed] [Google Scholar]
- 40.Linkenhoker BA, von der Ohe CG, Knudsen EI. Anatomical traces of juvenile learning in the auditory system of adult barn owls. Nat Neurosci. 2005;8:93–8. doi: 10.1038/nn1367. [DOI] [PubMed] [Google Scholar]
- 41.Hofer SB, Mrsic-Flogel TD, Bonhoeffer T, Hubener M. Prior experience enhances plasticity in adult visual cortex. Nat Neurosci. 2006;9:127–32. doi: 10.1038/nn1610. [DOI] [PubMed] [Google Scholar]
- 42.Gilbert CD, Wiesel TN. Morphology and intracortical projections of functionally characterised neurones in the cat visual cortex. Nature. 1979;280:120–5. doi: 10.1038/280120a0. [DOI] [PubMed] [Google Scholar]
- 43.Lund JS. Anatomical organization of macaque monkey striate visual cortex. Annu Rev Neurosci. 1988;11:253–88. doi: 10.1146/annurev.ne.11.030188.001345. [DOI] [PubMed] [Google Scholar]
- 44.Angelucci A, Levitt JB, Lund JS. Anatomical origins of the classical receptive field and modulatory surround field of single neurons in macaque visual cortical area V1. Prog Brain Res. 2002;136:373–88. doi: 10.1016/s0079-6123(02)36031-x. [DOI] [PubMed] [Google Scholar]
- 45.Angelucci A, et al. Circuits for local and global signal integration in primary visual cortex. J Neurosci. 2002;22:8633–46. doi: 10.1523/JNEUROSCI.22-19-08633.2002. [DOI] [PMC free article] [PubMed] [Google Scholar]
- 46.Sherman SM, Guillery RW. Exploring the Thalamus. Academic Press; New York: 2000. [Google Scholar]
- 47.Kaas JH, Lyon DC. Pulvinar contributions to the dorsal and ventral streams of visual processing in primates. Brain Res Rev. 2007;55:285–96. doi: 10.1016/j.brainresrev.2007.02.008. [DOI] [PMC free article] [PubMed] [Google Scholar]
- 48.Rezak M, Benevento LA. A comparison of the organization of the projections of the dorsal lateral geniculate nucleus, the inferior pulvinar and adjacent lateral pulvinar to primary visual cortex (area 17) in the macaque monkey. Brain Res. 1979;167:19–40. doi: 10.1016/0006-8993(79)90260-9. [DOI] [PubMed] [Google Scholar]
- 49.Nicolelis MA, et al. Chronic, multisite, multielectrode recordings in macaque monkeys. Proc Natl Acad Sci U S A. 2003;100:11041–6. doi: 10.1073/pnas.1934665100. [DOI] [PMC free article] [PubMed] [Google Scholar]
- 50.Ohki K, Chung S, Ch'ng YH, Kara P, Reid RC. Functional imaging with cellular resolution reveals precise micro-architecture in visual cortex. Nature. 2005;433:597–603. doi: 10.1038/nature03274. [DOI] [PubMed] [Google Scholar]
- 51.Tolias AS, et al. Recording chronically from the same neurons in awake, behaving primates. J Neurophysiol. 2007;98:3780–90. doi: 10.1152/jn.00260.2007. [DOI] [PubMed] [Google Scholar]
- 52.Stosiek C, Garaschuk O, Holthoff K, Konnerth A. In vivo two-photon calcium imaging of neuronal networks. Proc Natl Acad Sci U S A. 2003;100:7319–24. doi: 10.1073/pnas.1232232100. [DOI] [PMC free article] [PubMed] [Google Scholar]
- 53.Hatsopoulos N, Mukand J, Polykoff G, Friehs G, Donoghue J. Cortically controlled brain-machine interface. Conf Proc IEEE Eng Med Biol Soc. 2005;7:7660–7663. doi: 10.1109/IEMBS.2005.1616286. [DOI] [PubMed] [Google Scholar]
- 54.Chestek CA, et al. HermesC: low-power wireless neural recording system for freely moving primates. IEEE Trans Neural Syst Rehabil Eng. 2009;17:330–8. doi: 10.1109/TNSRE.2009.2023293. [DOI] [PubMed] [Google Scholar]
- 55.Kaas JH, et al. Reorganization of retinotopic cortical maps in adult mammals after lesions of the retina. Science. 1990;248:229–31. doi: 10.1126/science.2326637. [DOI] [PubMed] [Google Scholar]
- 56.Heinen SJ, Skavenski AA. Recovery of visual responses in foveal V1 neurons following bilateral foveal lesions in adult monkey. Exp Brain Res. 1991;83:670–4. doi: 10.1007/BF00229845. [DOI] [PubMed] [Google Scholar]
- 57.Horton JC, Hocking DR. Monocular core zones and binocular border strips in primate striate cortex revealed by the contrasting effects of enucleation, eyelid suture, and retinal laser lesions on cytochrome oxidase activity. J Neurosci. 1998;18:5433–55. doi: 10.1523/JNEUROSCI.18-14-05433.1998. [DOI] [PMC free article] [PubMed] [Google Scholar]
- 58.Gilbert CD, Wiesel TN. Receptive field dynamics in adult primary visual cortex. Nature. 1992;356:150–2. doi: 10.1038/356150a0. [DOI] [PubMed] [Google Scholar]
- 59.Gilbert CD, Li W, Piech V. Perceptual learning and adult cortical plasticity. J Physiol. 2009;587:2743–51. doi: 10.1113/jphysiol.2009.171488. [DOI] [PMC free article] [PubMed] [Google Scholar]
- 60.Darian-Smith C, Gilbert CD. Axonal sprouting accompanies functional reorganization in adult cat striate cortex. Nature. 1994;368:737–740. doi: 10.1038/368737a0. [DOI] [PubMed] [Google Scholar]
- 61.Giannikopoulos DV, Eysel UT. Dynamics and specificity of cortical map reorganization after retinal lesions. Proc Natl Acad Sci U S A. 2006;103:10805–10. doi: 10.1073/pnas.0604539103. [DOI] [PMC free article] [PubMed] [Google Scholar]
- 62.Chino YM, Kaas JH, Smith EL, 3rd, Langston AL, Cheng H. Rapid reorganization of cortical maps in adult cats following restricted deafferentation in retina. Vision Res. 1992;32:789–96. doi: 10.1016/0042-6989(92)90021-a. [DOI] [PubMed] [Google Scholar]
- 63.Chino YM, Smith EL, 3rd, Kaas JH, Sasaki Y, Cheng H. Receptive-field properties of deafferentated visual cortical neurons after topographic map reorganization in adult cats. J Neurosci. 1995;15:2417–33. doi: 10.1523/JNEUROSCI.15-03-02417.1995. [DOI] [PMC free article] [PubMed] [Google Scholar]
- 64.Murakami I, Komatsu H, Kinoshita M. Perceptual filling-in at the scotoma following a monocular retinal lesion in the monkey. Vis Neurosci. 1997;14:89–101. doi: 10.1017/s0952523800008798. [DOI] [PubMed] [Google Scholar]
- 65.Calford MB, Schmid LM, Rosa MG. Monocular focal retinal lesions induce short-term topographic plasticity in adult cat visual cortex. Proc Biol Sci. 1999;266:499–507. doi: 10.1098/rspb.1999.0665. [DOI] [PMC free article] [PubMed] [Google Scholar]
- 66.Calford MB, et al. Plasticity in adult cat visual cortex (area 17) following circumscribed monocular lesions of all retinal layers. J Physiol 524 Pt. 2000;2:587–602. doi: 10.1111/j.1469-7793.2000.t01-1-00587.x. [DOI] [PMC free article] [PubMed] [Google Scholar]
- 67.Schmid LM, Rosa MG, Calford MB, Ambler JS. Visuotopic reorganization in the primary visual cortex of adult cats following monocular and binocular retinal lesions. Cereb Cortex. 1996;6:388–405. doi: 10.1093/cercor/6.3.388. [DOI] [PubMed] [Google Scholar]
- 68.De Weerd P, Gattass R, Desimone R, Ungerleider LG. Responses of cells in monkey visual cortex during perceptual filling-in of an artificial scotoma. Nature. 1995;377:731–4. doi: 10.1038/377731a0. [DOI] [PubMed] [Google Scholar]
- 69.Rosa MG, Schmid LM, Calford MB. Responsiveness of cat area 17 after monocular inactivation: limitation of topographic plasticity in adult cortex. J Physiol. 1995;482(Pt 3):589–608. doi: 10.1113/jphysiol.1995.sp020543. [DOI] [PMC free article] [PubMed] [Google Scholar]
- 70.Schmid LM, Rosa MG, Calford MB. Retinal detachment induces massive immediate reorganization in visual cortex. Neuroreport. 1995;6:1349–53. doi: 10.1097/00001756-199506090-00030. [DOI] [PubMed] [Google Scholar]
- 71.Darian-Smith C, Gilbert CD. Topographic reorganization in the striate cortex of the adult cat and monkey is cortically mediated. Journal of Neuroscience. 1995;15:1631–1647. doi: 10.1523/JNEUROSCI.15-03-01631.1995. [DOI] [PMC free article] [PubMed] [Google Scholar]
- 72.Pettet MW, Gilbert CD. Dynamic changes in receptive-field size in cat primary visual cortex. Proc Natl Acad Sci U S A. 1992;89:8366–70. doi: 10.1073/pnas.89.17.8366. [DOI] [PMC free article] [PubMed] [Google Scholar]
- 73.DeAngelis GC, Anzai A, Ohzawa I, Freeman RD. Receptive field structure in the visual cortex: does selective stimulation induce plasticity? Proc Natl Acad Sci U S A. 1995;92:9682–6. doi: 10.1073/pnas.92.21.9682. [DOI] [PMC free article] [PubMed] [Google Scholar]
- 74.Nowak LG, Sanchez-Vives MV, McCormick DA. Role of synaptic and intrinsic membrane properties in short-term receptive field dynamics in cat area 17. J Neurosci. 2005;25:1866–80. doi: 10.1523/JNEUROSCI.3897-04.2005. [DOI] [PMC free article] [PubMed] [Google Scholar]
- 75.Smirnakis SM, et al. Lack of long-term cortical reorganization after macaque retinal lesions. Nature. 2005;435:300–7. doi: 10.1038/nature03495. [DOI] [PubMed] [Google Scholar]
- 76.Yinon U, Shemesh R, Arda H, Dobin G, Jaros PP. Physiological studies in deafferented visual cortex cells of cats following transplantation of fetal xenografts from the rat's cortex. Exp Neurol. 1993;122:335–41. doi: 10.1006/exnr.1993.1133. [DOI] [PubMed] [Google Scholar]
- 77.Eysel U, Mayer U. In: Developmental Neurobiology of Vision. Freeman RD, editor. Plenum Press; New York: 1979. [Google Scholar]
- 78.Eysel UT, Gonzalez-Aguilar F, Mayer U. A functional sign of reorganization in the visual system of adult cats: lateral geniculate neurons with displaced receptive fields after lesions of the nasal retina. Brain Res. 1980;181:285–300. doi: 10.1016/0006-8993(80)90613-7. [DOI] [PubMed] [Google Scholar]
- 79.Eysel UT, Gonzalez-Aguilar F, Mayer U. Time-dependent decrease in the extent of visual deafferentation in the lateral geniculate nucleus of adult cats with small retinal lesions. Exp Brain Res. 1981;41:256–63. doi: 10.1007/BF00238882. [DOI] [PubMed] [Google Scholar]
- 80.Eysel UT. Functional reconnections without new axonal growth in a partially denervated visual relay nucleus. Nature. 1982;299:442–4. doi: 10.1038/299442a0. [DOI] [PubMed] [Google Scholar]
- 81.Eysel UT, Neubacher U. Recovery of function is not associated with proliferation of retinogeniculate synapses after chronic deafferentation in the dorsal lateral geniculate nucleus of the adult cat. Neurosci Lett. 1984;49:181–6. doi: 10.1016/0304-3940(84)90157-5. [DOI] [PubMed] [Google Scholar]
- 82.Rodieck RW. The First Steps in Seeing. Sinauer Press; Sunderland, MA: 1998. [Google Scholar]
- 83.Paulus YM, et al. Healing of retinal photocoagulation lesions. Invest Ophthalmol Vis Sci. 2008;49:5540–5. doi: 10.1167/iovs.08-1928. [DOI] [PubMed] [Google Scholar]
- 84.Horton J, Hoyt W. The representation of the visual field in human striate cortex. Arhives of Opthalmology. 1991;109:816–824. doi: 10.1001/archopht.1991.01080060080030. [DOI] [PubMed] [Google Scholar]
- 85.Inouye T. Die Sehstroungen bei Schussverietzungen der kortikalen Sehsphare. W. Engelmann; Leipzig, Germany: 1909. [Google Scholar]
- 86.Wandell BA, Dumoulin SO, Brewer AA. Visual field maps in human cortex. Neuron. 2007;56:366–83. doi: 10.1016/j.neuron.2007.10.012. [DOI] [PubMed] [Google Scholar]
- 87.Brewer AA, Press WA, Logothetis NK, Wandell BA. Visual areas in macaque cortex measured using functional magnetic resonance imaging. J Neurosci. 2002;22:10416–26. doi: 10.1523/JNEUROSCI.22-23-10416.2002. [DOI] [PMC free article] [PubMed] [Google Scholar]
- 88.Fize D, et al. The retinotopic organization of primate dorsal V4 and surrounding areas: A functional magnetic resonance imaging study in awake monkeys. J Neurosci. 2003;23:7395–406. doi: 10.1523/JNEUROSCI.23-19-07395.2003. [DOI] [PMC free article] [PubMed] [Google Scholar]
- 89.Baseler HA, et al. Reorganization of human cortical maps caused by inherited photoreceptor abnormalities. Nat Neurosci. 2002;5:364–70. doi: 10.1038/nn817. [DOI] [PubMed] [Google Scholar]
- 90.Curcio CA, Sloan KR, Kalina RE, Hendrickson AE. Human photoreceptor topography. Journal of Comparative Neurology. 1990;292:497–523. doi: 10.1002/cne.902920402. [DOI] [PubMed] [Google Scholar]
- 91.Engel SA, Glover GH, Wandell BA. Retinotopic organization in human visual cortex and the spatial precision of functional MRI. Cereb Cortex. 1997;7:181–92. doi: 10.1093/cercor/7.2.181. [DOI] [PubMed] [Google Scholar]
- 92.Dougherty RF, et al. Visual field representations and locations of visual areas V1/2/3 in human visual cortex. J Vis. 2003;3:586–98. doi: 10.1167/3.10.1. [DOI] [PubMed] [Google Scholar]
- 93.Hadjikhani N, Tootell RB. Projection of rods and cones within human visual cortex. Hum Brain Mapp. 2000;9:55–63. doi: 10.1002/(SICI)1097-0193(2000)9:1<55::AID-HBM6>3.0.CO;2-U. [DOI] [PMC free article] [PubMed] [Google Scholar]
- 94.Dumoulin SO, Wandell BA. Population receptive field estimates in human visual cortex. Neuroimage. 2008;39:647–60. doi: 10.1016/j.neuroimage.2007.09.034. [DOI] [PMC free article] [PubMed] [Google Scholar]
- 95.Smith AT, Singh KD, Williams AL, Greenlee MW. Estimating receptive field size from fMRI data in human striate and extrastriate visual cortex. Cereb Cortex. 2001;11:1182–90. doi: 10.1093/cercor/11.12.1182. [DOI] [PubMed] [Google Scholar]
- 96.Tootell RB, et al. Functional analysis of V3A and related areas in human visual cortex. J Neurosci. 1997;17:7060–78. doi: 10.1523/JNEUROSCI.17-18-07060.1997. [DOI] [PMC free article] [PubMed] [Google Scholar]
- 97.Kohl S, et al. Mutations in the cone photoreceptor G-protein alpha-subunit gene GNAT2 in patients with achromatopsia. Am J Hum Genet. 2002;71:422–5. doi: 10.1086/341835. [DOI] [PMC free article] [PubMed] [Google Scholar]
- 98.Kohl S, et al. Mutations in the CNGB3 gene encoding the beta-subunit of the cone photoreceptor cGMP-gated channel are responsible for achromatopsia (ACHM3) linked to chromosome 8q21. Hum Mol Genet. 2000;9:2107–16. doi: 10.1093/hmg/9.14.2107. [DOI] [PubMed] [Google Scholar]
- 99.Khan NW, Wissinger B, Kohl S, Sieving PA. CNGB3 achromatopsia with progressive loss of residual cone function and impaired rod-mediated function. Invest Ophthalmol Vis Sci. 2007;48:3864–71. doi: 10.1167/iovs.06-1521. [DOI] [PubMed] [Google Scholar]
- 100.Sharpe LT, Stockman A, Jagle H, Nathans J. In: Color Vision: from genes to perception. Gegenfurtner K, Sharpe LT, editors. Cambridge University Press; Cambridge: 1999. pp. 3–52. [Google Scholar]
- 101.Sharpe LT, Nordby K. In: Night Vision: Basic, Clinical and Applied Aspects. Hess RF, Sharpe LT, Nordby K, editors. Cambridge University Press; Cambridge: 1990. pp. 253–289. [Google Scholar]
- 102.Glickstein M, Heath GG. Receptors in the monochromat eye. Vision Res. 1975;15:633–6. doi: 10.1016/0042-6989(75)90276-x. [DOI] [PubMed] [Google Scholar]
- 103.Blakemore C, Van Sluyters RC, Peck CK, Hein A. Development of cat visual cortex following rotation of one eye. Nature. 1975;257:584–6. doi: 10.1038/257584a0. [DOI] [PubMed] [Google Scholar]
- 104.Gordon B, Moran J, Presson J. Visual fields of cats reared with one eye intorted. Brain Res. 1979;174:167–71. doi: 10.1016/0006-8993(79)90812-6. [DOI] [PubMed] [Google Scholar]
- 105.Blake R, Hirsch HV. Deficits in binocular depth perception in cats after alternating monocular deprivation. Science. 1975;190:1114–6. doi: 10.1126/science.1188391. [DOI] [PubMed] [Google Scholar]
- 106.Grant S, Berman NE. Mechanism of anomalous retinal correspondence: maintenance of binocularity with alteration of receptive-field position in the lateral suprasylvian (LS) visual area of strabismic cats. Vis Neurosci. 1991;7:259–81. doi: 10.1017/s0952523800004077. [DOI] [PubMed] [Google Scholar]
- 107.Sireteanu R, Best J. Squint-induced Modification of Visual Receptive Fields in the Lateral Suprasylvian Cortex of the Cat: Binocular Interaction, Vertical Effect and Anomalous Correspondence. Eur J Neurosci. 1992;4:235–242. doi: 10.1111/j.1460-9568.1992.tb00871.x. [DOI] [PubMed] [Google Scholar]
- 108.Sunness JS, Liu T, Yantis S. Retinotopic mapping of the visual cortex using functional magnetic resonance imaging in a patient with central scotomas from atrophic macular degeneration. Ophthalmology. 2004;111:1595–8. doi: 10.1016/j.ophtha.2003.12.050. [DOI] [PubMed] [Google Scholar]
- 109.Baker CI, Peli E, Knouf N, Kanwisher NG. Reorganization of visual processing in macular degeneration. J Neurosci. 2005;25:614–8. doi: 10.1523/JNEUROSCI.3476-04.2005. [DOI] [PMC free article] [PubMed] [Google Scholar]
- 110.Baker CI, Dilks DD, Peli E, Kanwisher N. Reorganization of visual processing in macular degeneration: replication and clues about the role of foveal loss. Vision Res. 2008;48:1910–9. doi: 10.1016/j.visres.2008.05.020. [DOI] [PMC free article] [PubMed] [Google Scholar]
- 111.Masuda Y, Dumoulin SO, Nakadomari S, Wandell BA. V1 Projection Zone Signals in Human Macular Degeneration Depend on Task, not Stimulus. Cereb Cortex. 2008 doi: 10.1093/cercor/bhm256. [DOI] [PMC free article] [PubMed] [Google Scholar]
- 112.Williams MA, et al. Feedback of visual object information to foveal retinotopic cortex. Nat Neurosci. 2008;11:1439–45. doi: 10.1038/nn.2218. [DOI] [PMC free article] [PubMed] [Google Scholar]
- 113.Barbier EL, et al. Imaging cortical anatomy by high-resolution MR at 3.0T: detection of the stripe of Gennari in visual area 17. Magn Reson Med. 2002;48:735–8. doi: 10.1002/mrm.10255. [DOI] [PubMed] [Google Scholar]
- 114.Bridge H, et al. Independent anatomical and functional measures of the V1/V2 boundary in human visual cortex. J Vis. 2005;5:93–102. doi: 10.1167/5.2.1. [DOI] [PubMed] [Google Scholar]
- 115.Clark VP, Courchesne E, Grafe M. In vivo myeloarchitectonic analysis of human striate and extrastriate cortex using magnetic resonance imaging. Cereb Cortex. 1992;2:417–24. doi: 10.1093/cercor/2.5.417. [DOI] [PubMed] [Google Scholar]
- 116.Logothetis N, Merkle H, Augath M, Trinath T, Ugurbil K. Ultra high-resolution fMRI in monkeys with implanted RF coils. Neuron. 2002;35:227–42. doi: 10.1016/s0896-6273(02)00775-4. [DOI] [PubMed] [Google Scholar]
- 117.Schumacher EH, et al. Reorganization of visual processing is related to eccentric viewing in patients with macular degeneration. Restor Neurol Neurosci. 2008;26:391–402. [PubMed] [Google Scholar]
- 118.Dilks DD, Baker CI, Peli E, Kanwisher N. Reorganization of visual processing in macular degeneration is not specific to the “preferred retinal locus”. J Neurosci. 2009;29:2768–73. doi: 10.1523/JNEUROSCI.5258-08.2009. [DOI] [PMC free article] [PubMed] [Google Scholar]
- 119.Boucard CC, et al. Changes in cortical grey matter density associated with long-standing retinal visual field defects. Brain. 2009;132:1898–906. doi: 10.1093/brain/awp119. [DOI] [PMC free article] [PubMed] [Google Scholar]
- 120.O'Craven KM, Kanwisher N. Mental imagery of faces and places activates corresponding stiimulus-specific brain regions. J Cogn Neurosci. 2000;12:1013–23. doi: 10.1162/08989290051137549. [DOI] [PubMed] [Google Scholar]
- 121.Ress D, Backus BT, Heeger DJ. Activity in primary visual cortex predicts performance in a visual detection task. Nat Neurosci. 2000;3:940–5. doi: 10.1038/78856. [DOI] [PubMed] [Google Scholar]
- 122.Sirotin YB, Das A. Anticipatory haemodynamic signals in sensory cortex not predicted by local neuronal activity. Nature. 2009;457:475–9. doi: 10.1038/nature07664. [DOI] [PMC free article] [PubMed] [Google Scholar]
- 123.Calford MB, et al. Neuroscience: rewiring the adult brain. Nature. 2005;438(E3):E3–4. doi: 10.1038/nature04359. discussion. [DOI] [PubMed] [Google Scholar]
- 124.Cavanaugh JR, Bair W, Movshon JA. Nature and interaction of signals from the receptive field center and surround in macaque V1 neurons. J Neurophysiol. 2002;88:2530–46. doi: 10.1152/jn.00692.2001. [DOI] [PubMed] [Google Scholar]
- 125.Angelucci A, Bressloff PC. Contribution of feedforward, lateral and feedback connections to the classical receptive field center and extra-classical receptive field surround of primate V1 neurons. Prog Brain Res. 2006;154:93–120. doi: 10.1016/S0079-6123(06)54005-1. [DOI] [PubMed] [Google Scholar]
- 126.Levitt JB, Lund JS. The spatial extent over which neurons in macaque striate cortex pool visual signals. Vis Neurosci. 2002;19:439–52. doi: 10.1017/s0952523802194065. [DOI] [PubMed] [Google Scholar]
- 127.Pambakian AL, Kennard C. Can visual function be restored in patients with homonymous hemianopia? Br J Ophthalmol. 1997;81:324–8. doi: 10.1136/bjo.81.4.324. [DOI] [PMC free article] [PubMed] [Google Scholar]
- 128.Huxlin KR, et al. Perceptual relearning of complex visual motion after V1 damage in humans. J Neurosci. 2009;29:3981–91. doi: 10.1523/JNEUROSCI.4882-08.2009. [DOI] [PMC free article] [PubMed] [Google Scholar]
- 129.Huxlin KR. Perceptual plasticity in damaged adult visual systems. Vision Res. 2008;48:2154–2166. doi: 10.1016/j.visres.2008.05.022. [DOI] [PubMed] [Google Scholar]
Associated Data
This section collects any data citations, data availability statements, or supplementary materials included in this article.
Supplementary Materials
Supplemental Figures 1-3