Impaired de Novo Choline Synthesis Explains Why Phosphatidylethanolamine N-Methyltransferase-deficient Mice Are Protected from Diet-induced Obesity (original) (raw)
Abstract
Phosphatidylcholine (PC) is synthesized from choline via the CDP-choline pathway. Liver cells can also synthesize PC via the sequential methylation of phosphatidylethanolamine, catalyzed by phosphatidylethanolamine _N_-methyltransferase (PEMT). The current study investigates whether or not hepatic PC biosynthesis is linked to diet-induced obesity. Pemt+/+ mice fed a high fat diet for 10 weeks increased in body mass by 60% and displayed insulin resistance, whereas _Pemt_−/− mice did not. Compared with Pemt+/+ mice, _Pemt_−/− mice had increased energy expenditure and maintained normal peripheral insulin sensitivity; however, they developed hepatomegaly and steatosis. In contrast, mice with impaired biosynthesis of PC via the CDP-choline pathway in liver became obese when fed a high fat diet. We, therefore, hypothesized that insufficient choline, rather than decreased hepatic phosphatidylcholine, was responsible for the lack of weight gain in _Pemt_−/− mice despite the presence of 1.3 g of choline/kg high fat diet. Supplementation with an additional 2.7 g of choline (but not betaine)/kg of diet normalized energy metabolism, weight gain, and insulin resistance in high fat diet-fed _Pemt_−/− mice. Furthermore, Pemt+/+ mice that were fed a choline-deficient diet had increased oxygen consumption, had improved glucose tolerance, and gained less weight. Thus, de novo synthesis of choline via PEMT has a previously unappreciated role in regulating whole body energy metabolism.
Keywords: Adipose Tissue, Diabetes, Metabolism, Phosphatidylcholine, Phospholipid Metabolism, Choline, Methylation
Introduction
Obesity, a consequence of multifaceted interactions between genetic and environmental factors, is reaching epidemic proportions in developed countries. The increase in adiposity correlates with the growing number of people inflicted with Type 2 diabetes mellitus. The liver, along with muscle, brain, and adipose, has an important role in controlling energy metabolism and insulin signaling (1). For example, liver-X receptor-deficient mice have altered hepatic lipid metabolism and are resistant to obesity when fed a high fat/cholesterol diet (2). Targeted deletion of hepatic mitochondrial flavoprotein apoptosis inducing factor, fatty acid transport protein 5, or hepatic overexpression of peroxisome proliferator activator receptor-γ protects mice from both diet-induced obesity and insulin resistance (3–5). In contrast, knockdown of NFκB, or overexpression of malonyl-CoA decarboxylase, in the liver improves whole body insulin signaling without preventing obesity (6, 7). Clearly, the liver utilizes multiple mechanisms for influencing diet-induced obesity and insulin resistance.
Phosphatidylcholine (PC)3 is made in all nucleated mammalian cells (8). A primary function of PC in mammalian cells is maintenance of membrane integrity so that cells can regulate the flow of substances across the plasma membrane and intracellular membranes. In the liver, 70% of PC is made via the choline pathway (9) for which choline is thought to be derived mainly from the diet (10). The rate-limiting and regulated reaction in this pathway is catalyzed by CTP:phosphocholine cytidylyltransferase (CT) (11). CT is encoded by two genes in mice, Pcyt1a and Pcyt1b (12, 13). In liver, CTα (product of the Pcyt1a gene) is the predominant isoform (13).
The liver is a unique organ in that it also synthesizes PC by the sequential methylation of phosphatidylethanolamine, catalyzed by phosphatidylethanolamine _N_-methyltransferase (PEMT) (11). PEMT is responsible for the synthesis of 30% of hepatic PC, whereas the choline pathway generates the remaining 70% (9). _Pemt_−/− mice lack PEMT activity, yet the levels of PC and phosphatidylethanolamine remain essentially unchanged (14). Chow-fed _Pemt_−/− mice develop normally, have normal liver morphology, and have normal bile secretion and composition (14–16). However, PEMT is required for normal lipoprotein metabolism (17, 18). Plasma high density lipoproteins are reduced in _Pemt_−/− mice due to increased scavenger receptor B1-dependent uptake of lipids from these lipoproteins by the liver (19). In addition, secretion of very low density lipoproteins (triacylglycerols (TGs) and apolipoprotein B100) is also reduced in cultured hepatocytes isolated from _Pemt_−/− mice (17). When mice lacking PEMT were fed a high fat/high cholesterol diet, plasma very low density lipoprotein levels were substantially diminished (18). Furthermore, deletion of PEMT in low density lipoprotein receptor knock-out mice decreased atherosclerotic lesions by an impressive 85% (20).
Although it is now abundantly clear that PEMT regulates lipoprotein metabolism and modulates susceptibility to atherosclerosis, literature linking PEMT activity (and/or hepatic PC biosynthesis) with diet-induced obesity is almost non-existent. A model that has been used for studying PC deficiency is rodents that are fed a methionine-choline-deficient (MCDD) diet. MCDD fed mice have impaired PC biosynthesis and develop steatohepatitis; however, they also lose body weight and exhibit hypermetabolism (21–23). Furthermore, Ntambi and co-workers have reported a relationship between stearoyl-CoA desaturase-1 deficiency in mice (that are protected from obesity) and PC biosynthesis (24, 25). In these mice, the activity of PEMT was 80% lower than in control mice, whereas the activity of CT was increased by 60%, suggesting that hepatic PC biosynthesis plays a role in whole body energy metabolism (25).
In this study, we have investigated whether or not genetic ablation of hepatic PC biosynthesis influences the development of obesity in mice. _Pemt_−/− mice that are fed a chow diet gain weight similar to control littermates. However, _Pemt_−/− mice are protected against HF diet-induced obesity due to increased energy utilization. Unexpectedly, choline supplementation reversed the metabolic phenotype in _Pemt_−/− mice. Furthermore, liver-specific CTα knock-out mice were not similarly protected from obesity, indicating that impaired hepatic PC biosynthesis, per se, does not influence energy metabolism. Taken together, these observations clearly implicate choline and PEMT as important, and previously unappreciated, regulators of whole body energy metabolism.
MATERIALS AND METHODS
Animal Handling and Diets
All procedures were approved by the University of Alberta's Institutional Animal Care Committee in accordance with guidelines of the Canadian Council on Animal Care. Male C57Bl/6 (backcrossed >7 generations) Pemt+/+ and _Pemt_−/− mice were given free access to standard chow (LabDiet, #5001) or HF (Bio-Serv, #F3282) diets for 10 weeks. Many of the experiments were repeated with female mice, and very similar results were obtained (data not shown). All mice were fasted for 12 h before collection of blood by cardiac puncture. Tissues were collected and stored at −80 °C or preserved in 10% phosphate-buffered formalin, pH 7.0. Formalin-preserved adipose and liver samples were subjected to hematoxylin and eosin staining. The size of individual adipocytes was quantified using ImageJ from the National Institutes of Health.
In Vivo Metabolic Analysis
Metabolic measurements (O2 consumption, CO2 production, locomotor activity, and food intake) were obtained using a Comprehensive Lab Animal Monitoring System (Columbus Instruments, OH), which is an open-circuit indirect calorimetry system. Mice were housed individually for 3 days before being placed in metabolic cages. Following an initial 24-h acclimatization period, measurements were taken every 13 min for 24 h. The respiratory exchange ratio (_V_CO2/_V_O2) was used to estimate the percent contribution of fat and carbohydrate to whole body energy metabolism in mice in vivo. Lean body mass was measured by nuclear magnetic resonance using the LF90II body composition analyzer (Bruker Optics Ltd.).
Analytical Procedures
Mice were fasted for 4 or 12 h before an insulin tolerance test or glucose tolerance test, respectively, was performed. Briefly, mice were administered 0.75 unit/kg body weight human insulin or glucose (2 g/kg body weight) by intraperitoneal injection. Blood glucose was measured by a glucometer prior to injection, and at indicated times afterward. The mass of cholesterol, cholesteryl ester (CE) and TG were measured in plasma, muscle, and liver by gas-liquid chromatography (26). CoA esters were extracted from powdered muscle tissue into 6% perchloric acid and quantified by high performance liquid chromatography as previously described (27). Plasma alanine aminotransferase, non-esterified fatty acids, and total ketone bodies were measured using commercially available kits (Biotron Diagnostics and Wako Inc.). Hepatic PC and phosphatidylethanolamine were measured by a phosphorous assay after separation by thin-layer chromatography (28). Plasma insulin, adiponectin, and leptin were measured by enzyme-linked immunosorbent assays.
Quantification of Hepatic Phosphatidylcholine Molecular Species
Liver samples were homogenized in deionized water (50 mg/ml) and spiked with 5 nmol of 14:0–14:0 PC as an internal standard and extracted with chloroform, methanol and 1 n HCl. One-half of the lipid extract was reconstituted in 0.5 ml of methanol/chloroform (3:1 v/v) containing ammonium acetate (10 mm) for analysis. Tandem mass spectrometry data were obtained by triplicate injection of 10 μl of lipid extract (n = 5) (29–31). Precursor ion spectra of m/z 184 were signal averaged and corrected for the isotopic contributions of overlapping PC species. Analyte concentrations were calculated from the ratio of analyte to internal standard. Concentrations and response factors were determined with synthetic PC standards. PC data are reported as nanomoles of lipid/mg of tissue.
Real-time Quantitative PCR
Total liver RNA was isolated using TRIzol reagent (Invitrogen) according to the manufacturer's instructions. Total RNA was treated with DNase I (Invitrogen) to degrade genomic DNA, then reverse-transcribed using an oligo(dT)12–18 primer and Superscript II reverse transcriptase (Invitrogen) according to the manufacturer's instructions. Real-time quantitative PCR was performed using a Rotor-Gene 3000 instrument (Montreal Biotech) and gene-specific primers. Data analyses were performed using the Rotor-Gene 6.0.19 program (Montreal Biotech). mRNA levels were normalized to cyclophilin mRNA using a standard curve.
Electron Microscopy
All specimens were fixed in 2.5% glutaraldehyde in 0.1 m cacodylate buffer (pH 7.2) for 2 h at room temperature. The samples were rinsed in the same buffer and were fixed in 0.1% osmium tetroxide in the same buffer for 2 h. These samples were briefly washed in distilled water and dehydrated in a graded series of ethanol solutions (50%, 70%, 90 and 100%; 10 min each grade) before two 10-min washes with absolute ethanol. The samples were placed in two changes of propylene oxide and embedded in araldite. Sections were stained with uranyl acetate and lead citrate. Electron micrographs were taken with a Hitachi H7000 transmission electron microscope.
Statistical Analysis
Data are presented as means ± S.E. Comparisons between groups for glucose tolerance test or insulin tolerance tests and in vivo metabolic data were performed using an analysis of variance. For all other comparisons, a two-way t test was performed. In all tests, p < 0.05 was considered significant.
RESULTS
Pemt−/− Mice Are Protected from Diet-induced Obesity
Except for changes in lipoprotein and homocysteine metabolism, PEMT-deficient mice that are fed a standard chow diet are indistinguishable from their Pemt+/+ littermates (8, 14). At 18 weeks of age, there was no difference in body weight, food intake, oxygen consumption, or respiratory exchange ratio between _Pemt_−/− and Pemt+/+ mice (Fig. 1, A–D). We have previously reported that PEMT deficiency in mice impaired very low density lipoprotein secretion (17). Fig. 1E shows, however, that the amounts of hepatic cholesterol and TG are not influenced by Pemt genotype. The lack of change in hepatic lipids might be explained by increased expression of fatty acid oxidation genes (medium-chain acyl-CoA dehydrogenase, long-chain acyl-CoA dehydrogenase, and carnitine palmitoyltransferase 1) and a reduction in expression of lipogenic genes (sterol response element binding protein-1, stearoyl-CoA desaturase 1 (SCD1), diacylglycerol acyltransferase-1, and fatty acid synthase in the knock-out mice (supplemental Fig. S1)); however we did not measure flux through this pathway. A glucose tolerance test showed no difference between the two genotypes of mice (Fig. 1F).
FIGURE 1.

Metabolic parameters are normal in _Pemt_−/− mice fed a chow diet. All data are means ± S.E. A, body weight of 18-week-old male Pemt+/+ and _Pemt_−/− mice fed the chow diet (n = 4–5). B–F, 16-week-old Pemt+/+ and _Pemt_−/− mice that had been fed the chow diet (n = 4) were acclimatized for 24 h in an Oxymax Lab Animal Monitoring System and indirect calorimetry measurements were taken every 13 min over a 24-h period. B, food intake (b.w., body weight). C, oxygen consumption. D, respiratory exchange ratio (RER). E, hepatic lipids from male Pemt+/+ and _Pemt_−/− mice (n = 4–5) were quantified by gas chromatography. C, cholesterol; CE, cholesteryl ester; TG, triacylglycerol. F, glucose tolerance test: chow fed mice (n = 4–5) were injected intraperitoneally with 2 g/kg body weight of glucose, and blood glucose was measured between 15 and 120 min later.
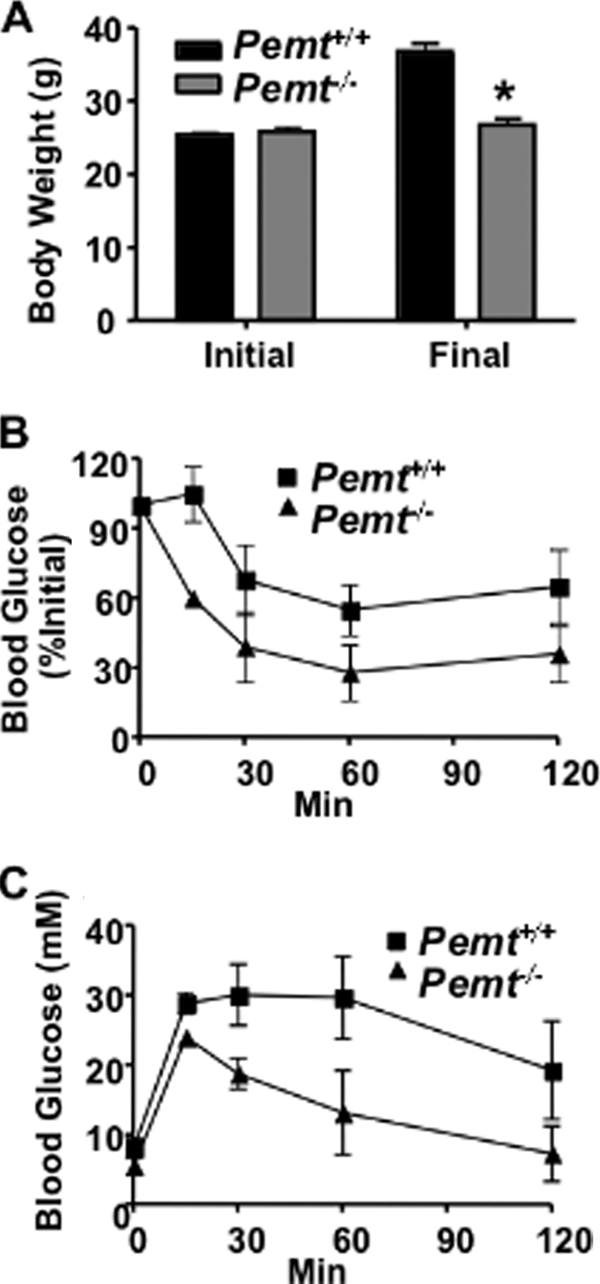
To test whether or not hepatic PC production influenced weight gain, Pemt+/+ and _Pemt_−/− mice were fed a HF diet (60% of calories from fat) for 10 weeks, starting at 8 weeks of age. Unexpectedly, _Pemt_−/− mice did not increase body mass and had markedly less visceral fat compared with littermate controls after the 10-week feeding period (Fig. 2, A and B). Plasma leptin levels were 85% lower in HF-fed _Pemt_−/− mice than in HF-fed Pemt+/+ mice (Table 1), consistent with the reduced adiposity of these mice. Histological analysis showed that visceral adipocytes from wild-type mice were much larger than adipocytes from knock-out mice (Fig. 2C and supplemental Fig. S2B). In addition, wild-type fat pads were infiltrated with macrophages, as observed by histology and confirmed by increased expression of macrophage-specific genes (CD68 and F4/80) (Fig. 2C and supplemental Fig. S2, A and C). The mRNA levels of genes involved in fatty acid oxidation in white adipose tissue (carnitine palmitoyl-CoA transferase, medium-chain acyl-CoA dehydrogenase, long-chain acyl-CoA dehydrogenase, and UCP2) were all lower in _Pemt_−/− mice, than in Pemt+/+ mice (supplemental Fig. S2D). These observations are germane to a recent report showing that overexpression of desnutrin (adipose TG lipase) in adipose tissue attenuates diet-induced obesity by increasing fatty acid oxidation (32). Thus, increased fatty acid oxidation in adipose of _Pemt_−/− mice is unlikely to account for the observed protection against diet-induced obesity. Interestingly, the mRNA encoding TG hydrolase, but not hormone-sensitive lipase or adipose TG lipase, was higher in fat pads from _Pemt_−/− mice than Pemt+/+ mice (supplemental Fig. S2D). Taken together, these results show that _Pemt_−/− mice are strikingly protected from diet-induced obesity.
FIGURE 2.

Pemt−/− mice are protected from HF diet-induced obesity and insulin resistance. Data are means ± S.E. A, body weight of 8-week-old male Pemt+/+ and _Pemt_−/− mice (n = 19–25) before (Initial) and after (Final) being fed the high fat (HF) diet for 10 weeks. B, weight of visceral white adipose tissue in mice fed the HF diet for 10 weeks (n = 6; *, p < 0.001). C, white adipose tissue from 4 Pemt+/+ (upper panel, +/+) and _Pemt_−/− (lower panel, −/−) mice was fixed in 10% buffered-formalin and stained with hematoxylin and eosin. Arrows indicate the presence of macrophages (dark areas). D, glucose tolerance test: HF diet-fed mice (n = 14–18) were injected intraperitoneally with 2 g/kg body weight of glucose, and blood glucose was measured between 15 and 120 min later. p = 0.002 for Pemt+/+ compared with _Pemt_−/− mice. E, insulin tolerance test: mice were fed the HF diet for 9 weeks after which 0.8 unit/kg body weight of human insulin was administered by intraperitoneal injection. Blood glucose was measured between 15 and 120 min later (n = 10–13). p < 0.001 for Pemt+/+ compared with _Pemt_−/− mice. F, histology: tissue was fixed in 10% buffered-formalin and stained with hematoxylin and eosin. A photomicrograph is shown that is representative of four mice of each genotype.
TABLE 1.
Plasma and liver parameters following 10 weeks of HF diet with or without choline or betaine supplementation
Eight-week-old male Pemt+/+ and _Pemt_−/− mice were fed the HF diet or the HF diet supplemented with choline (2.7 g/kg diet) or betaine (2.7 g/kg diet) for 10 weeks. Animals were sacrificed after an overnight fast. Values are means ± S.E. NEFA, non-esterified fatty acids; ALT, alanine aminotransferase; AUC, area under the curve; PC, phosphatidylcholine; PE, phosphatidylethanolamine; b.w., body weight.
| Diet | ||||||
|---|---|---|---|---|---|---|
| HF | HFCS | HF-betaine-supplemented | ||||
| PEMT genotype | +/+ | −/− | +/+ | −/− | +/+ | −/− |
| Blood/plasma | ||||||
| Triacylglycerol (mg/dl) | 27.8 ± 4.3 | 11.4 ± 1.5a | 29.7 ± 2.1 | 20.1 ± 0.9a | 30.0 ± 2.04 | 12.3 ± 2.3a |
| Cholesterol (mg/dl) | 33.6 ± 4.7 | 32.4 ± 3.1 | 24.6 ± 1.2 | 20.2 ± 1.7 | 31.6 ± 1.56 | 19.2 ± 1.6a |
| Cholesteryl ester (mg/dl) | 31.6 ± 5.8 | 12.8 ± 1.7a | 23.2 ± 1.8 | 20.6 ± 2.4 | 32.6 ± 1.7 | 10.4 ± 2.3a |
| NEFA (μm) | 198 ± 19 | 86 ± 33a | 220 ± 14 | 271 ± 45 | NDb | ND |
| Ketone bodies (μm) | 260 ± 89 | 116 ± 28a | 701 ± 83 | 578 ± 133 | ND | ND |
| ALT (units/liter) | 7.2 ± 2.5 | 71.2 ± 8.0a | 11.6 ± 7.6 | 3.5 ± 2.7 | ND | ND |
| Blood glucose (mm) | 6.8 ± 0.4 | 4.6 ± 0.2a | 7.1 ± 0.6 | 7.5 ± 0.9 | 8.1 ± 1.4 | 5.5 ± 0.7a |
| GTT (AUC) | 3075 ± 110 | 1612 ± 130a | 2780 ± 160 | 2910 ± 190 | 3090 ± 200 | 1640 ± 120a |
| Insulin (ng/ml) | 0.13 ± 0.04 | 0.10 ± 0.01 | 0.14 ± 0.03 | 0.11 ± 0.02 | ND | ND |
| Adiponectin (ng/ml) | 3.7 ± 0.3 | 2.9 ± 0.3a | 4.0 ± 0.2 | 3.1 ± 0.2a | ND | ND |
| Leptin (ng/ml) | 6.6 ± 1.8 | 1.1 ± 0.3a | 18.5 ± 6.5 | 9.7 ± 1.5a | ND | ND |
| Liver | ||||||
| Weight (% b.w.) | 3.30 ± 0.5 | 9.4 ± 1.7a | 2.73 ± 0.22 | 3.14 ± 0.21 | 3.1 ± 0.04 | 8.1 ± 0.37a |
| Triacylglycerol (μg/mg) | 185 ± 44 | 790 ± 113a | 229 ± 64 | 518 ± 242a | ND | ND |
| Cholesterol (μg/mg) | 13.7 ± 5.0 | 20 ± 5.3 | 13.2 ± 0.6 | 15.8 ± 0.96 | ND | ND |
| Cholesteryl ester (μg/mg) | 15.7 ± 4.5 | 23.8 ± 8.8a | 5.2 ± 0.8 | 10.8 ± 2.4a | ND | ND |
| PC (nmol/mg) | 76 ± 1 | 57 ± 3a | 69 ± 1 | 69 ± 2 | ND | ND |
| PE (nmol/mg) | 27 ± 2 | 25 ± 2 | 29 ± 1 | 28 ± 2 | ND | ND |
Pemt−/− Mice Fed the HF Diet Develop Steatosis
Although _Pemt_−/− mice are protected against obesity, histological examination of the liver indicated severe steatosis that coincided with hepatomegaly (Fig. 2F and Table 1). The hepatic content of CE and TG was 50 and 400% higher, respectively, in _Pemt_−/− mice, than in Pemt+/+ mice, fed the HF diet. However, PEMT deficiency decreased hepatic PC levels by 25% (Table 1).
Because prevention of fatty acid desaturation protects mice against diet-induced obesity (24), we determined hepatic PC molecular species using tandem mass spectrometry. Most molecular species of PC were less abundant in livers of _Pemt_−/− mice than in Pemt+/+ mice; however, the amounts of saturated PC species (30:0, 32:0, 34:0, and 36:0) were either increased or unchanged by PEMT deficiency (supplemental Table S1). In general, PEMT deficiency reduced the amounts of long-chain, polyunsaturated-PC species and increased the amounts of short-chain, saturated PC species. Plasma TG and CE were ∼60% lower in _Pemt_−/− mice compared with Pemt+/+ mice (supplemental Table S1). These alterations correlated with lower very low density lipoprotein levels in plasma as assessed by gel filtration analysis (data not shown). Circulating levels of non-esterified fatty acids were also 60% lower in _Pemt_−/− mice than in Pemt+/+ mice (Table 1). Plasma alanine aminotransferase activity, a measure of liver damage, was 10-fold higher in _Pemt_−/− mice than in Pemt+/+ mice (Table 1) indicating that PEMT deficiency caused significant liver damage.
To understand the one or more mechanisms by which PEMT deficiency prevents obesity but induces hepatic steatosis, we measured the levels of mRNAs encoding hepatic genes involved in transcriptional regulation, lipid metabolism (fatty acid oxidation and TG synthesis), and glucose metabolism. The hepatic gene expression of the peroxisome proliferator-activated receptors (PPARs) was not altered by PEMT deficiency in mice fed a chow diet (supplemental Fig. S1). However, PPARγ and PPARδ expression was 2.3-fold and 0.8-fold, respectively, higher in _Pemt_−/− mice, than in Pemt+/+ mice, that were fed the HF diet (supplemental Fig. S3). Furthermore, the levels of mRNAs encoding PPARα and sterol response element binding protein-1c were both 50% lower in _Pemt_−/− mice fed the HF diet (supplemental Fig. S3). Although the expression of CD36 and uncoupling protein-2 were markedly higher (5- and 4.7-fold, respectively) in _Pemt_−/− mice compared with Pemt+/+ mice, the mRNA level of genes involved in fatty acid oxidation were not altered by PEMT deficiency (supplemental Fig. S3). The amount of hepatic TG was 4-fold higher in _Pemt_−/− mice (Table 1) than in Pemt+/+ mice despite a 90 and 50%, respectively, reduction in expression of two important lipogenic genes (SCD1 and diacylglycerol acyltransferase-2) (supplemental Fig. S3). It is possible that down-regulation of expression of SCD1 and diacylglycerol acyltransferase-2 represents a compensatory mechanism that had been induced to reduce further lipid storage. Thus although the _Pemt_−/− mice are protected from diet induced obesity, severe hepatic steatosis developed.
PEMT Deficiency Protects against Insulin Resistance
To determine if PEMT deficiency altered insulin action, we performed glucose tolerance tests and insulin tolerance tests. When fed a chow diet, _Pemt_−/− mice had normal fasting blood glucose levels (Pemt+/+ _versus Pemt_−/−: 6.0 ± 0.3 versus 5.8 ± 0.3 mm) and displayed normal glucose removal following a glucose tolerance test (Fig. 1F). In addition, when _Pemt_−/− mice were fed the HF diet for 10 weeks, they exhibited lower fasting glucose than Pemt+/+ mice and displayed improved glucose clearance and insulin sensitivity (Table 1 and Fig. 2, D and E).
PEMT-deficient Mice Utilize More Energy Than Do Wild-type Mice
We next used a Comprehensive Lab Animal Monitoring System to investigate whether the lack of weight gain in _Pemt_−/− mice was due to increased energy expenditure. _Pemt_−/− mice had higher rates of oxygen consumption than did Pemt+/+ mice throughout the light and dark cycles (Fig. 3A and supplemental Fig. S4). Nevertheless, Pemt+/+ and _Pemt_−/− mice were equally active (data not shown). The respiratory exchange ratio was elevated in _Pemt_−/− mice, suggesting that these mice utilize a higher proportion of dietary glucose relative to fat than do Pemt+/+ mice (Fig. 3B), consistent with improved insulin sensitivity observed in the _Pemt_−/− mice.
FIGURE 3.
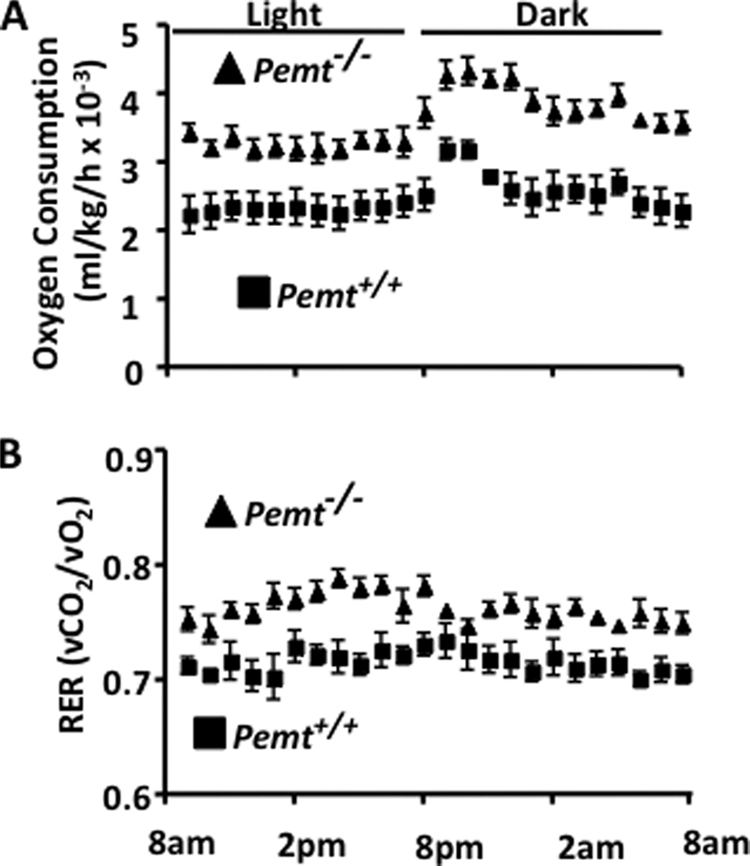
Hypermetabolism protects _Pemt_−/− mice from HF diet-induced weight gain. All data are presented as means ± S.E. 8-week-old, male Pemt+/+ and _Pemt_−/− mice that had been fed the HFD diet (n = 8–10) for 8 weeks were acclimatized for 24 h in an Oxymax Lab Animal Monitoring System, and indirect calorimetry measurements were taken every 13 min over a 24-h period. A, oxygen consumption (p < 0.001). B, respiratory exchange ratio (RER) (p < 0.05).
Unlike the liver, skeletal muscle from _Pemt_−/− mice contained 55 and 40% less neutral lipid (TG and CE, respectively) than did muscle from Pemt+/+ mice (Fig. 4A). However, the amounts of cholesterol (Fig. 4A), malonyl-CoA (Pemt+/+ _versus Pemt_−/−, 0.11 ± 0.02 versus 0.13 ± 0.04 μg/mg of protein), succinyl-CoA (Pemt+/+ _versus Pemt_−/−, 4.5 ± 0.4 versus 5.5 ± 0.3 μg/mg of protein), and acetyl-CoA (Pemt+/+ _versus Pemt_−/−, 2.7 ± 0.2 versus 3.4 ± 0.2 μg/mg of protein) in muscle were not altered by PEMT deficiency. The lower levels of neutral lipids in leg muscle from _Pemt_−/− mice correlated with increased levels of mRNAs encoding genes involved in oxidative metabolism (PGC1α, UCP3, and carnitine palmitoyltransferase 1) (Fig. 4B). Transmission electron microscopy revealed a substantial increase in size of mitochondria in leg muscle from _Pemt_−/− mice compared with Pemt+/+ mice (Fig. 4, C and D). Interestingly, 5% of mitochondria in muscle of _Pemt_−/− mice were megamitochondria, whereas no megamitochondria were detected in wild-type muscle. Together the data support the hypothesis that lack of weight gain in the _Pemt_−/− mice is due to higher whole body energy metabolism.
FIGURE 4.

Reduced neutral lipid storage in gastrocnemius muscle of HF diet-fed _Pemt_−/− mice. Whole gastrocnemius muscles were removed from HF diet-fed Pemt+/+ and _Pemt_−/− mice that had been fasted overnight. A, neutral lipids (C, cholesterol; CE, cholesteryl ester; and TG, triacylglycerol) were quantified by gas chromatography; *, p < 0.05. B, the relative levels of mRNA-encoding genes involved in fatty acid metabolism were determined by real-time quantitative PCR. Data are relative to cyclophilin mRNA in the same sample (n = 4). *, p < 0.05. _PGC1_α, PPARγ co-activator; UCP, uncoupling protein; MCD1, malonyl-CoA decarboxylase 1; CPT1, carnitine palmitoyl-CoA transferase 1; ACC, acetyl-CoA carboxylase. C, transmission electron microscope images of mitochondria (some indicated by arrows) in gastrocnemius muscle (10,000-fold magnification). D, the size of individual mitochondria (n = 70–100) was quantified using ImageJ software and is displayed using a box and whiskers plot (p < 0.05).
Pemt−/− Mice Develop Hypermetabolism and Hepatic Steatosis Prior to Changes in Body Weight Compared to Pemt+/+ Mice
To better understand the mechanisms that protect _Pemt_−/− mice from obesity, we fed mice of both Pemt genotypes the HF diet for 2 weeks. In contrast to the long-term feeding, there was no difference in body weight between Pemt+/+ and _Pemt_−/− mice subjected to the short-term feeding regimen (Fig. 5A). However, hepatomegaly, steatosis, and liver damage (as assessed by plasma alanine aminotransferase activity) were evident in _Pemt_−/− mice, but not Pemt+/+ mice within 14 days (Fig. 5, B–D).
FIGURE 5.

Pemt−/− mice fed the HF diet develop hypermetabolism and hepatic steatosis prior to changes in body weight. A, body weight of male 8-week-old Pemt+/+ and _Pemt_−/− mice (n = 4–5) was measured after 14 days of HF diet feeding. B, liver weight was measured as % of total body weight (b.w.) in overnight-fasted mice after 14 days of HF-diet feeding. C, liver histology: liver tissue was fixed in 10% buffered-formalin and stained with hematoxylin and eosin. D, plasma alanine aminotransferase (ALT) levels were measured in blood from fasted mice (n = 4–5). *, p < 0.05 after 14 days of HF diet feeding. E, food intake (g/g body weight/day) of male Pemt+/+ and _Pemt_−/− mice (n = 4–5) following 10 days or 10 weeks of HF-diet feeding. *, p < 0.05. F, oxygen consumption of Pemt+/+ and _Pemt_−/− mice fed a HF diet for 10 days (n = 4–5) were measured using indirect calorimetry.
Although there was no difference in weight gain between genotypes, _Pemt_−/− mice displayed higher oxygen consumption (Fig. 5F). Nor was daily food intake different between _Pemt_−/− and Pemt+/+ mice after 10 days of the HF diet. However, after 10 weeks, the _Pemt_−/− mice ate twice as much food per day as did the Pemt+/+ mice (Fig. 5E). The lower daily food intake in Pemt+/+ mice after 10 weeks compared with 10 days likely reflects a compensatory mechanism that was induced by the onset of obesity and is consistent with the 6-fold higher level of circulating leptin, an appetite suppresser, in Pemt+/+, compared with _Pemt_−/−, mice (Table 1).
Biosynthesis of PC by the Choline Pathway Does Not Protect Mice against HF Diet-induced Obesity
Because attenuated PC biosynthesis protected _Pemt_−/− mice from diet-induced obesity, we expected that LCTαKO mice would be similarly protected. We have previously shown that the rate of hepatic PC synthesis is markedly lower in LCTαKO mice than in CTα-floxed control mice (33, 34). When fed the chow diet, LCTαKO mice have reduced amounts of plasma very low density lipoproteins and high density lipoproteins, impaired very low density lipoprotein secretion, and develop mild steatosis, compared with CTα-floxed mice (33). When LCTαKO mice were fed the HF diet, the amount of hepatic TG was 5-fold higher (372.4 ± 52.6 μg/mg of protein) than in CTα-floxed mice (71.1 ± 17.8 μg/mg of protein). Histological analysis also revealed severe liver steatosis (Fig. 6A). Despite the development of hepatic steatosis in LCTαKO mice, weight gain and glucose tolerance (Fig. 6B, D) were the same as in CTα-floxed mice. Furthermore, metabolic parameters (oxygen consumption, food intake, activity, and respiratory exchange ratio) were not influenced by elimination of hepatic CTα (Fig. 6C and data not shown). These data suggest that impaired hepatic PC biosynthesis alone does not protect mice against diet-induced obesity.
FIGURE 6.

CTαLKO mice are not protected from HF diet-induced obesity. Data are means ± S.E. A, liver histology: tissue was fixed in 10% buffered-formalin and stained with hematoxylin and eosin. A representative picture of liver sections from four individual mice/group is shown. B, body weight of 8-week-old male floxed (control) and CTαLKO mice (n = 6) before and after being fed the HF diet for 10 weeks. C, oxygen consumption: male floxed and CTαLKO mice (n = 6) that had been fed the HF diet for 8 weeks were acclimatized for 24 h in an Oxymax Lab Animal Monitoring System, and indirect calorimetry measurements were taken every 13 min over a 24-h period. D, glucose tolerance test: 2 g of glucose/kg of body weight was administered by intraperitoneal injection to mice (n = 6) that had been fed the HF diet for 9 weeks. Blood glucose was measured at indicated times.
Choline Supplementation Eliminates the Beneficial Metabolic Phenotypes in Pemt−/− Mice
A major difference between _Pemt_−/− mice and LCTαKO mice is that LCTαKO mice can synthesize choline de novo via catabolism of PEMT-derived PC. Therefore, we determined if the protection of _Pemt_−/− mice from diet-induced obesity were due to attenuated choline production/decreased choline availability. The HF diet used in our experiments contained 1.3 g of choline/kg of diet. We tripled the amount of choline to 4 g of choline/kg of diet and fed this high fat choline-supplemented (HFCS) diet to Pemt+/+ and _Pemt_−/− mice for 10 weeks. Remarkably, choline supplementation eliminated the difference in weight gain (Fig. 2A) between Pemt+/+ and _Pemt_−/− mice (Fig. 7A). Moreover, Pemt+/+ and _Pemt_−/− mice that were fed the HFCS diet had similar levels of fasting blood glucose, had plasma insulin, and displayed similar glucose clearance and insulin sensitivity (Table 1 and Fig. 7, B and C). The level of plasma adiponectin was 30% lower in HFCS-_Pemt_−/− mice than in HFCS-Pemt+/+ mice (Table 1). In our initial experiments with Pemt+/+ and _Pemt_−/− mice fed the HF diet that contained 1.3 g of choline/kg of diet, plasma leptin levels were 6-fold lower in _Pemt_−/− mice than in Pemt+/+ mice (Table 1). In contrast, the addition of choline to the HF diet (i.e. HFCS diet) reduced the difference in leptin levels between Pemt+/+ and _Pemt_−/− mice to 2-fold (Table 1). No differences were observed in plasma cholesterol, cholesteryl ester, and non-esterified fatty acids between Pemt+/+ and _Pemt_−/− mice fed the HFCS diet but plasma TG was slightly lower in the _Pemt_−/− mice than in the Pemt+/+ mice (Table 1). Plasma ketone bodies in Pemt+/+ mice and _Pemt_−/− mice fed the HFCS diet were similar (Table 1); however, the levels of ketone bodies were five times higher than we observed in the HF-fed (1.3 g choline/kg of diet) _Pemt_−/− mice.
FIGURE 7.

Metabolic phenotype of _Pemt_−/− mice fed the HF diet is reversed by choline supplementation. Data are means ± S.E. A, body weight of 8-week-old male Pemt+/+ and _Pemt_−/− mice (n = 8–12) before (Initial) and after (Final) being fed the HFCS diet for 10 weeks. B, insulin tolerance test: 0.8 unit/kg body weight of human insulin was administered to mice that had been fed the HFCS diet for 9 weeks by intraperitoneal injection. Blood glucose was measured (n = 10–12). C, glucose tolerance test: 2 g of glucose/kg of body weight was administered by intraperitoneal injection to mice that had been fed the HFCS diet for 9 weeks. Blood glucose was measured (n = 8–12). D, oxygen consumption: Pemt+/+ and _Pemt_−/− mice that had been fed the HFCS diet for 8 weeks (n = 5) were acclimatized for 24 h in an Oxymax Lab Animal Monitoring System, and indirect calorimetry measurements were taken every 13 min over a 24-h period.
_Pemt_−/− mice that were fed the HF diet had higher energy expenditure than did Pemt+/+ mice (Fig. 3) providing a possible explanation for why _Pemt_−/− mice were protected from HF diet-induced obesity. In contrast, there was no statistical difference in oxygen consumption between Pemt+/+ and _Pemt_−/− mice fed the HFCS diet, (Fig. 7D). The data demonstrate that supplementation with high amounts of choline prevented the phenotype of _Pemt_−/− mice fed the HF diet.
The hepatomegaly that occurred in _Pemt_−/− mice fed the HF diet (1.3 g of choline/kg of diet) did not occur in _Pemt_−/− or Pemt+/+ mice fed the HFCS diet (Table 1). Hepatic PC and phosphatidylethanolamine levels and the PC/phosphatidylethanolamine ratio were the same in mice of both Pemt genotypes fed the HFCS diet (Table 1). Consistent with the normal PC/phosphatidylethanolamine ratio (an indicator of cell viability), plasma alanine aminotransferase activity was not higher in HFCS-_Pemt_−/− mice than in HFCS-Pemt+/+ mice (Table 1). Thus, although supplementation of the diet with choline eliminated differences in weight gain and prevented liver damage in _Pemt_−/− mice, choline supplementation of the HF diet did not completely prevent steatosis, because the amounts of hepatic TG and CE were 2.3- and 2.1-fold higher, respectively, in HFCS-_Pemt_−/− mice than in HFCS-Pemt+/+ mice (Table 1). Analyses of expression of genes that were different between _Pemt_−/− and Pemt+/+ mice fed the HF diet showed that all genes examined, with the exception of SCD1, were expressed at similar levels in HFCS-_Pemt_−/− and HFCS-Pemt+/+ mice (supplemental Fig. S5). Although SCD1 deficiency reduces weight gain in other mouse models (19–21), it is apparent that the profound reduction in hepatic SCD1 expression in _Pemt_−/− mice (supplemental Fig. S3) is not related to the anti-obesity phenotype caused by PEMT deficiency.
Pemt−/− Mice Are Resistant to Diet-induced Obesity When Supplemented with Betaine
To examine the mechanism by which choline modulates the development of obesity, we fed Pemt+/+ and _Pemt_−/− mice the HF diet (1.3 g of choline/kg of diet) supplemented with betaine (2.7 g/kg of diet). Betaine is an important methyl-group donor and osmolyte (35, 36). In hepatocytes, ∼60% of choline is converted to betaine (37). Oral supplementation of betaine has been shown to alleviate both alcoholic- and non-alcoholic fatty liver disease (38, 39), prevent sucrose-induced steatosis (40), and reduce atherosclerosis in methyl group-deficient animals (41). We, therefore, tested the idea that the effects of choline supplementation in _Pemt_−/− mice fed the HF diet were due to increased supply of betaine, rather than choline, supply. Pemt+/+ and _Pemt_−/− mice gained approximately the same amount of weight when fed the HFCS diet for 10 weeks (Fig. 7A). However, the Pemt+/+ mice fed the betaine-supplemented diet gained weight, whereas the _Pemt_−/− mice did not (Fig. 8A). In addition, the difference in glucose tolerance and insulin resistance observed between Pemt+/+ and _Pemt_−/− mice fed the HF diet (Fig. 2, G and F) was prevented by choline (Fig. 7, B and C) but not by betaine (Fig. 8, B and C).
FIGURE 8.
Betaine supplementation does not induce weight gain or insulin resistance in _Pemt_−/− mice fed the HF diet. A, body weight of 8-week-old male Pemt+/+ and _Pemt_−/− mice (n = 10–12) before (Initial) and after (Final) the mice were fed the HF-betaine-supplemented diet for 10 weeks (*, p < 0.001). B and C, after the mice had been fed the HF-betaine-supplemented diet for 9 weeks (B) insulin and (C) glucose tolerance tests were performed (n = 8–12). p < 0.01.
Plasma lipids were lower in HF-betaine-supplemented _Pemt_−/− mice than in Pemt+/+ mice fed the same diet (Table 1). In contrast, cholesterol and cholesteryl ester levels in plasma were the same in Pemt+/+ and _Pemt_−/− mice fed the HFCS diet (Table 1). Moreover, hepatomegaly developed in HF-betaine-supplemented _Pemt_−/− mice but not in Pemt+/+ mice (Table 1). These observations demonstrate that, neither betaine, nor any of its downstream metabolites such as methionine or _S_-adenosylmethionine, is responsible for the phenotypic reversal in _Pemt_−/− mice supplemented with choline.
Choline Deficiency Reduces Weight Gain in Pemt+/+
From the combined data, it is apparent that a low choline content of the diet is central to preventing diet-induced obesity in _Pemt_−/− mice. Can this phenotype be recapitulated in Pemt+/+ mice? To answer this question we fed Pemt+/+ mice a diet completely lacking choline (CD) or a diet containing 4 g of choline/kg of diet (CS) for 12 weeks. The CD mice gained less weight than did the CS mice during the 12-week feeding period (Fig. 9A). The slower rate of weight gain in CD mice compared with CS mice correlated with an improved glucose tolerance (Fig. 9B). Furthermore, the CD-Pemt+/+ mice consumed slightly more oxygen than did the CS-Pemt+/+ mice (Fig. 9C). The data demonstrate that choline deficiency in wild-type mice recapitulates the anti-obesity phenotype of the _Pemt_−/− mice fed the HF diet.
FIGURE 9.

Attenuated weight gain, increased oxygen consumption, and improved glucose tolerance in Pemt+/+ mice fed the choline-deficient diet. Data are means ± S.E. 8-week-old male Pemt+/+ mice (n = 6) were fed a choline-supplemented (CS) or choline-deficient (CD) diet for 12 weeks. A, weight of the mice was measured at indicated times (p < 0.01). B, glucose tolerance test: 2 g of glucose/kg of body weight was administered by intraperitoneal injection, and blood glucose was measured after 15, 30, 60, and 120 min (n = 6; p < 0.0001). C, oxygen consumption (p < 0.0001) was measured in Pemt+/+ mice that had been fed the CS or CD diet for 9 weeks. D, weight gain of 8-week-old male Pemt+/+ and _Pemt_−/− mice that had been fed either the HF diet or the HFCS diet for 10 weeks after a 10-week HF/CS feeding period (n = 5–8).
To determine if the ability of choline to increase the rate of weight gain were reversible, we fed Pemt+/+ and _Pemt_−/− mice the HFCS diet for 10 weeks; the rate of weight gain was equivalent in mice of the two Pemt genotypes (Fig. 9D). Subsequently, Pemt+/+ mice and _Pemt_−/− mice were fed either the HF diet (1.3 g of choline/kg of diet) or the HFCS diet (4 g of choline/kg of diet) for an additional 9 weeks. The weight gain of Pemt+/+ mice (fed either the HF or the HFCS diet), and of _Pemt_−/− mice fed the HFCS diet, was the same, with body weights being more than doubled at the end of the 9 weeks. However, in the HF-fed (1.3 g of choline/kg of diet) _Pemt_−/− mice, body weight was stable for 5 weeks followed by a decline. At the end of the experiment, the body weight gain of the HF-_Pemt_−/− mice was 80% lower than that of either the HF-Pemt+/+ mice or the HFCS-fed _Pemt_−/− and Pemt+/+ mice (Fig. 9E). Furthermore, hepatomegaly developed in the HF-_Pemt_−/− mice, but not in the HFCS-_Pemt_−/− mice (data not shown). These experiments clearly show that prevention of diet-induced obesity by PEMT deficiency is not due to lack of PC synthesis from PEMT, per se, but is due to limited availability of choline.
DISCUSSION
The anti-obesity effects of PEMT deficiency were remarkable given the lack of difference between Pemt+/+ and _Pemt_−/− mice fed a standard chow diet. Our initial assumption was that impaired hepatic PC biosynthesis was the antecedent for the striking protection from the HF diet-induced obesity and glucose intolerance. However, this idea was placed in doubt when HF diet-fed LCTαKO mice developed obesity and glucose intolerance. Because the CT-mediated pathway is quantitatively more important for PC biosynthesis than the PEMT pathway (9), it is, therefore, unlikely that impaired hepatic PC biosynthesis itself is responsible for the phenotype of the _Pemt_−/− mice. Consequently, because PEMT is the only de novo source of choline, we postulated that choline availability is an important regulator of energy metabolism. The results from our research provide compelling support for PEMT and choline supply to be unexpected regulators of energy metabolism.
Comparisons with Rodents Fed an MCDD
Choline-deficient states, both mild and severe, have been used to investigate aspects of the metabolic syndrome, including fatty liver, dyslipidemia, and insulin resistance. A commonly used model for investigation of non-alcoholic fatty liver disease is rodents fed a MCCD. MCDD-fed rats have impaired PC biosynthesis, which leads to diminished very low density lipoprotein secretion and hepatic steatosis (42).
Although MCDD-fed mice share much of the same phenotype with the HF-fed _Pemt_−/− mice, some key differences are apparent between the models. For example, although both models develop hepatic steatosis, _Pemt_−/− mice develop hepatomegaly when fed a HF diet, whereas MCDD mice have a decreased ratio of liver weight to total body weight. Increased energy expenditure was observed in both models. However, weight loss occurred in MCDD-fed mice (23), whereas _Pemt_−/− mice were able to maintain their body mass. Because methionine is an essential amino acid that is required for body maintenance and growth, the loss of body mass in the MCDD-fed mice is probably, at least in part, due to impaired whole body protein biosynthesis.
Experiments in the MCDD model have provided variable results with respect to glucose metabolism and insulin signaling. Peripheral insulin action has been reported to be normal, hypernormal, and improved in MCDD-fed rodents (22, 43, 44). However, impaired hepatic insulin action (i.e. impaired receptor phosphorylation and Akt activation) in MCDD-fed mice has been reported (44, 45). In the present study we show that _Pemt_−/− mice have reduced plasma glucose, and improved peripheral insulin action (as assessed by glucose tolerance test and insulin tolerance test). Furthermore, hepatic levels of phosphoenolpyruvate carboxykinase and glucose-6-phosphate phosphatase mRNA were decreased by PEMT deficiency, whereas pAkt levels appeared normal (data not shown), suggesting that sensitivity to insulin signaling remains intact in HF-_Pemt_−/− mice. Our data add to the increasing wealth of evidence indicating that fatty liver does not, by itself, induce peripheral insulin resistance (5, 46, 47).
A less extreme model is choline deficiency with normal methionine, which causes fatty liver in mice without the complications contributed by elimination of methionine from the diet. Raubenheimer et al. found that when obese mice were fed a CD-HF diet, compared with a CS-HF diet, for 4 weeks insulin resistance and glucose intolerance were reduced (48). In contrast to our study with HF-fed PEMT-deficient mice, however, no difference was observed in weight gain between the dietary treatments in the obese mice. However, the mice were fed a HF diet, so that obesity was induced, before the animals were switched to the CD diet, which might explain why no difference in weight gain was reported between dietary treatments.
Choline and Diet-induced Obesity
Data from the three mouse models reported in the present study (_Pemt_−/−, LCTαKO, and CD-Pemt+/+ mice) strongly suggest that impaired hepatic PC biosynthesis is not the mechanism by which choline deficiency prevents diet-induced obesity. What, therefore, is the mechanism by which choline regulates energy metabolism? The conversion of choline to acetylcholine in neurons might provide a clue. Under normal conditions the availability of choline for acetylcholine production in cholinergic neurons is controlled by a high affinity choline transporter, which is normally saturated with choline (49, 50). However, when acetylcholine turnover is high, choline supply appears to become limiting for the production of acetylcholine (51). Furthermore, brain choline and acetylcholine levels are lower in rats fed a diet devoid of choline than in rats fed a choline-replete diet (52). The M3 muscarinic acetylcholine subtype receptor is important in regulating energy metabolism (53). Mice that lacked the M3 receptor displayed increased energy expenditure, were protected from obesity, and showed increased insulin sensitivity. Because the M3 receptor is expressed primarily in the central nervous system, and not in tissues (such as muscle, adipose and liver) that play major roles in glucose and lipid metabolism, it was suggested that activation of the M3 receptor in the central nervous system by acetylcholine is required for obesity to develop on a HF diet (53). Taken together, these data indicate that choline supply from the liver might control energy expenditure by modulating the activation of central M3 muscarinic acetylcholine receptors by acetylcholine.
Alternatively, choline might elicit its effects through other mechanisms. For example, overexpression of hepatic PPARγ or deletion of PPARα increases energy expenditure and reduces peripheral insulin resistance (5, 54). Because we observed elevated levels of hepatic PPARγ and decreased PPARα mRNA in the HF-fed _Pemt_−/− mice (supplemental Fig. S3), and the expression of these genes was reversed by choline supplementation, altered expression of one or both of these transcriptional regulators might play a role in the observed anti-obesity phenotype of PEMT-deficient mice. It is also possible, but less likely, because PEMT expression in extra-hepatic tissues is very low (11), that PC biosynthesis in peripheral tissues, such as white adipose tissue and muscle, is impaired in _Pemt_−/− mice resulting in a reduced ability of these mice to store TG (fat) and increased fuel oxidation (muscle).
Other studies have shown that metabolites of choline can acutely regulate hormone release from endocrine cells. For example, intraperitoneal injection of choline, P-choline, or CDP-choline into rats increased the secretion of glucagon and insulin from the pancreas (55, 56). Furthermore, intraperitoneal injections of choline stimulate insulin secretion by activating pancreatic muscarinic receptors and nicotinic acetylcholine receptors (56). Clearly, both long and short term alterations in levels of choline metabolites can influence in vivo hormone action.
Studies in Humans
These studies raise the important question: does choline regulate energy metabolism in humans? Studies performed by the Zeisel laboratory have convincingly shown that choline deficiency can cause fatty liver in humans (10, 57). Furthermore, a single nucleotide polymorphism (−744 G-C) in the promoter of the PEMT gene is present in ∼80% of people who develop organ dysfunction when fed a low choline diet (58). A second polymorphism in the PEMT coding region (+5465 G-A) reduces PEMT enzymatic activity by 30% and is associated with increased risk of non-alcoholic fatty liver disease (59).
Although these studies highlight the importance of PEMT in maintaining liver function, a role for PEMT and/or choline in insulin signaling or energy metabolism has not been investigated in humans. However, the recent Hordaland Health Study investigated the relationship between plasma choline levels and cardiovascular disease risk factors, such as obesity and glucose metabolism, in over 7000 men and women (60). Interestingly, serum TG and glucose were lowest in subjects in the lowest quartile of plasma choline. Furthermore, plasma choline was positively correlated with body mass index, percent body fat, and waist circumference. These population-based results are consistent with the data from our mouse study. The plasma level of betaine was inversely correlated with body mass index, percent body fat, waist circumference, and plasma TG (60). These observations provide further evidence that the anti-obesity effects of PEMT deficiency in mice cannot be explained by decreased betaine supply.
Conclusion
The lack of PEMT provides impressive protection against diet-induced obesity and insulin resistance. When _Pemt_−/− mice were fed a high fat diet, oxygen consumption was increased and weight gain was prevented. In these mice, TG storage was shifted from adipose to liver (for storage) and muscle (for oxidation). The most likely explanation for these observations is that PEMT deficiency decreases the availability of choline. Taken together, this study clearly implicates choline and PEMT, as important, and previously unappreciated, regulators of whole body energy metabolism. It is possible that PEMT may be a useful pharmacologic target for the treatment of obesity and insulin resistance; however, the side-effects of hepatic steatosis would need to be addressed. On the other hand, it may be possible to modify dietary intake of choline in humans to achieve increased oxygen consumption without a concomitant alteration of liver phenotype.
Supplementary Material
Supplemental Data
Acknowledgments
We thank Sandra Ungarian, Sandra Kelly, Audric Moses, Pricilla Gao, Randy Nelson, Kristina MacNaughton, and Laura Hargreaves for their excellent technical assistance. We thank Prof. Jean Vance for helpful discussions.
*
This work was supported in part by the Canadian Institutes for Health Research (Grants MOP 89793 and MOP 67053) and Merck Frosst.
3
The abbreviations used are:
PC
phosphatidylcholine
CD
choline-deficient
CE
cholesteryl ester
CT
CTP:phosphocholine cytidylyltransferase
CS
choline-supplemented
HF
high fat
HFCS
high fat choline-supplemented
LCTαKO
liver-specific knockout of CTP:phosphocholine cytidylyltransferase α
MCDD
methionine- and choline-deficient diet
PEMT
phosphatidylethanolamine _N_-methyltransferase
TG
triacylglycerol
PPAR
peroxisome proliferator-activated receptor.
REFERENCES
- 1.Muoio D. M., Newgard C. B. (2006) Annu. Rev. Biochem. 75, 367–401 [DOI] [PubMed] [Google Scholar]
- 2.Kalaany N. Y., Gauthier K. C., Zavacki A. M., Mammen P. P., Kitazume T., Peterson J. A., Horton J. D., Garry D. J., Bianco A. C., Mangelsdorf D. J. (2005) Cell Metab. 1, 231–244 [DOI] [PubMed] [Google Scholar]
- 3.Hubbard B., Doege H., Punreddy S., Wu H., Huang X., Kaushik V. K., Mozell R. L., Byrnes J. J., Stricker-Krongrad A., Chou C. J., Tartaglia L. A., Lodish H. F., Stahl A., Gimeno R. E. (2006) Gastroenterology 130, 1259–1269 [DOI] [PubMed] [Google Scholar]
- 4.Pospisilik J. A., Knauf C., Joza N., Benit P., Orthofer M., Cani P. D., Ebersberger I., Nakashima T., Sarao R., Neely G., Esterbauer H., Kozlov A., Kahn C. R., Kroemer G., Rustin P., Burcelin R., Penninger J. M. (2007) Cell 131, 476–491 [DOI] [PubMed] [Google Scholar]
- 5.Uno K., Katagiri H., Yamada T., Ishigaki Y., Ogihara T., Imai J., Hasegawa Y., Gao J., Kaneko K., Iwasaki H., Ishihara H., Sasano H., Inukai K., Mizuguchi H., Asano T., Shiota M., Nakazato M., Oka Y. (2006) Science 312, 1656–1659 [DOI] [PubMed] [Google Scholar]
- 6.An J., Muoio D. M., Shiota M., Fujimoto Y., Cline G. W., Shulman G. I., Koves T. R., Stevens R., Millington D., Newgard C. B. (2004) Nat. Med. 10, 268–274 [DOI] [PubMed] [Google Scholar]
- 7.Wunderlich F. T., Luedde T., Singer S., Schmidt-Supprian M., Baumgartl J., Schirmacher P., Pasparakis M., Brüning J. C. (2008) Proc. Natl. Acad. Sci. U.S.A. 105, 1297–1302 [DOI] [PMC free article] [PubMed] [Google Scholar]
- 8.Vance D. E., Li Z., Jacobs R. L. (2007) J. Biol. Chem. 282, 33237–33241 [DOI] [PubMed] [Google Scholar]
- 9.DeLong C. J., Shen Y. J., Thomas M. J., Cui Z. (1999) J. Biol. Chem. 274, 29683–29688 [DOI] [PubMed] [Google Scholar]
- 10.Zeisel S. H., Da Costa K. A., Franklin P. D., Alexander E. A., Lamont J. T., Sheard N. F., Beiser A. (1991) FASEB J. 5, 2093–2098 [PubMed] [Google Scholar]
- 11.Vance D. E., Vance J. E. (2008) in Biochemsitry of Lipids, Lipoproteins and Membranes, 5th Edition (Vance D. E., Vance J. E. eds) pp. 213–244, Elsevier, Amsterdam [Google Scholar]
- 12.Tang W., Keesler G. A., Tabas I. (1997) J. Biol. Chem. 272, 13146–13151 [DOI] [PubMed] [Google Scholar]
- 13.Karim M., Jackson P., Jackowski S. (2003) Biochim. Biophys. Acta 1633, 1–12 [DOI] [PubMed] [Google Scholar]
- 14.Walkey C. J., Donohue L. R., Bronson R., Agellon L. B., Vance D. E. (1997) Proc. Natl. Acad. Sci. U.S.A. 94, 12880–12885 [DOI] [PMC free article] [PubMed] [Google Scholar]
- 15.Agellon L. B., Walkey C. J., Vance D. E., Kuipers F., Verkade H. J. (1999) Hepatology 30, 725–729 [DOI] [PubMed] [Google Scholar]
- 16.Verkade H. J., Havinga R., Shields D. J., Wolters H., Bloks V. W., Kuipers F., Vance D. E., Agellon L. B. (2007) J. Lipid Res. 48, 2058–2064 [DOI] [PubMed] [Google Scholar]
- 17.Noga A. A., Zhao Y., Vance D. E. (2002) J. Biol. Chem. 277, 42358–42365 [DOI] [PubMed] [Google Scholar]
- 18.Noga A. A., Vance D. E. (2003) J. Biol. Chem. 278, 21851–21859 [DOI] [PubMed] [Google Scholar]
- 19.Robichaud J. C., Francis G. A., Vance D. E. (2008) J. Biol. Chem. 283, 35496–35506 [DOI] [PubMed] [Google Scholar]
- 20.Zhao Y., Su B., Jacobs R. L., Kennedy B., Francis G. A., Waddington E., Brosnan J. T., Vance J. E., Vance D. E. (2009) Arterioscler. Thromb. Vasc. Biol. 29, 1349–1355 [DOI] [PubMed] [Google Scholar]
- 21.Rinella M. E., Elias M. S., Smolak R. R., Fu T., Borensztajn J., Green R. M. (2008) J. Lipid Res. 49, 1068–1076 [DOI] [PMC free article] [PubMed] [Google Scholar]
- 22.Rinella M. E., Green R. M. (2004) J. Hepatol. 40, 47–51 [DOI] [PubMed] [Google Scholar]
- 23.Rizki G., Arnaboldi L., Gabrielli B., Yan J., Lee G. S., Ng R. K., Turner S. M., Badger T. M., Pitas R. E., Maher J. J. (2006) J. Lipid Res. 47, 2280–2290 [DOI] [PubMed] [Google Scholar]
- 24.Cohen P., Miyazaki M., Socci N. D., Hagge-Greenberg A., Liedtke W., Soukas A. A., Sharma R., Hudgins L. C., Ntambi J. M., Friedman J. M. (2002) Science 297, 240–243 [DOI] [PubMed] [Google Scholar]
- 25.Dobrzyn A., Dobrzyn P., Miyazaki M., Sampath H., Chu K., Ntambi J. M. (2005) J. Biol. Chem. 280, 23356–23362 [DOI] [PubMed] [Google Scholar]
- 26.Kuksis A., Myher J. J. (1989) Adv. Chromatogr. 28, 267–332 [PubMed] [Google Scholar]
- 27.Dyck J. R., Cheng J. F., Stanley W. C., Barr R., Chandler M. P., Brown S., Wallace D., Arrhenius T., Harmon C., Yang G., Nadzan A. M., Lopaschuk G. D. (2004) Circ. Res. 94, e78–84 [DOI] [PubMed] [Google Scholar]
- 28.Jacobs R. L., Lingrell S., Zhao Y., Francis G. A., Vance D. E. (2008) J. Biol. Chem. 283, 2147–2155 [DOI] [PubMed] [Google Scholar]
- 29.Liebisch G., Lieser B., Rathenberg J., Drobnik W., Schmitz G. (2004) Biochim. Biophys. Acta 1686, 108–117 [DOI] [PubMed] [Google Scholar]
- 30.Li Z., Hailemariam T. K., Zhou H., Li Y., Duckworth D. C., Peake D. A., Zhang Y., Kuo M. S., Cao G., Jiang X. C. (2007) Biochim. Biophys. Acta 1771, 1186–1194 [DOI] [PMC free article] [PubMed] [Google Scholar]
- 31.Chen Y. Q., Kuo M. S., Li S., Bui H. H., Peake D. A., Sanders P. E., Thibodeaux S. J., Chu S., Qian Y. W., Zhao Y., Bredt D. S., Moller D. E., Konrad R. J., Beigneux A. P., Young S. G., Cao G. (2008) J. Biol. Chem. 283, 10048–10057 [DOI] [PMC free article] [PubMed] [Google Scholar]
- 32.Ahmadian M., Duncan R. E., Varady K. A., Frasson D., Hellerstein M. K., Birkenfeld A. L., Samuel V. T., Shulman G., Wang Y., Kang C., Sul H. S. (2009) Diabetes 58, 855–866 [DOI] [PMC free article] [PubMed] [Google Scholar]
- 33.Jacobs R. L., Devlin C., Tabas I., Vance D. E. (2004) J. Biol. Chem. 279, 47402–47410 [DOI] [PubMed] [Google Scholar]
- 34.Jacobs R. L., Stead L. M., Devlin C., Tabas I., Brosnan M. E., Brosnan J. T., Vance D. E. (2005) J. Biol. Chem. 280, 28299–28305 [DOI] [PubMed] [Google Scholar]
- 35.Delgado-Reyes C. V., Garrow T. A. (2005) Am. J. Physiol. Regul. Integr. Comp. Physiol. 288, R182–R187 [DOI] [PubMed] [Google Scholar]
- 36.Ueland P. M., Holm P. I., Hustad S. (2005) Clin. Chem. Lab. Med. 43, 1069–1075 [DOI] [PubMed] [Google Scholar]
- 37.Pritchard P. H., Vance D. E. (1981) Biochem. J. 196, 261–267 [DOI] [PMC free article] [PubMed] [Google Scholar]
- 38.Kim S. J., Jung Y. S., Kwon do Y., Kim Y. C. (2008) Biochem. Biophys. Res. Commun. 368, 893–898 [DOI] [PubMed] [Google Scholar]
- 39.Abdelmalek M. F., Angulo P., Jorgensen R. A., Sylvestre P. B., Lindor K. D. (2001) Am. J. Gastroenterol. 96, 2711–2717 [DOI] [PubMed] [Google Scholar]
- 40.Song Z., Deaciuc I., Zhou Z., Song M., Chen T., Hill D., McClain C. J. (2007) Am. J. Physiol. Gastrointest. Liver Physiol. 293, G894–G902 [DOI] [PMC free article] [PubMed] [Google Scholar]
- 41.Schwahn B. C., Wang X. L., Mikael L. G., Wu Q., Cohn J., Jiang H., Maclean K. N., Rozen R. (2007) Atherosclerosis 195, e100–107 [DOI] [PubMed] [Google Scholar]
- 42.Yao Z. M., Vance D. E. (1988) J. Biol. Chem. 263, 2998–3004 [PubMed] [Google Scholar]
- 43.Veteläinen R., van Vliet A., van Gulik T. M. (2007) J. Gastroenterol. Hepatol. 22, 1526–1533 [DOI] [PubMed] [Google Scholar]
- 44.Leclercq I. A., Lebrun V. A., Stärkel P., Horsmans Y. J. (2007) Lab. Invest. 87, 56–65 [DOI] [PubMed] [Google Scholar]
- 45.Schattenberg J. M., Wang Y., Singh R., Rigoli R. M., Czaja M. J. (2005) J. Biol. Chem. 280, 9887–9894 [DOI] [PubMed] [Google Scholar]
- 46.Monetti M., Levin M. C., Watt M. J., Sajan M. P., Marmor S., Hubbard B. K., Stevens R. D., Bain J. R., Newgard C. B., Farese R. V., Sr., Hevener A. L., Farese R. V., Jr. (2007) Cell Metab. 6, 69–78 [DOI] [PubMed] [Google Scholar]
- 47.Yu X. X., Murray S. F., Pandey S. K., Booten S. L., Bao D., Song X. Z., Kelly S., Chen S., McKay R., Monia B. P., Bhanot S. (2005) Hepatology 42, 362–371 [DOI] [PubMed] [Google Scholar]
- 48.Raubenheimer P. J., Nyirenda M. J., Walker B. R. (2006) Diabetes 55, 2015–2020 [DOI] [PubMed] [Google Scholar]
- 49.Klein J., Köppen A., Löffelholz K. (1998) Neurochem. Int. 32, 479–485 [DOI] [PubMed] [Google Scholar]
- 50.Hartmann J., Kiewert C., Duysen E. G., Lockridge O., Klein J. (2008) Neurochem. Int. 52, 972–978 [DOI] [PubMed] [Google Scholar]
- 51.Köppen A., Klein J., Erb C., Löffelholz K. (1997) J. Pharmacol. Exp. Ther. 282, 1139–1145 [PubMed] [Google Scholar]
- 52.Cohen E. L., Wurtman R. J. (1976) Science 191, 561–562 [DOI] [PubMed] [Google Scholar]
- 53.Gautam D., Gavrilova O., Jeon J., Pack S., Jou W., Cui Y., Li J. H., Wess J. (2006) Cell Metab. 4, 363–375 [DOI] [PubMed] [Google Scholar]
- 54.Bernal-Mizrachi C., Xiaozhong L., Yin L., Knutsen R. H., Howard M. J., Arends J. J., Desantis P., Coleman T., Semenkovich C. F. (2007) Cell Metab. 5, 91–102 [DOI] [PMC free article] [PubMed] [Google Scholar]
- 55.Cansev M., Ilcol Y. O., Yilmaz M. S., Hamurtekin E., Ulus I. H. (2008) Eur. J. Pharmacol. 589, 315–322 [DOI] [PubMed] [Google Scholar]
- 56.Ilcol Y. O., Gurun M. S., Taga Y., Ulus I. H. (2003) Eur. J. Biochem. 270, 991–999 [DOI] [PubMed] [Google Scholar]
- 57.Buchman A. L., Dubin M. D., Moukarzel A. A., Jenden D. J., Roch M., Rice K. M., Gornbein J., Ament M. E. (1995) Hepatology 22, 1399–1403 [PubMed] [Google Scholar]
- 58.da Costa K. A., Kozyreva O. G., Song J., Galanko J. A., Fischer L. M., Zeisel S. H. (2006) FASEB J. 20, 1336–1344 [DOI] [PMC free article] [PubMed] [Google Scholar]
- 59.Song J., da Costa K. A., Fischer L. M., Kohlmeier M., Kwock L., Wang S., Zeisel S. H. (2005) FASEB J. 19, 1266–1271 [DOI] [PMC free article] [PubMed] [Google Scholar]
- 60.Konstantinova S. V., Tell G. S., Vollset S. E., Nygård O., Bleie Ø., Ueland P. M. (2008) J. Nutr. 138, 914–920 [DOI] [PubMed] [Google Scholar]
Associated Data
This section collects any data citations, data availability statements, or supplementary materials included in this article.
Supplementary Materials
Supplemental Data