Modulation of Neuronal Activity by Glial Cells in the Retina (original) (raw)
Abstract
Glial–neuronal communication was studied by monitoring the effect of intercellular glial Ca2+ waves on the electrical activity of neighboring neurons in the eyecup preparation of the rat. Calcium waves in astrocytes and Müller cells were initiated with a mechanical stimulus applied to the retinal surface. Changes in the light-evoked spike activity of neurons within the ganglion cell layer occurred when, and only when, these Ca2+ waves reached the neurons. Inhibition of activity was observed in 25 of 53 neurons (mean decrease in spike frequency, 28 ± 2%). Excitation occurred in another five neurons (mean increase, 27 ± 5%). Larger amplitude Ca2+ waves were associated with greater modulation of neuronal activity. Thapsigargin, which reduced the amplitude of the glial Ca2+ increases, also reduced the magnitude of neuronal modulation. Bicuculline and strychnine, inhibitory neurotransmitter antagonists, as well as 6-Nitro-7-sulphamoylbenzo[f]quinoxaline-2,3-dione (NBQX) andd(−)-2-amino-7-phosphonoheptanoic acid (D-AP7), glutamate antagonists, reduced the inhibition of neuronal activity associated with glial Ca2+ waves, suggesting that inhibition is mediated by inhibitory interneurons stimulated by glutamate release from glial cells. The results suggest that glial cells are capable of modulating the electrical activity of neurons within the retina and thus, may directly participate in information processing in the CNS.
Keywords: calcium waves, glial cells, astrocytes, Müller cells, neurons, ganglion cells, retina, modulation, glial–neuronal interaction
Intercellular Ca2+ waves have been observed in various cell types, including glial cells of the CNS (Finkbeiner, 1993). These Ca2+ waves are transient increases in intracellular Ca2+ concentration ([Ca2+]i) that propagate through networks of cells coupled together by gap junctions. They are initiated by various types of focal stimuli.
Intercellular Ca2+ waves in glial cells have been observed in a number of in vitro preparations (Finkbeiner, 1993). They have been recorded in syncytia of cultured astrocytes (Cornell-Bell et al., 1990; Charles et al., 1991; Cornell-Bell and Finkbeiner, 1991; Enkvist and McCarthy, 1992) and in glial cells of organotypic hippocampal slices (Dani et al., 1992). The waves can be initiated by mechanical stimuli or application of neurotransmitters (Finkbeiner, 1993).
Recently, we demonstrated that intercellular Ca2+waves can also be propagated through networks of glial cells in situ in the freshly isolated mammalian retina (Newman and Zahs, 1997). These waves are initiated by electrical or mechanical stimuli as well as focal application of neurotransmitters. The waves travel out concentrically across the retinal surface and travel synchronously in astrocytes and Müller cells, the two principal glial cells of the mammalian retina.
These glial Ca2+ waves could have several possible functions. The waves could serve as a signaling mechanism permitting glial cells to communicate with each other over long distances. Such communication could serve to coordinate glial cell activity. Calcium waves might also represent a mechanism by which glial cells communicate with and modulate the activity of neighboring neurons.
Support for such communication between glial cells and neurons has come from work in cell culture. When glial Ca2+ waves are initiated in co-cultures of astrocytes and neurons, increases in neuronal [Ca2+]i are seen as Ca2+ waves are propagated through the underlying glial cells (Nedergaard, 1994; Parpura et al., 1994; Hassinger et al., 1995). A fascinating record showing the electrical excitation of a neuron, initiated by a glial Ca2+ wave, has also been reported (Hassinger et al., 1995). In these cell culture experiments, glial modulation of neuronal activity is thought to be mediated by the release of glutamate from astrocytes, because glutamate antagonists block the increases in neuronal [Ca2+]i associated with the glial Ca2+ waves (Parpura et al., 1994; Hassinger et al., 1995).
The glial–neuronal signaling observed in cell culture is intriguing and suggests an important modulatory role for glial cells in the CNS. The results must be interpreted with caution, however, because cultured glial cells are known to differ from cells in situ in important respects (Barres et al., 1990; Duffy and MacVicar, 1995;Porter and McCarthy, 1995a,b). It remains to be shown that similar glial–neuronal signaling occurs in intact CNS tissue. We have examined this issue in the present work by studying glial–neuronal signaling in the freshly excised eyecup preparation of the rat. We have investigated whether the propagation of intercellular Ca2+ waves in retinal glial cells results in the modulation of the firing rate of neighboring retinal neurons. Our results suggest that glial cells can indeed modulate neuronal activity.
MATERIALS AND METHODS
Eyecup preparation. Male Long–Evans rats (250–400 gm) were deeply anesthetized with sodium pentobarbital administered intraperitoneally, and the eyes were removed. The posterior one-third of the eyes was everted over a Plexiglas dome and held in place with a stainless steel retaining ring. Most of the vitreous humor was removed by suction, and the eyecups were incubated in Calcium Green-1 AM (70 μg/ml; Molecular Probes, Eugene, OR) and pluronic acid (4.7 mg/ml) in Ringer’s solution for 35 to 60 min at 22°C. After incubation, eyecups were perfused with HCO3−-buffered Ringer’s at 24°C. The Ringer’s solution, containing 117 mm NaCl, 3 mm KCl, 2 mm CaCl2, 1 mm MgSO4, 0.5 mmNaH2PO4, 15 mm dextrose, and 26 mm NaHCO3, was equilibrated with 5% CO2 in O2, pH 7.4. In contrast to earlier experiments (Newman and Zahs, 1997), neither ATP nor glutamate was added to the Ringer’s solution to potentiate Ca2+ waves.
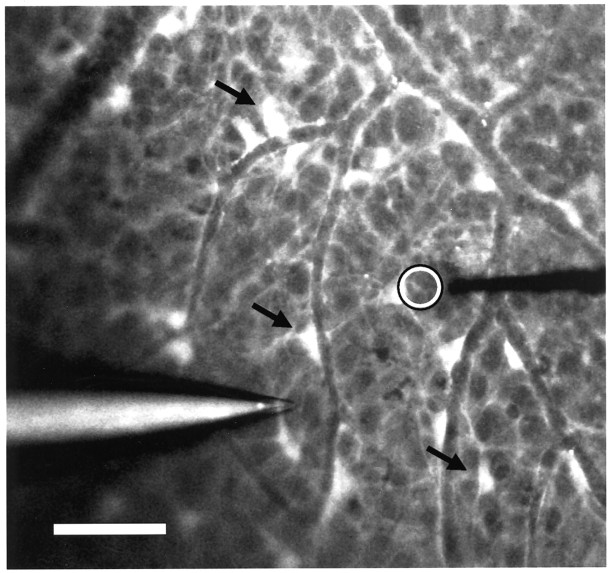
Imaging of intracellular Ca2+. Incubation of rat eyecups with Calcium Green-1 AM selectively labeled astrocytes and Müller cells but left retinal neurons essentially unlabeled (Fig. 1). Calcium Green-1-labeled cells were viewed with a video-rate Noran Odyssey Confocal scanner (Middleton, WI) and a BX60 Olympus microscope with a 20×, 0.5 numerical aperture water immersion objective. Calcium Green-1 fluorescence was monitored with 488 nm argon excitation and a 515 nm long-pass barrier filter. Averaged images (average of 16 frames) were acquired every 2.55 sec, with the laser excitation source turned on for 1.10 sec during each acquisition cycle. MetaMorph software (Universal Imaging, West Chester, PA) was used to acquire, store, and analyze images.
Fig. 1.
Confocal fluorescence image of the retinal surface of the eyecup labeled with Calcium Green-1. Astrocytes (arrows) and Müller cell endfeet (dim, diffuse fluorescence) were labeled. Calcium waves were initiated by advance of a micropipette (left). Extracellular activity of single neurons within the ganglion cell layer was recorded with a metal microelectrode (right). Calcium Green-1 fluorescence was measured within a 15 μm diameter region near the microelectrode tip (open circle). Scale bar, 50 μm.
Calcium waves were monitored to determine whether, in a particular trial, a wave reached the neuron being recorded. Calcium Green-1 fluorescence from glial cells within a circular region 15 μm in diameter, positioned just past the tip of the recording microelectrode (Fig. 1, open circle), was measured off-line. Normalized fluorescence values, the change in fluorescence divided by the baseline fluorescence (Δ_F_/F), are reported.
Neuronal recording. Extracellular recordings from neurons were made with metal-in-glass microelectrodes plated with gold and platinum (Dowben and Rose, 1953). The recordings were from cell somata, as indicated by the recorded action potential waveforms, which often displayed both axonal and somatal components. Recordings were made in the ganglion cell layer within a few micrometers of the retinal surface.
Stimulation of the retina. Glial Ca2+waves were initiated by a mechanical prodding of single glial cells at the retinal surface with the tip of a micropipette. The micropipette was advanced 15 μm for 10 msec, under the control of a piezoelectric actuator (Burleigh Instruments, Fishers, NY). The heat-sealed pipette was filled with a fluorescent dye to make it visible under confocal optics.
Neurons within the retina were stimulated by repetitive light flashes of the confocal laser excitation source. During an experimental trial, the laser was turned on for 1.10 sec every 2.55 sec. The excitation source illuminated a square region ∼300 μm on a side.
Analysis. Results are given in the form mean ± SEM (number of samples). Statistical significance between samples was assessed using the Student’s t test (unpaired samples).
RESULTS
The two principal types of macroglial cells within the mammalian retina are astrocytes and Müller cells (Ramon y Cajal, 1995). Astrocytes are confined largely to the nerve fiber layer at the inner retinal boundary, whereas radial Müller cells extend from the inner retinal surface to the photoreceptors in the outer retina. When Ca2+ waves are initiated at the retinal surface, increases in intracellular Ca2+ are observed in astrocyte somata and processes as well as in Müller cell endfeet and processes within the ganglion cell and inner plexiform layers (Newman and Zahs, 1997).
In the present study, Ca2+ waves in retinal eyecups were initiated by mechanically stimulating astrocyte somata or Müller cell endfeet. The resulting Ca2+ waves, traveling through astrocytes and Müller cells, were similar to those observed previously in the isolated retina (Newman and Zahs, 1997), although the propagation velocities were somewhat slower: 13.8 ± 0.4 μm/sec (57) compared with 23.1 μm/sec in the isolated retina (where the bathing solution was supplemented with glutamate and ATP). In the eyecup, the largest Ca2+waves attained a diameter of ∼400 μm. We studied the effect of these Ca2+ waves on neuronal activity by recording the spike activity of single neurons in the ganglion cell layer while simultaneously monitoring the propagation of glial Ca2+ waves at the retinal surface.
Light-evoked neuronal activity
More than 90% of all of the neurons recorded within the ganglion cell layer responded to flashes of light. Cells were classified into three groups according to their responses to the on and off of the light stimulus: ON, ON–OFF, and OFF cells. Peristimulus time histograms of three representative cells are illustrated in Figure2.
Fig. 2.
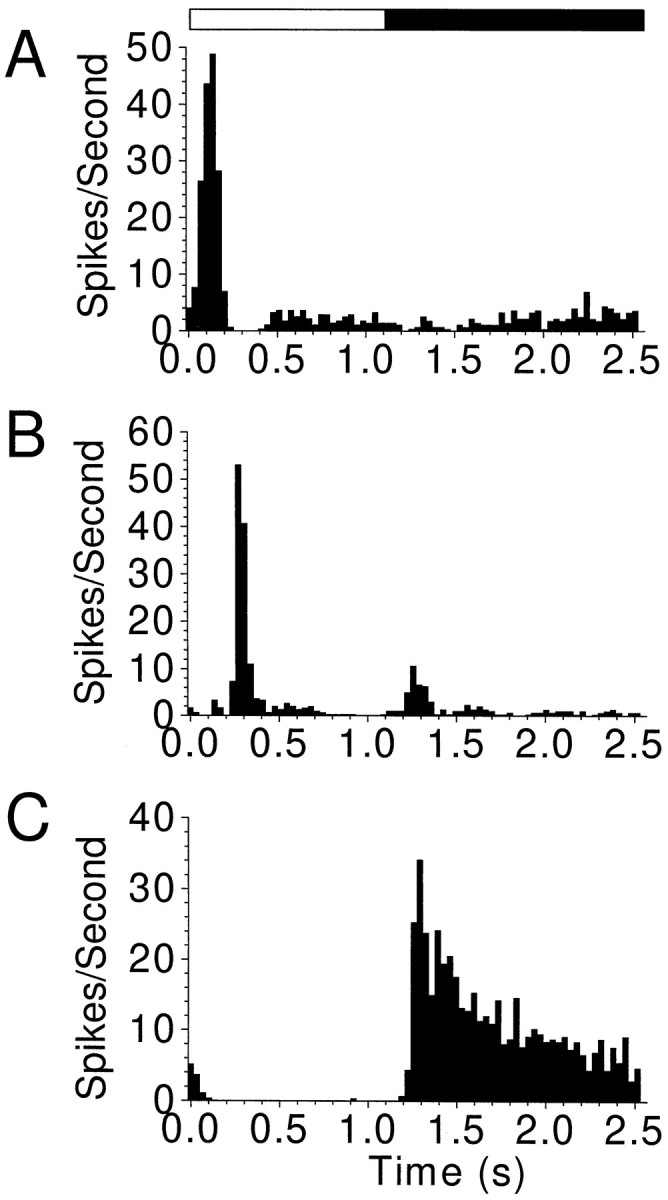
Peristimulus time histograms of the light-driven activity of an ON (A), an ON–OFF (B), and an OFF (C) neuron, each representative of one of the three response classes observed.Open and closed bars above the histograms indicate periods of light ON and OFF, respectively. Activity was recorded during control periods, before initiation of Ca2+ waves.
Modulation of neuronal activity
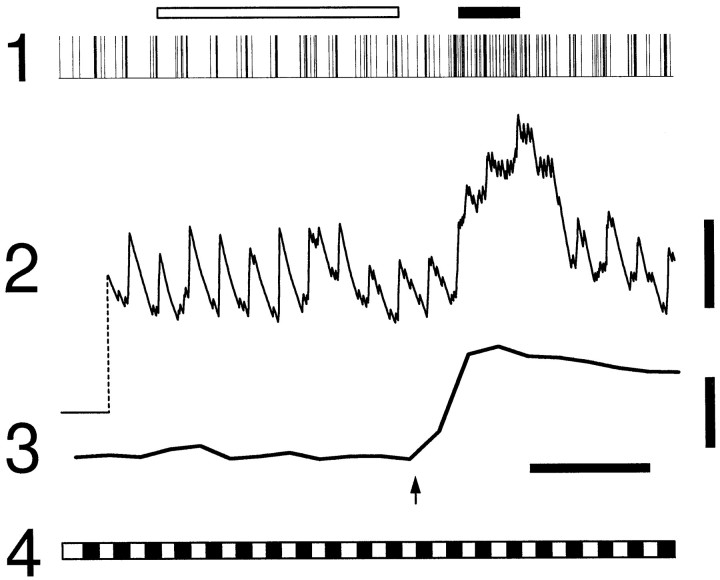
The light-evoked activity of a neuron was frequently altered when a glial Ca2+ wave traveled past the cell. One example of this change in activity is illustrated in Figure3. The activity of the neuron, an ON cell, is indicated in traces 1 and 2, and the Calcium Green-1 fluorescence within glial cells adjacent to the neuron is shown in trace 3. After a 30 sec control period, a Ca2+ wave was initiated by a mechanical stimulus (arrow). After a delay of ∼3 sec, the Ca2+ wave arrived at the neuron. An increase in the firing rate of the neuron occurred after a similar delay. A movie illustrating this experimental trial can be viewed at http://enlil.med.umn.edu/www/phsl/work/caw.htm#neuron.
Fig. 3.
Modulation of neuronal activity in an ON neuron. Cell activity is plotted as a spike display in trace 1(vertical lines represent single action potentials) and as a frequency plot in trace 2 (abscissa represents the running average of spike frequency, i.e., a leaky integrator with a linear decay to 0% at 10 sec; 0 frequency is indicated at left end of the trace). Trace 3, Calcium Green-1 fluorescence in a circular region near the recording microelectrode tip. Trace 4, light stimulus, indicating periods of light ON (open segments) and OFF (closed segments). Arrow indicates initiation of the Ca2+ wave. Open and closed bars above trace 1 indicate control and test periods, respectively, during which average spike frequency was measured. Neuron spike frequency and glial cell fluorescence increase concurrently several seconds after initiation of the glial Ca2+ wave. Calibration bars: trace 2(spike frequency), three spikes/sec; trace 3 (Calcium Green-1 fluorescence), 20% Δ_F_/F; time, 10 sec.
The majority of the neurons we monitored showed changes in their firing rate that were correlated with the arrival of glial Ca2+ waves. Modulation of the light-evoked responses of neurons, as well as neuronal spontaneous activity, was observed. The modulation was either excitatory or inhibitory, depending on the neuron being recorded.
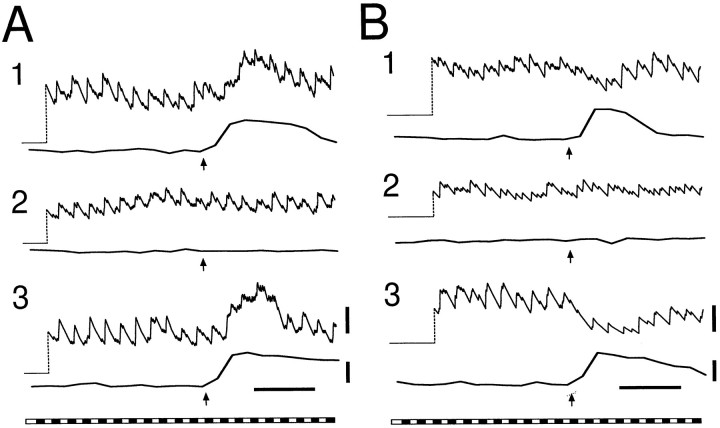
An example of excitatory modulation is illustrated in Figure4A, where records from three sequential trials in an ON neuron are shown. In all three trials, a mechanical stimulus initiated a glial Ca2+ wave. The Ca2+ wave reached the neuron in trials 1 and 3. In trial 2, the wave died out before reaching the cell. As shown in Figure 4A, the firing rate of the neuron increased in those trials when the Ca2+ wave reached the cell but remained unchanged when the wave failed to reach the cell.
Fig. 4.
Excitatory and inhibitory modulation of neuronal activity. A frequency plot of cell activity (top trace) and glial cell Calcium Green-1 fluorescence (bottom trace) are shown for each trial. A, Excitatory modulation in an ON neuron. Spike frequency increases in those trials (1 and 3) in which [Ca2+]i in neighboring glial cells also increases. B, Inhibitory modulation in an ON–OFF neuron. Spike frequency decreases when glial [Ca2+]i increases. The peristimulus time histograms of cells in A and B are shown in Figure 2, A and B, respectively. Calibration bars are the same as in Figure 3.
An example of inhibitory modulation in an ON–OFF neuron is illustrated in Figure 4B. A decrease in the firing rate of the neuron occurred when the glial Ca2+ wave reached the cell (trials 1 and 3). When a Ca2+ wave was initiated but failed to reach the cell (trial 2), the firing rate of the neuron remained unaltered.
Although changes in neuronal firing rate were associated with increases in glial Ca2+, the onset and decline of neuronal modulation did not necessarily follow the time course of changes in glial Ca2+ precisely. The neuronal firing rate sometimes recovered toward control levels even as glial Ca2+ levels remained elevated (e.g., Fig. 3).
Magnitude of neuronal modulation
Changes in the firing rate of neurons were quantified by comparing the average frequency of spike activity in a control period, before initiation of a Ca2+ wave, to activity in a test period during propagation of the wave. The control period spanned the eight on–off light cycles immediately preceding initiation of the Ca2+ wave (Fig. 3, open bar above trace 1). The test period consisted of the two light cycles centered at the peak of the Ca2+ wave (Fig. 3, closed bar). For trials in which the Ca2+ wave did not reach the neuron being monitored, the test period was determined by estimating when the wave would have arrived if it had propagated past the neuron (based on its propagation velocity). Modulation of the neuronal firing rate was expressed as the percentage change in average spike frequency:
Modulation=Freqtest period−Freqcontrol periodFreqcontrol period·100
The relation between the change in neuronal firing rate and Ca2+ levels in adjacent glial cells was analyzed for a total of 53 neurons. For each neuron tested, 9–14 trials were conducted. In some of these trials, the glial Ca2+wave propagated past the neuron (defined as a Δ_F_/F fluorescence change of >22% in the glial cells adjacent to the neuron). In other trials, a Ca2+ wave was initiated but failed to reach the neuron (Δ_F_/F < 1%). For each neuron, the average value of neuronal modulation was calculated for those trials in which the Ca2+ wave reached the cell and for those trials in which the wave failed to reach the cell.
In 30 of the 53 neurons analyzed, there was a significant difference in the modulation of spike activity when a Ca2+ wave reached the cell, compared with the modulation observed when the Ca2+ wave did not reach the cell (Table1). Twenty-five of the 53 cells showed a significant decrease in firing rate associated with the arrival of a Ca2+ wave. Modulation averaged −28 ± 2% (114 trials) in these cells. Another five cells showed a significant increase in firing rate associated with a Ca2+ wave. Modulation averaged 28 ± 5% (27 trials) in these neurons. There was no modulation of neuronal activity when a Ca2+wave failed to reach a neuron. In these trials, modulation equaled +1 ± 2% (125 trials) for the 30 cells with Ca2+ wave-associated modulation and −3 ± 1% (235 trials) for all 53 neurons analyzed.
Table 1.
Modulation of neuronal activity
| Neuronal type | ON | ON–OFF | OFF |
|---|---|---|---|
| Number of cells with significant modulation | |||
| Inhibition | 7 of 24 | 9 of 15 | 9 of 14 |
| Excitation | 5 of 24 | 0 of 15 | 0 of 14 |
| Inhibition | Excitation | Inhibition | Inhibition | |
|---|---|---|---|---|
| Magnitude of cell modulation | ||||
| No Ca2+wave_a_ | +3 ± 5% (30) | −1 ± 3% (20) | +1 ± 2% (39) | −1 ± 1% (36) |
| Large Ca2+ wave_b_ | −35 ± 3% (35) | +27 ± 5% (27) | −25 ± 3% (35) | −25 ± 2% (44) |
Examples of inhibition of spike activity were seen in all three classes of neurons, ON, ON–OFF, and OFF cells. Interestingly, enhancement of spike activity was seen only in ON neurons (Table 1). In trials when significant modulation of neuronal activity was observed, the distance between the neurons and the initiation site of the Ca2+ wave averaged 60 ± 1 μm (74). The distance exceeded 75 μm in eight trials.
Relation between Ca2+ increases and neuronal modulation
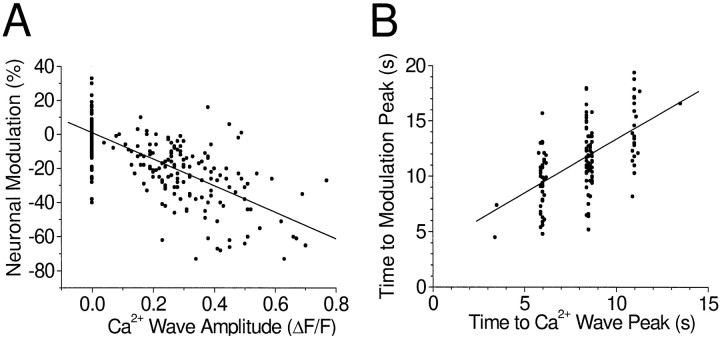
The results summarized above demonstrate that a change in neuronal firing rate is associated with the arrival of a glial Ca2+ wave at that neuron. In addition, the_magnitude_ of the change in neuronal activity was correlated with the amplitude of the Ca2+ increase. This relation was analyzed for all cells displaying significant inhibitory modulation (Fig.5A). In trials in which the amplitude of the glial [Ca2+]iincrease was 0, i.e., when the wave failed to reach the neuron, neuronal modulation was near 0. As the amplitude of the [Ca2+]i increase grew larger, the magnitude of inhibitory modulation also increased (greater negative modulation).
Fig. 5.
Correlation between neuronal modulation and Ca2+ increases. A, Relation between the magnitude of inhibition of neuronal activity and the amplitude of the Ca2+ wave. Points represent single trials from all cells showing significant inhibitory modulation.Points at the left of the plot (Δ_F_/F = 0) represent trials in which the Ca2+ wave failed to reach the neuron. Least-squares fit, _R_2 = 0.42.B, Relation between the time to the peak of neuron modulation and the time to the peak of the Ca2+wave. Trials in which the inhibition of activity was 25% or greater are included. The discrete Ca2+ wave times reflect the 2.55 sec acquisition period of fluorescence images. Least-squares fit, slope = 0.97, intercept = 3.6 sec,_R_2 = 0.30.
The timing of the modulation of neuronal activity was correlated with the timing of the Ca2+ wave as well. When the time to the peak of inhibitory modulation was plotted as a function of the time to the peak of the Ca2+ wave, a clear relation was evident (Fig. 5B). Such a relation would not exist if the mechanical stimulus used to initiate the Ca2+wave was directly modulating the activity of the neurons.
Thapsigargin and neuronal modulation
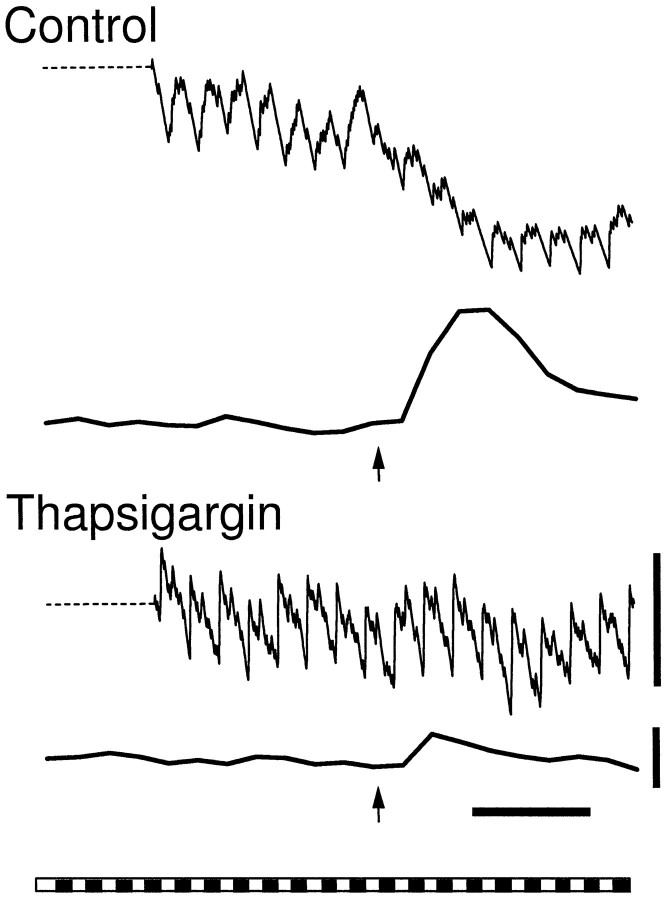
If increases in glial [Ca2+]iresult in the modulation of neuronal firing, then pharmacological manipulation of the Ca2+ increase should alter the modulation. This was tested by application of thapsigargin, a compound that depletes intracellular Ca2+ stores (Thastrup et al., 1990) and substantially reduces the magnitude of glial Ca2+ waves (Newman and Zahs, 1997). Experiments were conducted on neurons that displayed prominent inhibitory modulation associated with increases in glial [Ca2+]i. Under control conditions, the average inhibitory modulation observed in these neurons equaled −23 ± 3% (16). Modulation was reduced to −12 ± 3% (22) after 30 min exposure to 3.0 μm thapsigargin (p < 0.02) (Fig.6). In the same trials, the increase in [Ca2+]i measured in the glial cells was reduced from 28 ± 4% (Δ_F_/F) to 4 ± 1% by thapsigargin. In all trials, Ca2+ waves were initiated sufficiently close to the neuron being monitored, so that under control conditions the waves would have reached the neuron (48 ± 1 and 44 ± 1 μm from the neurons in control and test trials, respectively).
Fig. 6.
Effect of thapsigargin on the modulation of neuronal activity. Thapsigargin (3.0 μm) reduces the glial Ca2+ increase and the inhibition of activity in an OFF neuron. Calibration bars for trials in Figures 6 and 7: spike frequency, two spikes/sec; Calcium Green-1 fluorescence, 20% Δ_F_/F; time, 10 sec. A frequency plot of neuronal activity and Calcium Green-1 fluorescence are shown in each trial.
Transmitter antagonists and neuronal modulation
If glial cells cause the observed modulation of neuronal activity, it is possible that the modulation is mediated by the release of neurotransmitters from the glial cells. This appears to be the case in cell culture where Ca2+-dependent release of glutamate from glial cells has been demonstrated (Parpura et al., 1994,1995) and where neuronal [Ca2+]iincreases associated with glial Ca2+ waves are blocked by glutamate antagonists (Parpura et al., 1994; Hassinger et al., 1995). We performed a number of pharmacological experiments to investigate whether glutamate or other neurotransmitters were involved in the modulation of neuronal activity associated with glial Ca2+ waves. In these studies, only trials in which the Ca2+ wave reached the neuron being monitored were analyzed. Experiments were restricted to the characterization of inhibitory modulation, because neurons showing excitatory modulation were rarely encountered.
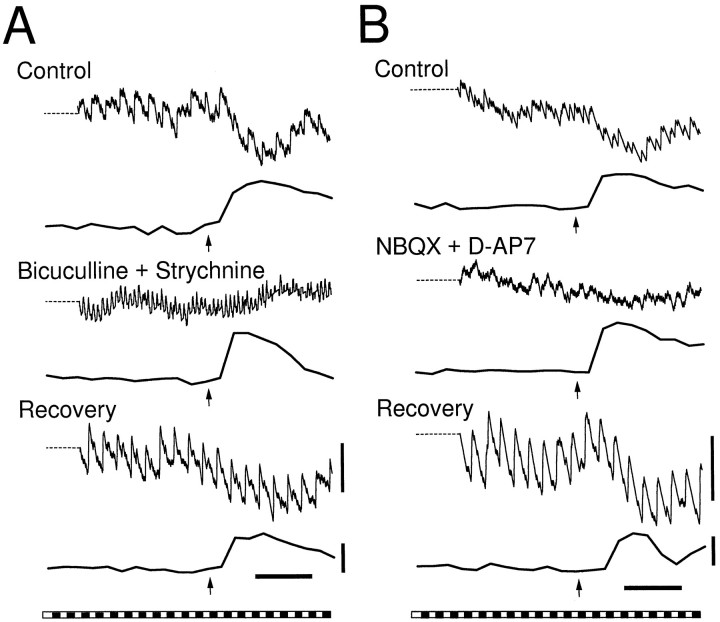
Antagonists to the inhibitory neurotransmitters GABA and glycine were both effective in reducing the inhibition of spike activity associated with glial Ca2+ waves (Table2; Fig.7A). The GABAAantagonist bicuculline (5 μm) and the glycine antagonist strychnine (1 μm) each reduced inhibitory modulation by more than half, whereas both antagonists applied together completely abolished the inhibitory modulation. The effects of both bicuculline and strychnine were largely reversible (Table 2). Neither antagonist reduced the amplitude of the Ca2+ waves.
Table 2.
Effect of neurotransmitter antagonists on the inhibitory modulation of neuronal activity
| Condition | Control | Antagonist | Recovery |
|---|---|---|---|
| Inhibitory neurotransmitter antagonists | |||
| Bicuculline (5 μm) | −31 ± 5% (15) | −13 ± 3% (17)* | −26 ± 3% (16)* |
| Strychnine (1 μm) | −28 ± 5% (20) | −8 ± 3% (17)* | −25 ± 4% (19)* |
| Bicuculline + strychnine | −28 ± 4% (28) | 0 ± 1% (23)* | −20 ± 2% (32)* |
| Glutamate antagonists | |||
| NBQX (10 μm) | −25 ± 5% (22) | −6 ± 3% (22)* | −15 ± 2% (23)* |
| D-AP7 (200 μm) | −24 ± 5% (21) | −12 ± 4% (18)** | −22 ± 5% (14) |
| NBQX + D-AP7 | −18 ± 2% (19) | −2 ± 2% (19)* | −12 ± 3% (18)* |
Fig. 7.
Effect of neurotransmitter antagonists on neuronal modulation. A, Bicuculline (5 μm) and strychnine (1 μm), applied together, abolish the inhibition of activity in an ON–OFF neuron without attenuating the glial Ca2+ increase. B, NBQX (10 μm) and D-AP7 (200 μm) together reduce the inhibition of activity in an ON–OFF neuron without reducing the glial Ca2+ increase. As illustrated, light responses of neurons often changed during drug application and recovery.
Glutamate antagonists were also effective in reducing the inhibition of spike activity associated with glial Ca2+ waves (Table 2; Fig. 7B). The AMPA antagonist NBQX (10 μm) and the NMDA antagonist D-AP7 (200 μm) both reduced the magnitude of inhibitory modulation by one-half or more, and the two antagonists applied together nearly abolished the inhibition of spike activity. The effects of the antagonists were partially reversible, and neither antagonist reduced the amplitude of the Ca2+ waves.
DISCUSSION
Glial modulation of neuronal activity
The results presented in this study suggest that the propagation of intercellular Ca2+ waves through glial cells in the retina results in the modulation of the firing rate of retinal neurons. Modulation of neuronal activity was not dependent on the initiation of a glial Ca2+ wave, per se, but rather on whether the Ca2+ wave reached the neuron. In addition, the magnitude of the modulation of neuronal activity was correlated with the amplitude of the Ca2+ increase in the glial cells adjacent to the neuron. The timing between the modulation of neuronal activity and the glial Ca2+increase was similarly related. Finally, attenuation of glial Ca2+ increases by thapsigargin resulted in a significant decrease in the magnitude of neuronal modulation. All of these findings support the hypothesis that increases in glial [Ca2+]i, or some other response associated with the propagation of Ca2+ waves through glial cells, results in the modulation of neuronal firing.
Alternative explanations of neuronal modulation
It is conceivable that a mechanism other than direct glial–neuronal communication was responsible for the observed modulation. The mechanical stimulus used to initiate glial Ca2+ waves could stimulate, in theory, the neurons being monitored and alter their firing rate. This is highly unlikely, however. Identical mechanical stimuli applied to the same retinal location had different effects on neuronal firing, depending on whether the stimulated Ca2+ wave reached the cell. In addition, direct mechanical stimulation of a neuron would have a latency of milliseconds rather than the several seconds observed.
It is possible that neuronal modulation was mediated by a signal propagated within a network of neurons. The mechanical stimulus used to initiate glial Ca2+ waves might also initiate intercellular Ca2+ waves within neurons, for instance. Such Ca2+ waves, propagated through ganglion cells and amacrine cells, have been observed in the neonatal ferret retina (Wong et al., 1995; Feller et al., 1996). This mechanism seems unlikely, however. First, it is not known whether these waves can be initiated mechanically; they occur spontaneously in the ferret retina (Wong et al., 1995). Furthermore, the mechanical stimulus used to initiate glial Ca2+ waves in our study was small in amplitude (15 μm) and was directed at individual glial cells. The stimulus would presumably be less effective in initiating Ca2+ waves in neurons lying beneath the surface. In addition, neuronal Ca2+ waves, if they were initiated, would have to mimic the glial Ca2+ waves in many respects, including their extent of travel, magnitude, and timing, to account for the observed results. The chance of this occurring in many of the trials is highly unlikely.
Identity of neurons that are modulated
The neurons recorded in this study lay just beneath the surface of the retina in the ganglion cell layer and thus were presumably ganglion cells. Their responses to light resembled those reported previously for ganglion cells in the rat (Brown and Rojas, 1965). It is possible, however, that some of these cells were displaced amacrine cells, which are prevalent in the ganglion cell layer of the rat (Perry and Walker, 1980) and generate spike responses similar to those of ganglion cells (Bloomfield, 1996).
Mechanism of modulation of neuronal activity
The following model of the inhibition of neuronal activity by glial cells is suggested by our experiments. The arrival of a Ca2+ wave in a glial cell leads to the release of glutamate from the cell and to the excitation of inhibitory interneurons. The interneurons, in turn, release GABA and glycine onto ganglion cells, leading to a decrease in their firing rate. Amacrine cells, which are stimulated by glutamate and release both GABA and glycine (Miller, 1994), are likely to be the interneurons that mediate the inhibition of ganglion cell activity.
This model is supported by our transmitter antagonist experiments as well as by the known pharmacology of retinal neurons. GABA and glycine antagonists each reduced the inhibition of neuronal activity, as they would if they interrupted the inhibitory link between amacrine cells and ganglion cells. Glutamate antagonists also reduced inhibition of ganglion cell activity, as they should if the major effect of glutamate release from glial cells is to excite amacrine cells rather than ganglion cells. (If glutamate released by glia primarily excited ganglion cells, then glutamate antagonists would _increase_rather than decrease the inhibition of ganglion cell activity.) It has been shown previously that amacrine cells possess both AMPA and NMDA receptors and that ganglion cells possess both GABAA and glycine receptors (Miller, 1994).
In cell culture, the release of glutamate from glial cells is thought to be mediated by an increase in [Ca2+]i (Parpura et al., 1994, 1995). Such a Ca2+-dependent release of glutamate may occur in the retina as well. Not only is modulation of neuronal activity associated with [Ca2+]i increases within glial cells in our experiments, but neuronal modulation is reduced when these Ca2+ increases are diminished by thapsigargin. [The thapsigargin-induced decrease in neuronal modulation (48%) was less than the observed decrease in Ca2+ wave magnitude (86%), suggesting that a Ca2+-dependent mechanism may not fully account for the results.]
The excitation of neuronal activity observed in a few of the ON cells in our experiments could arise in several ways. These neurons may be ganglion cells which receive an unusually large glutamatergic input from glial cells. Alternately, the neurons may be amacrine cells, which by our model receive excitatory glutamatergic input from glial cells.
An important feature of our model that must be explained is why glutamate released from glial cells primarily stimulates amacrine cells rather than ganglion cells. Glutamate may be released preferentially from those regions of astrocytes or Müller cells that directly contact amacrine cells, but a morphological correlate to account for this specialization is not known.
Glial Ca2+ waves in the retina travel through both astrocytes and Müller cells (Newman and Zahs, 1997). It remains to be determined which of these two types of glial cells (or both) mediated the modulation of neuronal firing.
Glial modulation of neuronal activity in vivo
Our work indicates that glial cells, when stimulated mechanically, modulate the firing rate of neurons in the retina. But do glial cells modulate neuronal activity in vivo? This remains an open question, because it is not known whether glial Ca2+waves, or other Ca2+ signals, are generated in vivo. Glial Ca2+ increases are stimulated by neuronal activity in a number of in situ preparations, however. In organotypic hippocampal slices, electrical stimulation of neuronal fiber tracts results in the initiation of intercellular Ca2+ waves in astrocytes (Dani et al., 1992). In acutely isolated hippocampal slices, electrical stimulation (Porter and McCarthy, 1996), as well as the addition of glutamatergic (Porter and McCarthy, 1995b) and purinergic (Porter and McCarthy, 1995a) agonists, leads to increases in astrocytic [Ca2+]i. Finally, in preliminary experiments on the eyecup preparation in our own laboratory, light flashes trigger transient Ca2+increases within Müller cells. These increases are as large as those observed during propagated Ca2+ waves (E. Newman, unpublished observations).
Significance of glial modulation of neuronal activity
There is growing evidence that glial cells can influence neuronal activity in a number of ways. Glial cells control neuronal excitability by regulating K+ levels (Newman, 1995) and pH (Chesler, 1990) in the extracellular space. Glial cells regulate synaptic efficacy by their active uptake of neurotransmitters (Martin, 1995) and may promote the development of functional synaptic connections between neurons (Pfrieger and Barres, 1997).
Our work provides evidence for an additional mechanism of glial control of neuronal excitability. As the studies cited above indicate, neuronal activity may stimulate Ca2+ increases within glial cells, leading to the glial release of glutamate. The resulting neuronal–glial–neuronal feedback loop could provide either a positive or negative input onto neurons and serve to reinforce or dampen neuronal activity, depending on the prominence of inhibitory interneurons in the feedback circuit. Our results, along with those of others, provide evidence that glial cells modulate neuronal activity and, as such, may directly participate in information processing in the brain.
Footnotes
This work was supported by National Institutes of Health Grants EY04077 and EY10383. We thank P. Ceelen for technical assistance, J. Gottesman for suggestions concerning data analysis, and D. A. Burkhardt and J. I. Gepner for helpful comments on this manuscript.
Correspondence should be addressed to Eric A. Newman, Department of Physiology, 6-255 Millard Hall, 435 Delaware Street SE, Minneapolis, MN 55455.
REFERENCES
- 1.Barres BA, Koroshetz WJ, Chun LLY, Corey DP. Ion channel expression by white matter glia: the type-1 astrocyte. Neuron. 1990;5:527–544. doi: 10.1016/0896-6273(90)90091-s. [DOI] [PubMed] [Google Scholar]
- 2.Bloomfield SA. Effect of spike blockade on the receptive-field size of amacrine and ganglion cells in the rabbit retina. J Neurophysiol. 1996;75:1878–1893. doi: 10.1152/jn.1996.75.5.1878. [DOI] [PubMed] [Google Scholar]
- 3.Brown JE, Rojas JA. Rat retinal ganglion cells: receptive field organization and maintained activity. J Neurophysiol. 1965;28:1073–1090. doi: 10.1152/jn.1965.28.6.1073. [DOI] [PubMed] [Google Scholar]
- 4.Charles AC, Merril JE, Dirksen ER, Sanderson MJ. Intercellular signaling in glial cells: calcium waves and oscillations in response to mechanical stimulation and glutamate. Neuron. 1991;6:983–992. doi: 10.1016/0896-6273(91)90238-u. [DOI] [PubMed] [Google Scholar]
- 5.Chesler M. The regulation and modulation of pH in the nervous system. Prog Neurobiol. 1990;34:401–427. doi: 10.1016/0301-0082(90)90034-e. [DOI] [PubMed] [Google Scholar]
- 6.Cornell-Bell AH, Finkbeiner SM. Ca2+ waves in astrocytes. Cell Calcium. 1991;12:185–204. doi: 10.1016/0143-4160(91)90020-f. [DOI] [PubMed] [Google Scholar]
- 7.Cornell-Bell AH, Finkbeiner SM, Cooper MS, Smith SJ. Glutamate induces calcium waves in cultured astrocytes: long-range glial signaling. Science. 1990;247:470–473. doi: 10.1126/science.1967852. [DOI] [PubMed] [Google Scholar]
- 8.Dani JW, Chernjavsky A, Smith SJ. Neuronal activity triggers calcium waves in hippocampal astrocyte networks. Neuron. 1992;8:429–440. doi: 10.1016/0896-6273(92)90271-e. [DOI] [PubMed] [Google Scholar]
- 9.Dowben RM, Rose JE. A metal-filled microelectrode. Science. 1953;118:22–24. doi: 10.1126/science.118.3053.22. [DOI] [PubMed] [Google Scholar]
- 10.Duffy S, MacVicar BA. Adrenergic calcium signalling in astrocyte networks within the hippocampal slice. J Neurosci. 1995;15:5535–5550. doi: 10.1523/JNEUROSCI.15-08-05535.1995. [DOI] [PMC free article] [PubMed] [Google Scholar]
- 11.Enkvist MOK, McCarthy KD. Activation of protein kinase C blocks astroglial gap junction communication and inhibits the spread of calcium waves. J Neurochem. 1992;59:519–526. doi: 10.1111/j.1471-4159.1992.tb09401.x. [DOI] [PubMed] [Google Scholar]
- 12.Feller MB, Wellis DP, Stellwagen D, Werblin FS, Shatz CJ. Requirement for cholinergic synaptic transmission in the propagation of spontaneous retinal waves. Science. 1996;272:1182–1187. doi: 10.1126/science.272.5265.1182. [DOI] [PubMed] [Google Scholar]
- 13.Finkbeiner SM. Glial calcium. Glia. 1993;9:83–104. doi: 10.1002/glia.440090202. [DOI] [PubMed] [Google Scholar]
- 14.Hassinger TD, Atkinson PB, Strecker GJ, Whalen LR, Dudek FE, Kossel AH, Kater SB. Evidence for glutamate-mediated hippocampal neurons by glial calcium waves. J Neurobiol. 1995;28:159–170. doi: 10.1002/neu.480280204. [DOI] [PubMed] [Google Scholar]
- 15.Martin DL. The role of glia in the inactivation of neurotransmitters. In: Kettenmann H, Ransom BR, editors. Neuroglia. Oxford UP; New York: 1995. pp. 732–745. [Google Scholar]
- 16.Miller RF. The physiology and morphology of the vertebrate retina. In: Ryan SJ, editor. Retina. Mosby; St. Louis: 1994. pp. 95–123. [Google Scholar]
- 17.Nedergaard M. Direct signalling from astrocytes to neurons in cultures of mammalian brain cells. Science. 1994;263:1768–1771. doi: 10.1126/science.8134839. [DOI] [PubMed] [Google Scholar]
- 18.Newman EA. Glial cell regulation of extracellular potassium. In: Kettenmann H, Ransom BR, editors. Neuroglia. Oxford UP; Oxford: 1995. pp. 717–731. [Google Scholar]
- 19.Newman EA, Zahs KR. Calcium waves in retinal glial cells. Science. 1997;275:844–847. doi: 10.1126/science.275.5301.844. [DOI] [PMC free article] [PubMed] [Google Scholar]
- 20.Parpura V, Basarsky TA, Liu F, Jeftinija K, Jeftinija S, Haydon PG. Glutamate-mediated astrocyte-neuron signalling. Nature. 1994;369:744–747. doi: 10.1038/369744a0. [DOI] [PubMed] [Google Scholar]
- 21.Parpura V, Liu F, Jeftinija KV, Haydon PG, Jeftinija SD. Neuroligand-evoked calcium-dependent release of excitatory amino acids from Schwann cells. J Neurosci. 1995;15:5831–5839. doi: 10.1523/JNEUROSCI.15-08-05831.1995. [DOI] [PMC free article] [PubMed] [Google Scholar]
- 22.Perry VH, Walker M. Amacrine cells, displaced amacrine cells and interplexiform cells in the retina of the rat. Proc R Soc Lond B Biol Sci. 1980;208:415–431. doi: 10.1098/rspb.1980.0060. [DOI] [PubMed] [Google Scholar]
- 23.Pfrieger FW, Barres BA. Synaptic efficacy enhanced by glial cells in vitro. Science. 1997;277:1684–1688. doi: 10.1126/science.277.5332.1684. [DOI] [PubMed] [Google Scholar]
- 24.Porter JT, McCarthy KD. Adenosine receptors modulate [Ca2+]i in hippocampal astrocytes in situ. J Neurochem. 1995a;65:1515–1523. doi: 10.1046/j.1471-4159.1995.65041515.x. [DOI] [PubMed] [Google Scholar]
- 25.Porter JT, McCarthy KD. GFAP-positive hippocampal astrocytes in situ respond to glutamatergic neuroligands with increases in [Ca2+]i. Glia. 1995b;13:101–112. doi: 10.1002/glia.440130204. [DOI] [PubMed] [Google Scholar]
- 26.Porter JT, McCarthy KD. Hippocampal astrocytes in situ respond to glutamate released from synaptic terminals. J Neurosci. 1996;16:5073–5081. doi: 10.1523/JNEUROSCI.16-16-05073.1996. [DOI] [PMC free article] [PubMed] [Google Scholar]
- 27.Ramon y Cajal S. Histology of the nervous system. Oxford UP; New York: 1995. [Google Scholar]
- 28.Thastrup O, Cullen PJ, Drobak BK, Hanley MR, Dawson AP. Thapsigargin, a tumor promoter, discharges intracellular Ca2+ stores by specific inhibition of the endoplasmic reticulum Ca2+-ATPase. Proc Natl Acad Sci USA. 1990;87:2466–2470. doi: 10.1073/pnas.87.7.2466. [DOI] [PMC free article] [PubMed] [Google Scholar]
- 29.Wong ROL, Chernjavsky A, Smith SJ, Shatz CJ. Early functional neural networks in the developing retina. Nature. 1995;374:716–718. doi: 10.1038/374716a0. [DOI] [PubMed] [Google Scholar]
