The Fugu tyrp1 promoter directs specific GFP expression in zebrafish: tools to study the RPE and the neural crest-derived melanophores (original) (raw)
. Author manuscript; available in PMC: 2010 Aug 12.
SUMMARY
In vertebrates, pigment cells account for a small percentage of the total cell population and they intermingle with other cell types. This makes it difficult to isolate them for analyses of their functions in the context of development. To alleviate such difficulty, we generated two stable transgenic zebrafish lines (pt101 and pt102) that express green fluorescent protein (GFP) in melanophores under the control of the 1 kb Fugu tyrp1 promoter. In pt101, GFP is expressed in both retinal pigment epithelium (RPE) cells and the neural crest-derived melanophores (NCDM), whereas in pt102, GFP is predominately expressed in the NCDM. Our results indicate that the Fugu tyrp1 promoter can direct transgene expression in a cell-type-specific manner in zebrafish. In addition, our findings provide evidence supporting differential regulations of melanin-synthesizing genes in RPE cells and the NCDM in zebrafish. Utilizing the varying GFP expression levels in these fish, we have isolated melanophores via flow cytometry and revealed the capability of sorting the NCDM from RPE cells as well. Thus, these transgenic lines are useful tools to study melanophores in zebrafish.
Keywords: tyrp1 promoter, transgenesis, RPE, neural crest-derived melanophores, pigment cells, Fugu, zebrafish
INTRODUCTION
In vertebrates, there are two classes of pigment cells. Each of them has a developmentally distinct origin. One class is derived from the neural crest. In mammals and birds, there is only one type of neural crest-derived pigment cells – melanin-containing melanocytes (del Marmol and Beermann, 1996), whereas in fish, there are up to six types of neural crest-derived pigment cells (Kelsh, 2004). In zebrafish, three types of neural crest-derived pigment cells have been identified: the black melanin-containing melanophores, the yellow pteridine-containing xanthophores, and the silvery purine-containing iridophores (Kelsh et al., 1996). The neural crest-derived pigment cells in the skin serve a variety of functions, such as camouflage, shielding from UV radiation, and communication among animals (Raible et al., 1992; Groves and Bronner-Fraser, 1999; McClure, 1999). The second class of pigment cells originates from the outer layer of the optic primordium, which itself is derived from an lateral evagination of the anterior region of the neural tube or neural keel in zebrafish (Martinez-Morales et al., 2004; Lister, 2002; Schmitt and Dowling, 1994). The outer layer of the optic primordium eventually differentiates into melanin-containing pigment cells, which constitute the monolayered retinal pigment epithelium (RPE) (Martinez-Marales et al., 2004).
The RPE is essential for proper visual function. With melanin granules, RPE absorbs stray photons that are scattered from photoreceptors and consequently increases visual acuity. The RPE is also responsible for the conversion of all-trans-retinol to 11-cis-retinal in visual cycle, the renewal of the outer segments of photoreceptors through phagocytosis, and the formation of the protective outer blood–retinal barrier between the choroid and the neural retina (Thumann and Hinton, 2001; Schraermeyer and Heimann, 1999; Boulton and Dayhaw-Barker, 2001; Rymer and Wildsoet, 2005). Growing evidence suggests that the RPE also plays an important role in the development of the neural retina. Selective ablation or removal of the RPE results in defects in cellular organization of the neural retina (Raymond and Jackson, 1995). In addition, the results of cell re-aggregation assays using avian retinal cells suggest that the RPE secretes diffusible factors that are required for proper lamination of neural retinal cells (Vollmer and Layer, 1986; Layer et al., 1998; Layer et al., 2001, Rothermel and Layer, 2001). Supporting this, the pigment epithelium-derived factor (PEDF) has been found to be required for the assembly of the photoreceptor outer segments in Xenopus (Jablonski, et al., 2000; Jablonski et al., 2001; Karakousis et al., 2001). Despite such progress, the molecular mechanisms by which the RPE influences the development of the neural retina and how such influence is regulated during development remain unclear.
To analyze the functions of pigment cells, such as the RPE functions in retinal development, it is helpful to develop a system that facilitates the isolation of pigment cells at different developmental stages. For example, we can use such a system to study the gene expression profiles of RPE cells that are isolated from animals at different ages. Current existing RPE cell lines are not suitable for this kind of research, because they do not allow the analysis of RPE functions in the context of development (Kobayashi et al., 2005; Tian et al., 2005). Thus, we set out to generate transgenic zebrafish lines that express GFP in melanophores. The GFP signal can then be utilized to isolate melanophores via flow cytometry. We chose to use the promoter of the Fugu rubripes Tyrosinase-related Protein 1 gene (tyrp1) to direct GFP expression in zebrafish because the promoter is small and has been proved to work in mouse transgenesis (Camacho-Hubner et al., 2002). In vertebrates, TYRP1, Tyrosinase, and Dopachrome tautomerase are enzymes required for melanin synthesis and are specifically expressed in melanocytes or melanophores (del Marmol and Beermann, 1996). Thus the Fugu tyrp1 promoter should give us the specificity we need to direct transgenic expression in zebrafish melanophores.
Here we report the generation of two distinct transgenic zebrafish lines that express GFP under the control of the Fugu tyrp1 promoter. One line expresses GFP in both RPE cells and the neural crest-derived melanophores (NCDM); the other line expresses GFP predominately in the NCDM. The unique GFP expression patterns of these lines shed light on the expression regulations of the melanin-producing genes. This is the first report of the generation of transgenic zebrafish lines that express GFP in melanophores under a Fugu promoter. These transgenic animals constitute useful tools to study melanophores.
RESULTS
The tyrp1 gene is conserved between Fugu and zebrafish
A prerequisite for using the Fugu tyrp1 promoter to direct GFP expression in melanophores in zebrafish is that the Fugu tyrp1 promoter must be recognized by zebrafish transcription machinery in a melanophore-specific manner. To assess the likelihood of recognition, we analyzed the conservation of the promoter regions of the zebrafish and Fugu tyrp1 genes. In order to analyze the correct zebrafish genomic DNA sequence, we first identified the zebrafish tyrp1 gene from the GenBank database. By definition, the zebrafish gene that is the most similar to the Fugu tyrp1 gene at the amino acid level should be the zebrafish tyrp1 gene. Our searches of the database revealed a zebrafish cDNA clone (accession number: AAH76406) that shows the highest similarity to the Fugu tyrp1 gene: 73% identical at the amino acid level (Fig. 1A). Because the identity between the Fugu _tyrp1_gene and the tyrp1 genes of other vertebrates, such as mouse, human, chicken, goldfish, and Xenopus, are in the range of 61 to 66% (data not shown), this high amino acid identity is in agreement with the NCBI's annotation of AAH76406 as the zebrafish tyrp1 gene.
Figure 1.

The Fugu and zebrafish tyrp1 genes are conserved. A. The zebrafish TYRP1 protein (zTYRP1) is highly similar to the Fugu TYRP1 protein (fTYRP1). The identical amino acid residues are highlighted in the darker shade and the amino acid residues that have similar chemical characteristics are indicated with the lighter shade. The two proteins are 73% identical at the amino acid level. B. The CONREAL algorithm identifies a number of potential conserved elements in the regulatory regions of the Fugu and zebrafish tyrp1 genes. The thick blue horizontal bar represents the span of the 6 kb DNA sequence that is immediately upstream of the zebrafish tryp1 gene. The thick red horizontal bar represents the span of the Fugu tyrp1 promoter. The black lines between the blue and red bars link the regions that show conservation of potential cis-elements, which are also indicated in the histogram in the box above.
We then used the amino acid sequence of the zebrafish TYRP1 protein as a query to identify the genomic coding region of the gene and its upstream regulatory area. Our search of the GenBank and Ensembl zebrafish genome databases (http://www.ensembl.org/index.html) revealed two distinct genomic contigs (BX901913 and NW651878) that presumably harbor the zebrafish tyrp1 upstream regulatory regions. To determine which one is the correct assembly of the DNA sequences in the region, we performed PCR analyses with primer pairs that span the tyrp1 coding region and the hypothetical upstream regulatory regions. Our results demonstrate that BX901913 contains the upstream regulatory region of the zebrafish tyrp1 gene (data not shown).
To analyze the conservation of the cis-elements between the 6 kb zebrafish tyrp1 promoter region and the 1 kb Fugu tyrp1 promoter, we compared the two sequences at the CONREAL (CONsered Regulatory Elements Anchored Alignment) web server. The comparison reveals the conservation of multiple potential cis-elements between the Fugu and zebrafish promoters. As expected, these potential cis-elements are more densely packed in the Fugu tyrp1 promoter (Fig. 1B). In addition, we also searched for known melanophore-specific cis-elements E-box (CATGTG) and MSE-box (GTGTGA) (Yavuzer and Goding, 1994; Goding, 2000; Murisier and Beermann, 2006). As in the Fugu tyrp1 promoter (Camacho-Hubner et al., 2002), the promoter region of the zebrafish tyrp1 gene contains a potential E-box and a potential MSE-box, located 16 bp and 1,913 bp upstream of the start codon, respectively.
Thus, we confirmed the existence of a zebrafish counterpart of the Fugu tyrp1 gene. Furthermore, we demonstrated that the regulatory regions of the two genes share regulatory cis-elements that are essential for melanophore-specific expression. This similarity suggests that the zebrafish melanophore-specific transcription machinery likely recognizes the Fugu tyrp1 promoter. Therefore the Fugu tyrp1 promoter may serve as a good promoter for melanophore-specific transgenic expression in zebrafish.
Generation of two zebrafish transgenic lines that express GFP under the control of the Fugu tyrp1 promoter
Using the Tol2-based transgenesis system (Kawakami et al., 2004), we have generated two stable transgenic zebrafish lines that express GFP under the control of the Fugu tyrp1 promoter. They are designated ftyrp1:GFPpt101 and ftyrp1:GFPpt102, pt101 and pt102 for short. Outcrossing of pt101 or pt102 heterozygous F2 fish with wildtype fish gives rise to progeny that display GFP expression in 50% of the population, suggesting that each line likely carries a single integration of the transgene. We next performed Southern Blot analysis using the Digoxigenin-labeled Fugu _tyrp1_-RNA probe (Fig. 2A) to determine the integration patterns of the transgene. The results further suggest that both lines contain a single integration of the transgene (Fig. 2B). The size difference of the transgene-containing DNA bands for pt101 and pt102 demonstrates that these two lines are distinct from each other regarding the locations of the transgene integration.
Figure 2.

The Southern Blot analysis demonstrates that the transgenic integration sites in pt101 and pt102 are different. A. A portion of the transgene construct pTol2-ftyrp1:GFP is indicated to illustrate the critical features of the transgene: ftyrp1 pro. for Fugu tyrp1 promoter, GFP for the coding region of the green fluorescent protein, SV40 polyA for SV40 mRNA polyadenylation signal, Tol2 for Tol2 transposon elements. The diagram is not drawn to the scale. EcoR I and Xho I site and the Digoxigenin-probe recognition site are indicated. B. The Southern blot: Lane 1, Markers. The molecular sizes (in base pairs) of the markers are indicated on the left. Lane 2, pTol2-ftyrp1:GFP as a positive control. Lane 3, pt101 genomic DNA. Lane 4, pt102 genomic DNA. Lane 5, pT2KXIGΔin as a negative control. Lane 6, AB wildtype genomic DNA as a negative control.
Fugu tyrp1 promoter directs specific GFP expression in the melanophores of pt101 and pt102
We next analyzed the specificity of the GFP expression directed by the Fugu tyrp1 promoter in pt101 and pt102. At 3 dpf, both pt101 and pt102 express observable GFP in the eye under fluorescence stereomicroscopes (Fig. 3. A–F). When observed laterally, the GPF signal is stronger at the boundary of the eye than in the interior (Fig. 3. D and E, arrows). This unique geometrical distribution of GFP signal suggests that the GFP signal comes from RPE cells because the RPE is positioned distal to the neural retina in the eye cup. The RPE localization of GFP is further confirmed by a confocal immunohistochemical analysis (Fig. 3. G–L). Outside of the eyes in pt101 and pt102, GFP is expressed in all NCDM but not in other cell types such as the neural crest-derived xanthophores and iridophores (Fig. 4; data not shown). Thus, the Fugu tyrp1 promoter can be specifically recognized in zebrafish and it directs expression of GFP in the RPE and the NCDM in pt101 and pt102.
Figure 3.

The Fugu tyrp1 promoter directs GFP expression in RPE cells in pt101 and pt102. A—F. The lateral views of the eyes of pt101, pt102, and wildtype under a fluorescence stereomicroscope at 72 hpf. A—C are images taken in bright field and D—F are their respectively corresponding images in GFP fluorescence field. Arrows indicate the stronger GFP appearance at the boundary regions of the eyes. Arrowheads indicate what is likely to be choroidal melanophores adjacent to the RPE. G—I. In pt101, GFP signal in the eye (G, arrow) colocalizes with RPE specific marker zpr2 (H, arrow) at 5 dpf. I is the merged image of G and H. The arrowhead in I indicates the choroidal melanophores. J—L. In pt102, the weak GFP expression (J, arrow) in the eye also localizes to the zpr2-stained RPE (K). L is the merged image of J and K.
Figure 4.

Partial recovery of melanin reveals that the Fugu tyrp1 promoter drives GFP expression in the neural crest-derived melanophores but neither in xanthophores nor in iridophores in pt101. A–C. GFP is only expressed in the skin cells that contain melanin at 6 dpf (B, green, arrows) but not in yellow appearing xanthophores (arrowheads). C is the merged image of A and B. The bright field image was taken with transmission light. D–F. GFP is not expressed in silvery iridophores (arrowheads) but in melanophores (arrows) at 6 dpf. F is the merged image of D and E. The bright field image was taken with incident light to visualize iridophores. G–I. GFP (H) colocalizes to all melanin-containing NCDM (G) that are extensively distributed in the flat tail region at 72 hpf. The arrows indicate the same distribution patterns of GFP signal and melanin in two examples of the NCDM. I is the merged image of G and H. J–O. To determine if weak expression of GFP occurs in xanthophores and iridophores in the transgenic fish, we took fluorescence images of 6 dpf wildtype (J–L) and pt101 (M–O) larvae at a longer exposure time that allowed the recording of the weak autofluorescence in the wildtype. Compared to fluorescence signal in wildtype fish, no elevation of green fluorescence was observed in pt101 for both xanthophores (arrows) and iridophores (arrowheads), supporting the notion that no detectable GFP is being expressed in these two cell populations. J and M are the bright field images with incident light illumination. K and N are the fluorescence images. L and O are the merged images of the bright field and fluorescence images. The scale bars represent 70 μm.
The tempo-spatial expression patterns of GFP in pt101 and pt102
While GFP is specifically expressed in melanophores in pt101 and pt102, its expression levels vary according to cell types and fish lines. First, the GFP expression in the RPE of pt101 is much stronger than that of pt102 (Fig. 3. arrows in D vs. arrows in E; G vs. J). The relative GFP signal intensities in the RPE show a 20- to 30-fold difference between pt101 and pt102 at 36 hpf, 48 hpf, and 72 hpf (Fig.5. B). In addition, the GFP signal in the RPE of pt101 appears as early as 19.5 hfp, even though weak; whereas at the same developmental stages and in the same regions, no GFP signal can be detected in pt102 and wildtype embryos (Fig.6. arrow1 and arrow2). The timeline of GFP expression in pt101 is similar to that of zebrafish tyrp1 gene expression in zebrafish as confirmed by in situ hybridization (Fig. 7), suggesting that the GFP expression in pt101 coincides with the activation of endogenous tyrp1 gene. The in situ analysis also confirms that the cause of the variation in GFP fluorescence between the RPE and NCDM in pt102 is at the mRNA level (Fig.7). Interestingly, in pt102, the GFP transgene expression is turned on late in the NCDM compared to pt101 (Fig. 7.).
Figure 5.
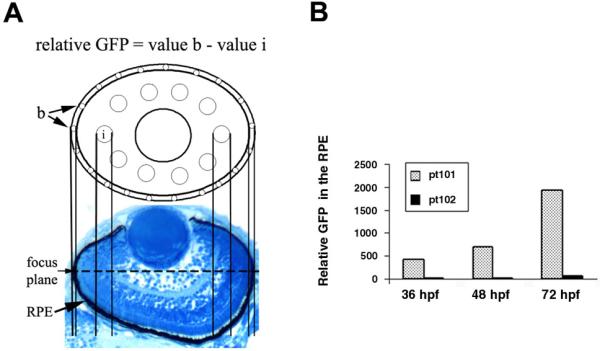
GFP expression in the RPE in pt101 is much stronger than that in pt102. A. A picture of a histological section of the zebrafish retina at 3 dpf shows the geometric contour of the RPE. The diagram on top illustrates the areas where the average pixel values of fluorescence signal were measured: Areas b represent the boundary region of the eye (about 7.2 μm in diameter); areas i represent the interior of the eye (about 18 μm in diameter). The microscopic focus plane for photographing is indicated with the dashed line. For detailed explanation of how relative GFP signal is determined, see Methods and Materials. B. The relative GFP intensity in the RPE increases during development in both pt101 and pt102. However, at 36 hpf, 48 hpf, and 72 hpf, the GFP signal in pt101 is about 27-, 20-, and 37-fold higher than that in pt102, respectively.
Figure 6.

GFP expression profiles in pt101 and pt102 between 12 hpf and 48 hpf. The embryos are treated with PTU to block melanin pigmentation so that GFP signal can be visualized. Pictures of wildtype embryos were also taken as controls for bright field and fluorescence field imaging. Arrow1 and arrow2 indicate the weak GFP expression in the eye in pt101 at early developmental stages; no GFP signal can be detected in wildtype and pt102 in the same areas at the same developmental stages. Arrow 3 and arrow4 indicates the early expression of GFP in the NCDM that are located behind the ear (black arrowheads). All fluorescence images were taken at the same photographing setting. Insets 1, 2, 3, and 4 are the close-up images of the regions indicated by arrows 1, 2, 3, and 4, respectively. White arrowheads in the insets indicate the GFP fluorescence in the eye or the NCDM.
Figure 7.

in situ hybridization analysis confirms that the differential GFP expression between pt101 and pt102 occurs at the mRNA level. A. The mRNA expression patterns of the GFP transgene in pt101 and pt102 and of the zebrafish tyrp1 gene in the wildtype at different developmental stages confirm that the GFP expression in pt101 is similar to that of the endogenous tyrp1 gene; whereas, in pt102, the GFP mRNA expression is dramatically reduced in the RPE (arrow). B. Three control hybridizations verified that the in situ signals shown in A are specific: GFP anti-sense probe for wildtype fish, GFP sense probe for pt101, and tyrp1 sense probe for wildtype fish. All embryos were treated with PTU to block melanin formation.
Second, the GFP expression in the NCDM is much stronger than that in the RPE in these two lines. This difference is demonstrated by the dramatic contrast of GFP signal intensities between RPE cells (Fig. 3. D and E, arrows) and what is likely to be choroidal melanophores that are adjacent to the RPE (Fig. 3 D, E, and I, arrowheads; Fig. 6. pt101, 48 hpf).
Third, the level of GFP expression in the NCDM in pt101 is slightly stronger than that in pt102 (Fig.6. 24 hpf and 48 hpf). Due to the irregularities of cell shapes and GFP intensities in the NCDM (Fig. 4. H), it is impossible to determine the ratio of fluorescence intensities as accurately as we did for the RPE between the two lines. Nevertheless, by comparing the overall GFP appearances in photographs that were taken at a spectrum of exposure time, we estimate that the GFP signal of the NCDM in pt101 is about twice as strong as that in pt102 (Fig. 6, and data not shown). This difference in GFP expression in the NCDM between the two lines is 10- to 18-fold smaller than that in the RPE. However, in both lines, the earliest detectable NCDM GFP is observed in the cells behind the ear, suggesting the spatial expression patterns of GFP in the NCDM are the same for the two lines (Fig. 6. arrow 3 and arrows 4; Fig. 7.).
Thus, even under the control of the same Fugu tyrp1 promoter, the expression level of GFP varies between RPE cells and the NCDM as well as between the two transgenic lines.
Isolation of melanophores via flow cytometry
The above findings demonstrate that GFP expression in pt101 and pt102 serves as a good reporter for melanophores. This live reporter allows the possibilities of studying melanophores with advanced technologies, such as flow cytometry and live imaging. To determine the feasibility of isolating melanophores from these transgenic fish, we digested 5-dpf embryos into suspensions of single cells and processed with flow cytometric analysis. The results show that GFP positive cells are easily distinguishable from non-GFP cells by the levels of fluorescence (Fig.8. A–C). Using a two-step sequential sorting procedure, we isolated GFP cells from both pt101 and pt102. Both the cytometric counting procedure and our confocal colocalization analysis (using the nuclear staining dye TO-PRO-1 to illustrate the entire isolated cell population) indicated that GFP cells account for over 80% of the isolated cells in pt101 and 70% in pt102. This is an over 800 fold enrichment compared to the percentage of the GFP positive cells in the initial cell suspension before sorting (data not shown). The majority of the isolated cells display a continuous cell membrane border and a distinct nuclear structure, indicating that the integrity of the isolated cells was maintained during the isolation (Fig. 8. M–O, and data not shown). The percentage of GFP positive cells increases only minimally between the first and second sortings. This suggests that the percentage of GFP positive cells has reached the maximum in such a case possibly because of the low percentage of GFP positive cells in the embryos or the level of GFP expression. The authenticity of the GFP signal in isolated cells was confirmed with an immunohistochemical colocalization analysis using anti-GFP antibodies (Fig. 8. J–L, and data not shown). In addition, we confirmed that the isolated GFP cells from pt101 are composed of both RPE cells and the NCDM (Fig. 8. D–F), with RPE positive cells accounting for 12% of the total GFP cells. On the contrary, no GFP cells isolated from pt102 display apparent zrp2 immunoreactivity, suggesting that GFP cells isolated from pt102 were all NCDM. The earliest developmental stage at which we can isolate GFP cells from these fish is 3 dpf (data not shown). Thus, the GFP signal in pt101 and pt102 allows us to dramatically enrich RPE cells and the NCDM. Furthermore, the differential GFP expression levels in pt101 and pt102 allow us to separate the NCDM from the RPE cells.
Figure 8.

GFP positive melanophores are detected and isolated from the ftyrp1:GFP transgenic zebrafish via flow cytometry. A–C. Histograms of the spectra of fluorescence intensities of the dissociated cells of wildtype (A), pt101 (B) and pt102 (C) illustrate that GFP cells can be detected by the flow cytometer. An arbitrary fluorescence intensity threshold is indicated with arrows; above the threshold, no wildtype cells are detected. The weak fluorescence below the threshold is mainly contributed by background noise. In pt101 and pt102, GFP cells display high fluorescence intensities (B and C, brackets). D–F. The confocal immunohistochemical analysis reveals that GFP cells isolated from pt101 are composed of RPE cells (arrowheads) and the NCDM (arrows). The NCDM are positive for GFP only; whereas RPE cells are positive for both GFP and the RPE marker zpr2. Of the 242 GFP cells analyzed, 12% are zpr2 positive. G–I. On the contrary, none of the 152 analyzed GFP cells that were isolated from pt102 at 5 dpf displayed apparent zpr2 signal. J–L. Immunostaining of the isolated pt102 GFP cells with anti-GFP antibodies (red) confirms that the green fluorescence is indeed derived from GFP expression. M–O. The integrity of the isolated pt102 GFP positive cells is largely maintained, as demonstrated by the DIC image (O) that shows a continuous cell membrane boundary and a distinct nuclear structure. The presence of the nuclei was also confirmed by the nuclear staining with TO-PRO-1 (N).
DISCUSSION
We have generated two transgenic zebrafish lines that express GFP in melanophores under the control of the Fugu tyrp1 promoter. Detailed analyses of the GFP expression patterns in these two lines reveal evidence for differential regulations of melanin synthesis in RPE cells and the NCDM in zebrafish. These two transgenic lines constitute useful tools to study the biology of melanophores in zebrafish.
Fugu promoters for transgenesis in zebrafish
Transgenic animals are great tools to study gene functions in vivo. One prerequisite for generating transgenic animal models is to have suitable promoters to direct the expression of transgenes in tissue- or cell-specific patterns. In most higher eukaryotic systems, the regulatory cis-elements are frequently spread over very large genomic regions. This causes problems in identifying and isolating specific promoters, let alone using them for transgenesis. Fortunately, this difficulty is being greatly alleviated by the discovery of the compaction of the Fugu genome, which is six times smaller than the mouse genome and four times smaller than zebrafish (Waterston et al., 2002; Crollius and Weissenbach, 2005; Brenner et al., 1993; and Ensemble database http://www.ensembl.org/index.html). This unique feature makes Fugu a valuable system for comparative genomics to identify the regulatory elements of vertebrate genes (Venkatesh and Yap 2004; Venkatesh et al., 2000). Furthermore, because of the smaller sizes, the Fugu promoters can be easily isolated and used for transgenesis in other vertebrate hosts. This application has been demonstrated practical in mice and frogs, thanks to the conservation of regulatory elements in vertebrates (Camacho-Hubner et al., 2000; Camcho-Hubner et al., 2002; Ventatesh et al., 1997; Santagati et al., 2003; Kimura-Yoshida et al., 2004). Here, our finding that the 1 kb Fugu tyrp1 promoter can direct specific GFP expression in zebrafish is encouraging in that it suggests that other Fugu promoters might also be suitable for transgenesis in zebrafish.
Differential regulation of melanin synthesis in two types of melanophores
Our findings that GFP expression level varies in different transgenic zebrafish lines and in different types of melanophores suggest interesting aspects of the regulation of melanin-producing genes in zebrafish.
First, the observation of stronger GFP expression in the NCDM than in RPE cells of either pt101 or pt102 suggests that the 1 kb Fugu tyrp1 promoter is not being equally activated in RPE cells and the NCDM. Because the transgene has the identical promoter in both cell types, this difference in expression level is likely due to the differential activation of transcription, as shown by in situ hybridization analysis (Fig.7). The cause of differential transcription can be attributed to cis-factors and/or trans-factors. From the trans-factor standpoint, tissue specific transcription factors might play a role in causing the difference in expression. In fact, it has been found that isoforms of the Microphthalmia-associated transcription factor (Mitf) are expressed in tissue specific manners in zebrafish: in the RPE, mitfa and mitfb are both expressed; whereas in the NCDM, only mitfa is expressed (Lister et al., 2001). Mitf isoforms are transcription factors required to activate the expression of melanin-producing genes (Bentley et al., 1994; Hemesath et al., 1994; Yasumoto et al., 1997; Rawls et al., 2001). In addition, other tissue specific transcription factors have been found to be involved in regulating pigmentation as well. In the RPE, Otx2 cooperates with Mitf in regulating RPE development and pigmentation (Martenez-Morales et al., 2003, Martinez-Morales et al., 2001); whereas in the NCDM, transcription factors Sox10 and Pax3 regulate the expression of Mitf-M (Watanabe et al., 1998; Potterf et a., 2000). However, because there is no apparent difference in the level of melanin pigmentation between the RPE and the NCDM in wildtype zebrafish embryos, the difference in transcription machineries between the two types of melanophores should not be sufficient by itself to cause the difference in GFP expression. Considering cis-regulatory elements, it is, however, possible that the 1 kb Fugu tyrp1 promoter lacks some cis-elements that are preferentially recognized by RPE-specific transcription machinery. This is likely the root cause of the differential GFP expression between the two types of melanophores. Of course, in order for this cause to take effect, tissue specific transcription machineries must play an essential role as well. This cell-type-specific differential expression level of GFP is reminiscent of what is seen in transgenic mice, where tyrp1 promoter sequences only direct transgenic lac Z reporter gene expression in the RPE (Murisier and Beermann, 2006; Raymond and Jackson, 1995; Schmidt et al., 1999), suggesting melanocyte expression requires additional distal regulatory elements (Murisier et al., 2005). Taken together, the differential expression levels of transgenes between RPE cells and the NCDM in both mice and zebrafish could indicate the existence of separate cis-elements in vertebrate tyrp1 genes that mediate expression in the RPE or the NCDM.
Second, the observation of the dramatic difference in GFP intensity between pt101 and pt102 in the RPE but not in the NCDM suggests that the positional effects of transgenesis could differentially influence the transgene expression in the RPE or NCDM in these two fish lines, causing much stronger reduction of GFP transcription in the RPE than in the NCDM in pt102. This biased positional effects correlate with the fact that different sets of transcription machinery exist in the RPE and the NCDM.
While our current study can not determine unequivocally to what extents cis-elements, trans-factors, positional effects, or any complex combinations among the three contribute to the variation of GFP expression in these transgenic lines, our findings do support the notion that the tyrp1 gene and likely other melanin-synthesizing genes are regulated differentially between RPE cells and the NCDM.
Applications of pt101 and pt102 for future study of melanophores
The two transgenic fish lines we generated here are useful tools to study the biology of melanophores in zebrafish. As shown above, we have successfully used GFP as a reporter to isolate melanophores from these transgenic fish. This capability will allow us to isolate melanophores at different developmental stages and analyze the gene expression profiles in the context of development. Furthermore, because pt102 expresses an extremely low level of GFP in the RPE, we can isolate the NCDM from pt102 by adjusting the threshold of fluorescence intensity of the flow cytometer to prevent RPE cells from being isolated. Comparisons of gene expression profiles at different developmental stages between pt101 melanophores and pt102 NCDM will likely reveal genes that are developmentally regulated in the RPE and the NCDM. Such comparisons may be extremely informative. For example, if certain RPE genes participate in the regulation of the early development of the neural retina, candidates of these genes might be identified via such comparisons. The feasibility of such utilities of pt101 and pt102 is supported by a recent study, in which the gene expression profiles of melanocyte stem cells can be analyzed using a GFP transgenic mouse line (Osawa et al., 2005). Last but not least, the labeling of melanophores with GFP enables us to make live observations of the dynamic features of the NCDM during development. Thus, with the unique advantages of zebrafish as a vertebrate model system, such as optic transparency, fast development, and the possibility of embryonic manipulations of tissues and cells, pt101 and pt102 will serve as great tools for future study of melanophores in zebrafish.
MATERIALS AND METHODS
Computational sequence searches and comparisons
To identify the zebrafish ortholog of the Fugu tyrp1 gene, we searched the GenBank with the key word `zebrafish tyrp1' and searched the Sanger zebrafish database with the Fugu TYRP1 amino acid sequence as a query using the BLAST program. The zebrafish tyrp1 genomic region was identified by BLAST searching of zebrafish fish database using zebrafish and Fugu amino acid sequences as queries. The similarities among the amino acid sequences of TYRP1 proteins of Fugu and other vertebrates were determined with Vector NTI 8.0 and NCBI bl2seq. We utilized the CONREAL (CONsered Regulatory Elements Anchored Alignment) web server (http://conreal.niob.knaw.nl/) at their default settings to compare the 1 kb Fugu tyrp1 promoter with the 6 kb genomic DNA sequence that is upstream of the zebrafish tyrp1 coding region.
Transgenic construct and transgenesis
To generate transgenic zebrafish that express GFP in melanophores, we used the Fugu tyrp1 promoter to drive GFP expression. The 1, 035 bp Fugu tyrp1 promoter was amplified from plasmid pF11.5XS/T7 (Camacho-Hubner, et al., 2002) by PCR using primers that are flanked by a Xho I or EcoR I site (5'gccctcgagttcgaatgatcgtggaacacatgt3' and 5'cgaattcttcgaaggctggaagttggggtaa3'). The DNA fragment amplified by PCR was then used to replace the EF1α promoter in pT2KXIGΔin via a double digestion with Xho I and EcoR I followed by re-ligation. pT2KXIGΔin is a version of the Tol2 transposon-based transgenesis system, which contains the EF1 promoter followed by the GFP open reading frame (Kawakami et al., 2004). The resulting plasmid is designated pTol2-ftyrp1:GFP, in which the ftyrp1:GFP transgene is flanked by the Tol2 transposon elements (Fig. 2A). 10–20 pg of pTol2-ftyrp1:GFP along with 25–50 pg of Tol2 transposase mRNA were co-injected into individual wildtype zebrafish AB strain embryos at 1-4-cell-stages. The Tol2 transposase mRNA was transcribed from pCS-TP (Kawakami et al., 2004) in vitro using the mMESSAGE mMACHINE kit (Ambion). The Tol2 transposase that is translated from the injected Tol2 transposase mRNA serves to integrate the transgene into the zebrafish genome.
Breeding of stable transgenic zebrafish lines
To raise stable transgenic lines, the embryos that were injected with the transgene construct were raised to adulthood as founder fish. The founders were outcrossed with wildtype AB strain. Their progeny were raised in E3 egg water in the presence of 0.003% 1-phenyl-2-thiourea (PTU) until 5 dpf (day post fertilization). PTU was used to block melanin formation so that the GFP fluorescent signal would not be blocked. The resulting GFP-expressing progeny (F1 generation) were raised to adulthood. Adult F1 fish were outcrossed again with wildtype AB fish. GFP-expressing F2 adult individuals were outcrossed with the wildtype to screen for F2 individuals that produce GFP-positive embryos in 50% of their progeny. The GFP positive F3 embryos were used for analyzing GFP expression patterns. The GFP positive F3 adult fish were subsequently incrossed to establish homozygous transgenic lines.
Southern blot analysis
To analyze the genomic integration of the transgene in pt101 and pt102, we performed a Southern blot analysis according to “Molecular Cloning” (Sambrook and Russell, 2001). Specifically, pt101, pt102, and AB wildtype embryos were collected at 5 dpf. One gram embryos of each type were incubated with a lysis buffer (0.2M Tris pH 8.0, 1% SDS, 1 mg/ml proteinase K, 0.1M EDTA) at 52°C overnight with gentle agitation. Phenolchloroform extraction was performed twice to remove residual polypeptides. Genomic DNA samples were precipitated with ethanol and re-dissolved with water at 1 μg/μl. 10 μg genomic DNA of individual lines was digested with EcoR I and separated by electrophoresis on a 0.7% agarose gel. The following controls were also included in the gel electrophoresis: Digoxigenin-labeled DNA Marker VII (Roche Applied Science) for molecular size control, 0.5 ng of EcoR I-linearized pTol2-ftyrp1:GFP as a positive control for the Fugu tyrp1 promoter, and 0.5 ng of XhoI-linearized pT2KXIGΔin as a negative control. After electrophoresis, DNA molecules were transferred from the gel to a nylon membrane (Roche Applied Science) via downward capillary action. The nylon membrane was then radiated with ultraviolet light in a UV Stratalink 2400 (StrataGene) to crosslink DNA molecules to the membrane. The membrane was then incubated with a blocking buffer (50% formamide, 5× SSC, 1.5 mg/ml tRNA, 0.1% BSA, 1% SDS) for three hours at 60 °C and then hybridized with 200ng/ml digoxigenin-labeled Fugu _tyrp1_-RNA probe at 60 °C overnight. The Digoxigenin-RNA probe was synthesized with digoxigenin labeled NTP and RNA polymerase (Roche Applied Science) via in vitro transcription using a Fugu tyrp1 promoter-containing pCR4-TOPO plasmid as the template. After hybridization, the membrane was washed twice with 2× SSC plus 0.1% SDS for 20 minutes at room temperature and twice with 0.5× SSC plus 0.1% SDS for 20 minutes at 65 °C to remove excess probe. The membrane was then blocked with 1× PBS, 2 mg/ml BSA, 1.2% sheep serum, and 1% Tween-20 followed by a incubation with alkaline phosphatase-conjugated sheep anti-Digoxigenin antibody (Roche Applied Science; 1:3000 dilution). The membrane was then washed with 1× PBS, 0.1% Tween-20 again, equilibrated with freshly made NTMT buffer (0.1M Tris-HCl, pH9.5, 50mM MgCl2, 100mM NaCl, and 0.1% Tween-20) and incubated with alkaline phosphatase substrates NBT and BCIP (Sigma) for colorization. Color developing was terminated with a stop solution (1× PBS, 1 mM EDTA, pH 5.5).
Histochemistry
To determine if GFP is expressed in the RPE of the transgenic fish, we performed confocal immunohistochemical analysis. Specifically, 5-dpf F3 embryos were fixed with 4% paraformaldehyde in 1× PBS for two hours at room temperature or overnight at 4 °C. Fixed embryos were infiltrated with 40% sucrose in 1× PBS at room temperature for 2 hours, embedded in Tissue Freezing Medium (Triangle Biomedical Sciences), and cryosectioned at 20 μm thickness. The cryosections or isolated single cells (see the section of flow cytometry for details) were washed with 1× PBS and incubated with a blocking buffer (1× PBS, 2% BSA, and 0.5% Triton X-100) for 40 minutes at room temperature. The samples were incubated with the RPE marker mouse anti-zpr2 antibodies (Developmental Studies Hybridoma Bank; 1:100 dilution in the blocking buffer) overnight at 4 °C. After four washes with the washing buffer (1×PBS containing 0.5% Triton X-100) at room temperature for 10 minutes each, the samples were incubated with Cy3-conjugated goat anti-mouse IgG secondary antibodies (Jackson ImmunoResearch Laboratories, INC). The samples were then washed four times, mounted in mounting medium (Vector), and sealed under coverslips with nailpolish. Immunostained samples were observed and photographed under a BioRad MRC1024 laser scanning confocal microscope or a Nikon Eclipse TE2000-E fluorescence microscope for DIC imaging.
To determine if GFP-expressing cells in the skin are melanophores, we performed in vivo colocalization analysis of GFP and melanin. F3 transgenic embryos were incubated with 0.003% PTU to inhibit the synthesis of melanin. PTU was then removed 24 hours prior to colocalization analysis to allow partial recovery of melanin. This treatment allows the simultaneous visualization of melanin and GFP at 72 hpf (or 144 hpf) under a Leica FluoIII™ stereofluorecence microscope.
In situ hybridization
To analyze the mRNA expression patterns of GFP and the zebrafish typr1 genes, we performed in situ hybridization analysis on embryos that were treated with 0.003% PTU from 14 hpf on. Embryos were fixed at desired developmental stages with 4% paraformaldehyde overnight at 4 °C. Fixed embryos were dehydrated with a series of PBS/methanol solutions, followed by a treatment with 100% acetone for 8 minutes at −20 °C, and stored in 100% methanol at −20 °C. Before the hybridization with RNA probes, the embryos were rehydrated with a series of methanol/PBST (1 × PBS plus 0.1% Tween-20) washes and treated with 1 μg/ml proteinase K for 3 mintues for 24 hpf embryos, and 6.5 minutes for 2 dpf embryos. No proteinase K treatment was performed for embryos younger than 24 hpf. The proteinase K-treated embryos were fixed again with 4% paraformaldehyde for 20 minutes at room temperature and washed with PBS. Following a 2-hour pre-incubation with a hybridization buffer (50% formamide, 5× SSC, 500 μg/ml yeast tRNA, 50μg/ml heparin, 0.1% Tween-20, 10 mM Citric acid, pH 6.0) at 70 °C, embryos were hybridized with proper Digoxigenin-probes at 0.5 ng/μl in the hybridization buffer at 70 °C overnight. After hybridization, excess probes were washed away with a series of SSC buffers plus 0.3% of CHAPS (Sigma). Embryos were equilibrated in PBST (1 × PBS plus 0.1% Tween-20), blocked with a blocking buffer (1.2% sheep serum and 2% BSA in PBST) at room temperature for 2 hours, and then incubated with the sheep alkaline phosphatase conjugated anti-digoxigenin antibodies (Roche; 1:5000 in the blocking buffer) overnight at 4 °C. Excess antibodies were removed by washing with PBST at 4 °C overnight. Embryos were then equilibrated with the NTMT buffer (0.1 M Tris-HCl, 50 mM MgCl2, 100 mM NaCl, 0.1% Tween-20, pH 9.5) and treated with NBT (0.338 mg/ml) and BCIP (0.175mg/ml) for color developing. Stained embryos were infiltrated with 100% glycerol and photographed under a stereomicroscope.
For making digoxigenin-RNA probes for the zebrafish tyrp1 gene, we first performed PCR and amplified the exon 1 and exon 2 of the tyrp1 gene from the zebrafish genomic DNA using two primer pairs: ctcgaagcttatgtggaagagtgtgtgtttagtgc / ctgcatgatgttacggcgcacccacggtgattctctgatcacag and gtgatcagagaatcaccgtgggtgtgcgccgtaacatcatgcagatgt / catggatcctgtctctctccagttgcagaaggtg. The two PCR products were joined together by performing another PCR reaction with primer pair ctcgaagcttatgtggaagagtgtgtgtttagtgc / catggatcctgtctctctccagttgcagaaggtg and cloned into the pDrive plasmid (Qiagen). For making digoxigenin-RNA probes for GFP, we cloned the GFP coding region into the pDrive plasmid. Digoxigenin-labeled RNA probes were transcribed with T7 or SP6 RNA polymerase from linearized proper constructs using the Roche in vitro digoxigenin labeling kit (Roche). After the synthesis of the digoxigenin-RNA probes, the DNA templates were removed via DNase I digestion. RNA probes were precipitated with ethanol and dissolved in 50% formamide and stored at −80 °C.
Isolation of GFP positive melanophores via flow cytometry
The GFP-expressing melanophores of the pt101 and pt102 transgenic fish were isolated via flow cytometry. Specifically, 5-dpf embryos were dissociated into suspensions of single cells through digestion with TrypLE (Invitrogen Corporation). For every gram of embryos, 5 ml of TrypLE was added. The incubation was performed with gentle agitation for 30 minutes at 37 °C and at room temperature for additional 30 minutes. Dissociated cells were collected and washed twice with 1× PBS by centrifugation at 2000 rpm with a benchtop microcentrifuge. The cells were re-suspended in 1× PBS and sorted with a BD FACSARIA flow cytometer. Cells were sorted by a two-step sequential isolation method, i.e. the cells isolated in the first round of flow cytometry were sorted again. Isolated GFP positive cells were spread on poly-L-lysine-coated slides (Electron Microscopy Sciences) and allowed to adhere to the slides by a stationary incubation of 3 hours at room temperature followed by fixation with 1% paraformaldehyde at 4 °C overnight. The attached cells were analyzed for the presence of zpr2 antigen using the immunostaining method as described above.
The analysis of the intensity of GFP fluorescence signal
To determine the relative GFP expression levels in the RPE of the transgenic fish, we measured GFP signal intensity as follows: The lateral views of the eyes at 36, 48, and 72 hpf were photographed with a FAST1394 QImaging camera under a Leica FluoIII™ fluorescence stereomicroscope at the same setting for all embryos. The camera acquisition mode was set at monochromatic detection and 12-bit formatting. The regional GFP signal intensities in the collected digital images were measured in MetaMorph v6.1. To eliminate the interference from non-specific background noise, we designed and used the following formula to determine the relative fluorescence intensities that reflect the real RPE expression of GFP: The relative real in-focus GFP signal of the RPE = average signal intensity at the boundary of the eye (areas b in Fig.5. A) - average signal intensity in the interior but non-lens regions of the eye (areas i in Fig.5. A). This formula is based on the rational that the signal intensity at the boundary of the eye, where the focus plane is, is the sum of the RPE GFP signal and the non-specific background noise; whereas the signal intensity in the interior of the eye is the sum of the out-of-focus RPE GFP signal and the non-specific background noise. The average pixel signal intensities were calculated from the MetaMorph measurements. Ten eyes were surveyed for each transgenic line. For each eye, twenty boundary spots and ten interior spots were sampled.
ACKNOWLEDGEMENTS
The authors thank Anne Catalano for assistance in manuscript preparation, Kira Lathrop for assistance in using the MetaMorph software, Nancy Zurowski for help with flow cytometry. The work was supported by a NIH core grant (5P30EY008098-17) and the following funds to X.W.: University of Pittsburgh School of Medicine startup fund, Research to Prevent Blindness Career Development Award, NIH RO1EY016099, and UPMC Health System Competitive Medical Research Grant. F. B. is supported by the Swiss National Science Foundation and Oncosuisse.
Abbreviations
pt101
ftyrp1:GFPpt101
pt102
ftyrp1:GFPpt102
RPE
retinal pigment epithelium
Tyrp1
Tyrosinase related protein 1
NCDM
neural crest-derived melanophores
hpf
hour post fertilization
dpf
day post fertilization
ftyrp1
Fugu tyrp1
NCBI
the National Center for Biotechnology Information
GFP
green fluorescent protein
REFERENCES
- Bentley NJ, Eisen T, Goding CR. Melanocyte-specific expression of the human tyrosinase promoter: activation by the microphthalmia gene product and role of the initiator. Mol Cell Biol. 1994;14:7996–8006. doi: 10.1128/mcb.14.12.7996. [DOI] [PMC free article] [PubMed] [Google Scholar]
- Boulton M, Dayhaw-Barker P. The role of the retinal pigment epithelium: topographical variation and ageing changes. Eye. 2001;15:384–389. doi: 10.1038/eye.2001.141. [DOI] [PubMed] [Google Scholar]
- Brenner S, Elgar G, Sandford R, Macrae A, Venkatesh B, Aparicio S. Characterization of the pufferfish (Fugu) genome as a compact model vertebrate genome. Nature. 1993;366:265–268. doi: 10.1038/366265a0. [DOI] [PubMed] [Google Scholar]
- Camacho-Hubner A, Rossier A, Beermann F. The Fugu rubripes tyrosinase gene promoter targets transgene expression to pigment cells in the mouse. Genesis. 2000;28:99–105. doi: 10.1002/1526-968x(200011/12)28:3/4<99::aid-gene20>3.0.co;2-d. [DOI] [PubMed] [Google Scholar]
- Camacho-Hubner A, Richard C, Beermann F. Genomic structure and evolutionary conservation of the tyrosinase gene family from Fugu. Gene. 2002;285:59–68. doi: 10.1016/s0378-1119(02)00411-0. [DOI] [PubMed] [Google Scholar]
- Camp E LM. Tyrosinase gene expression in zebrafish embryos. Dev Genes Evol. 2001;211:150–153. doi: 10.1007/s004270000125. [DOI] [PubMed] [Google Scholar]
- Crollius HR, Weissenbach J. Fish genomics and biology. Genome Res. 2005;15:1675–1682. doi: 10.1101/gr.3735805. [DOI] [PubMed] [Google Scholar]
- del Marmol V, Beermann F. Tyrosinase and related proteins in mammalian pigmentation. FEBS Lett. 1996;381:165–168. doi: 10.1016/0014-5793(96)00109-3. [DOI] [PubMed] [Google Scholar]
- Goding CR. Mitf from neural crest to melanoma: signal transduction and transcription in the melanocyte lineage. Genes Dev. 2000;14:1712–1728. [PubMed] [Google Scholar]
- Groves AK, Bronner-Fraser M. Neural crest diversification. Curr Top Dev Biol. 1999;43:221–258. doi: 10.1016/s0070-2153(08)60383-x. [DOI] [PubMed] [Google Scholar]
- Hemesath TJ, Steingrimsson E, McGill G, Hansen MJ, Vaught J, Hodgkinson CA, Arnheiter H, Copeland NG, Jenkins NA, Fisher DE. microphthalmia, a critical factor in melanocyte development, defines a discrete transcription factor family. Genes Dev. 1994;8:2770–2780. doi: 10.1101/gad.8.22.2770. [DOI] [PubMed] [Google Scholar]
- Jablonski MM, Tombran-Tink J, Mrazek DA, Iannaccone A. Pigment epithelium-derived factor supports normal development of photoreceptor neurons and opsin expression after retinal pigment epithelium removal. J Neurosci. 2000;20:7149–7157. doi: 10.1523/JNEUROSCI.20-19-07149.2000. [DOI] [PMC free article] [PubMed] [Google Scholar]
- Jablonski MM, Tombran-Tink J, Mrazek DA, Iannaccone A. Pigment epithelium-derived factor supports normal Muller cell development and glutamine synthetase expression after removal of the retinal pigment epithelium. Glia. 2001;35:14–25. doi: 10.1002/glia.1066. [DOI] [PubMed] [Google Scholar]
- Karakousis PC, John SK, Behling KC, Surace EM, Smith JE, Hendrickson A, Tang WX, Bennett J, Milam AH. Localization of pigment epithelium derived factor (PEDF) in developing and adult human ocular tissues. Mol Vis. 2001;7:154–163. [PubMed] [Google Scholar]
- Kawakami K, Takeda H, Kawakami N, Kobayashi M, Matsuda N, Mishina M. A transposon-mediated gene trap appRoche identifies developmentally regulated genes in zebrafish. Dev Cell. 2004;7:133–144. doi: 10.1016/j.devcel.2004.06.005. [DOI] [PubMed] [Google Scholar]
- Kelsh RN, Brand M, Jiang YJ, Heisenberg CP, Lin S, Haffter P, Odenthal J, Mullins MC, van Eeden FJ, Furutani-Seiki M, et al. Zebrafish pigmentation mutations and the processes of neural crest development. Development. 1996;123:369–389. doi: 10.1242/dev.123.1.369. [DOI] [PubMed] [Google Scholar]
- Kimura-Yoshida C, Kitajima K, Oda-Ishii I, Tian E, Suzuki M, Yamamoto M, Suzuki T, Kobayashi M, Aizawa S, Matsuo I. Characterization of the pufferfish Otx2 cis-regulators reveals evolutionarily conserved genetic mechanisms for vertebrate head specification. Development. 2004;131:57–71. doi: 10.1242/dev.00877. [DOI] [PubMed] [Google Scholar]
- Kobayashi C, Kagami H, Kito K, Ishikawa K, Ebisawa K, Ueda M, Terasaki H. Selective and efficient culturing of retinal pigment epithelial cells using a feeder layer. Cytotherapy. 2005;7:427–437. doi: 10.1080/14653240500319150. [DOI] [PubMed] [Google Scholar]
- Layer PG, Rothermel A, Willbold E. Inductive effects of the retinal pigmented epithelium (RPE) on histogenesis of the avian retina as revealed by retinospheroid technology. Seminars in Cell & Developmental Biology. 1998;9:257–262. doi: 10.1006/scdb.1998.0234. [DOI] [PubMed] [Google Scholar]
- Layer PG, Rothermel A, Willbold E. From stem cells towards neural layers: a lesson from re-aggregated embryonic retinal cells. Neuroreport. 2001;12:A39–46. doi: 10.1097/00001756-200105250-00001. [DOI] [PubMed] [Google Scholar]
- Lister JA, Close J, Raible DW. Duplicate mitf genes in zebrafish: complementary expression and conservation of melanogenic potential. Dev Biol. 2001;237:333–344. doi: 10.1006/dbio.2001.0379. [DOI] [PubMed] [Google Scholar]
- Lister JA. Development of pigment cells in the zebrafish embryo. Microscopy Research & Technique. 2002;58:435–441. doi: 10.1002/jemt.10161. [DOI] [PubMed] [Google Scholar]
- Martinez-Morales JR, Signore M, Acampora D, Simeone A, Bovolenta P. Otx genes are required for tissue specification in the developing eye. Development. 2001;128:2019–2030. doi: 10.1242/dev.128.11.2019. [DOI] [PubMed] [Google Scholar]
- Martinez-Morales JR, Dolez V, Rodrigo I, Zaccarini R, Leconte L, Bovolenta P, Saule S. OTX2 activates the molecular network underlying retina pigment epithelium differentiation. J Biol Chem. 2003;278:21721–21731. doi: 10.1074/jbc.M301708200. [DOI] [PubMed] [Google Scholar]
- McClure M. Development and evolution of melanophore patterns in fishes of the genus Danio (Teleostei: Cyprinidae) J Morphol. 1999;241:83–105. doi: 10.1002/(SICI)1097-4687(199907)241:1<83::AID-JMOR5>3.0.CO;2-H. [DOI] [PubMed] [Google Scholar]
- Murisier F, Guichard S, Beermann F. A distal regulatory element involved in the regulation of Tyrp1 expression in melanocytes. Pigment Cell Research. 2005;18(Supplement 1):65. [Google Scholar]
- Murisier F, Beermann F. Genetics of pigment cells: lessons from the tyrosinase gene family. Histology and Histopathology. 2006 doi: 10.14670/HH-21.567. In press. [DOI] [PubMed] [Google Scholar]
- Osawa M, Egawa G, Mak SS, Moriyama M, Freter R, Yonetani S, Beermann F, Nishikawa S. Molecular characterization of melanocyte stem cells in their niche. Development. 2005;132:5589–5599. doi: 10.1242/dev.02161. [DOI] [PubMed] [Google Scholar]
- Potterf SB, Furumura M, Dunn KJ, Arnheiter H, Pavan WJ. Transcription factor hierarchy in Waardenburg syndrome: regulation of MITF expression by SOX10 and PAX3. Hum Genet. 2000;107:1–6. doi: 10.1007/s004390000328. [DOI] [PubMed] [Google Scholar]
- Raible DW, Wood A, Hodsdon W, Henion PD, Weston JA, Eisen JS. Segregation and early dispersal of neural crest cells in the embryonic zebrafish. Dev Dyn. 1992;195:29–42. doi: 10.1002/aja.1001950104. [DOI] [PubMed] [Google Scholar]
- Rawls JF, Mellgren EM, Johnson SL. How the zebrafish gets its stripes. Dev Biol. 2001;240:301–314. doi: 10.1006/dbio.2001.0418. [DOI] [PubMed] [Google Scholar]
- Raymond SM, Jackson IJ. The retinal pigmented epithelium is required for development and maintenance of the mouse neural retina. Current Biology. 1995;5:1286–1295. doi: 10.1016/s0960-9822(95)00255-7. [DOI] [PubMed] [Google Scholar]
- Rothermel A, Layer PG. Photoreceptor plasticity in reaggregates of embryonic chick retina: rods depend on proximal cones and on tissue organization. Eur J Neurosci. 2001;13:949–958. doi: 10.1046/j.1460-9568.2001.01469.x. [DOI] [PubMed] [Google Scholar]
- Rymer J, Wildsoet CF. The role of the retinal pigment epithelium in eye growth regulation and myopia: a review. Vis Neurosci. 2005;22:251–261. doi: 10.1017/S0952523805223015. [DOI] [PubMed] [Google Scholar]
- Santagati F, Abe K, Schmidt V, Schmitt-John T, Suzuki M, Yamamura K, Imai K. Identification of Cis-regulatory elements in the mouse Pax9/Nkx2–9 genomic region: implication for evolutionary conserved synteny. Genetics. 2003;165:235–242. doi: 10.1093/genetics/165.1.235. [DOI] [PMC free article] [PubMed] [Google Scholar]
- Schmidt A, Tief K, Yavuzer U, Beermann F. Ectopic expression of RET results in microphthalmia and tumors in the retinal pigment epithelium. Int J Cancer. 1999;80:600–605. doi: 10.1002/(sici)1097-0215(19990209)80:4<600::aid-ijc19>3.0.co;2-2. [DOI] [PubMed] [Google Scholar]
- Schmitt E, Dowling J. Early eye morphogenesis in thezebrafish, Brachydanio rerio. Journal of Comparative Neurology. 1994;344:532–542. doi: 10.1002/cne.903440404. [DOI] [PubMed] [Google Scholar]
- Schraermeyer U, Heimann K. Current understanding on the role of retinal pigment epithelium and its pigmentation. Pigment Cell Res. 1999;12:219–236. doi: 10.1111/j.1600-0749.1999.tb00755.x. [DOI] [PubMed] [Google Scholar]
- Smabrook JR, D . Molecular Clong: a laboratory manual. Third Edition Cold Spring Harbor Laboratory Press; 2001. [Google Scholar]
- Stapleton T, Luchman A, Johnston J, Browder L, Brenner S, Venkatesh B, Jirik FR. Compact intergenic regions of the pufferfish genome facilitate isolation of gene promoters: characterization of Fugu 3'-phosphoadenosine 5'-phosphosulfate synthase 2 (fPapss2) gene promoter function in transgenic Xenopus. FEBS Lett. 2004;556:59–63. doi: 10.1016/s0014-5793(03)01353-x. [DOI] [PubMed] [Google Scholar]
- Takeda K, Yasumoto K, Kawaguchi N, Udono T, Watanabe K, Saito H, Takahashi K, Noda M, Shibahara S. Mitf-D, a newly identified isoform, expressed in the retinal pigment epithelium and monocyte-lineage cells affected by Mitf mutations. Biochim Biophys Acta. 2002;1574:15–23. doi: 10.1016/s0167-4781(01)00339-6. [DOI] [PubMed] [Google Scholar]
- Thumann GH, D.R. Cell biology of the retinal pigment epithelium. Retina. In: Ogden Thomas E, Hinton David R., editors. Basic science and inherited retinal disease. Third edition Mosby, Inc; Missouri: 2001. pp. 104–121.pp. 1 [Google Scholar]
- Tian J, Ishibashi K, Honda S, Boylan SA, Hjelmeland LM, Handa JT. The expression of native and cultured human retinal pigment epithelial cells grown in different culture conditions. Br J Ophthalmol. 2005;89:1510–1517. doi: 10.1136/bjo.2005.072108. [DOI] [PMC free article] [PubMed] [Google Scholar]
- Venkatesh B, Si-Hoe SL, Murphy D, Brenner S. Transgenic rats reveal functional conservation of regulatory controls between the Fugu isotocin and rat oxytocin genes. Proc Natl Acad Sci U S A. 1997;94:12462–12466. doi: 10.1073/pnas.94.23.12462. [DOI] [PMC free article] [PubMed] [Google Scholar]
- Venkatesh B, Gilligan P, Brenner S. Fugu: a compact vertebrate reference genome. FEBS Lett. 2000;476:3–7. doi: 10.1016/s0014-5793(00)01659-8. [DOI] [PubMed] [Google Scholar]
- Venkatesh B, Yap WH. Comparative genomics using fugu: a tool for the identification of conserved vertebrate cis-regulatory elements. Bioessays. 2005;27:100–107. doi: 10.1002/bies.20134. [DOI] [PubMed] [Google Scholar]
- Vollmer G, Layer P. An in vitro model of proliferation and differentiation of the chick retina: coaggregates of retinal and pigment epithelial cells. J Neurosci. 1986;6:1885–1896. doi: 10.1523/JNEUROSCI.06-07-01885.1986. [DOI] [PMC free article] [PubMed] [Google Scholar]
- Watanabe A, Takeda K, Ploplis B, Tachibana M. Epistatic relationship between Waardenburg syndrome genes MITF and PAX3. Nat Genet. 1998;18:283–286. doi: 10.1038/ng0398-283. [DOI] [PubMed] [Google Scholar]
- Waterston RH, Lindblad-Toh K, Birney E, Rogers J, Abril JF, Agarwal P, Agarwala R, Ainscough R, Alexandersson M, An P, et al. Initial sequencing and comparative analysis of the mouse genome. Nature. 2002;420:520–562. doi: 10.1038/nature01262. [DOI] [PubMed] [Google Scholar]
- Yasumoto K, Yokoyama K, Takahashi K, Tomita Y, Shibahara S. Functional analysis of microphthalmia-associated transcription factor in pigment cell-specific transcription of the human tyrosinase family genes. J Biol Chem. 1997;272:503–509. doi: 10.1074/jbc.272.1.503. [DOI] [PubMed] [Google Scholar]