Polymer translocation through α-hemolysin pore with tunable polymer-pore electrostatic interaction (original) (raw)
Abstract
We have measured the ionic current blockages produced by single molecules of sodium poly(styrene sulfonate) passing through an α-hemolysin protein pore under an electric field. Most of the blockage events were composed of one or two blockage levels of ionic current. By analyzing the statistics of different event types for different polymer lengths, applied voltages, and pH conditions, we have identified the molecular mechanism behind the two-level blockages. Our analysis of the data shows that not all blockages are successful translocation events and the propensity of successful translocation can be tuned by pH gradients across the protein pore. We interpret our results as the change in protein-polymer interaction via protonation of charged amino acid residues of α-hemolysin pore. In addition, we have constructed a stochastic theory for polymer translocation through α-hemolysin pore with tunable polymer-pore interactions. The theoretical calculations capture many features observed in our experiments.
INTRODUCTION
Polymer translocation through a nanometer-scale pore is ubiquitous in many biological systems. There has recently been a series of investigations on the translocation of single macromolecules through protein pores and solid-state nanopores, mainly due to the ongoing demand on the development of DNA-sequencing technologies. These efforts have serendipitously generated a wealth of information to facilitate an understanding of the still-elusive mechanism of macromolecular transport through nanopores. The experimental data show that the seemingly simple process of threading a chain through a narrow pore is quite complex and highly stochastic. Forces emanating from the conformational entropy of the polymer, charge decorations on the pore, and hydrodynamics contribute to variable extents depending on the experimental conditions. The focus of the present paper is to elucidate the role of the electrostatic nature of the pore on polymer translocation, by performing single molecule electrophysiology experiments on a synthetic polyelectrolyte [sodium poly(styrene sulfonate)] through a protein pore (made from α-hemolysin) in the presence of gradients in proton concentration.
In general, a single polymer molecule may pass through the pore in single-file or in folded conformations, depending on the ratio of the pore diameter and the thickness of the polymer backbone. Here we consider only single-file translocations through protein nanopores. This kind of translocation processes has been studied using nucleic acids1, 2, 3, 4, 5, 6, 7, 8, 9, 10, 11, 12, 13, 14 and synthetic polymers15, 16 through α-hemolysin (αHL) protein pore. Analogous experiments have recently been carried out with another protein (MspA) pore as well.17 Several theoretical models18, 19, 20, 21, 22 and computer simulations23, 24 have been devoted to understand this process.
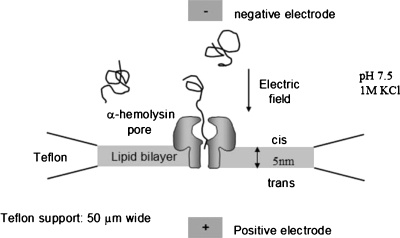
Since our experiments presented here are based on the αHL pore (please see Table 1 for the definitions of abbreviated symbols), we first briefly summarize the setup, methodology, and the current status of the data analysis for this system. For the scenario of single-file translocation of polymers through αHL pore, the experimental setup is illustrated in Fig. 1. The αHL pore is embedded into a lipid bilayer supported by an ∼50 μm wide Teflon aperture. An electric field is applied across the nanopore to drive the charged polymer molecules through the nanopore. The narrowest part of the nanopore is about 1.5 nm, allowing the charged polymer molecules to pass through the nanopore only linearly without forming hairpins. If a polymer molecule resided in the nanopore, a brief blockage in the ionic current would be observed. For every event of such blockages, the duration and the ionic current of the blockages are recorded and from which their distribution functions are constructed. Among all observed blockade events, only a certain fraction are actual translocation events and the rest are failed translocations.
Table 1.
Definitions of symbols and parameters.
| αHL | α-hemolysin protein pore |
|---|---|
| Δ_F_1 | Free energy barrier for escape from vestibule to cis |
| Δ_F_2 | Free energy barrier for placing chain end in β-barrel |
| EOF | Electro-osmotic flow |
| ϵ | Net interaction energy between a segment and the pore in units of k B T |
| F(m) | Free energy profile for translocation |
| I | Ionic current under a given voltage in pA |
| I b | Ionic current in blocked state in pA |
| _I_0 | Open pore current in pA |
| J w | Flux of electro-osmotic flow |
| _k_0 | Phenomenological diffusion constant of one segment in the pore |
| m | Translocation coordinate |
| M | Length of the β-barrel in units of Kuhn length |
| M w | Weight-averaged molecular weight of the polymer in kg∕mol |
| N | Number of Kuhn segments per chain |
| NaPSS | Sodium poly(styrene sulfonate) |
| N w | Number of water molecules associated with a moving ion |
| P+∕_P_− | Ratio of permeabilities of K+ and Cl− |
| P t(z) | Probability of successful translocation with one end initially at z |
| τ1 | Duration of current blockade of type 1 in ms |
| τ12_a_ | Duration of lower current blockade of type 12 in ms |
| τ12_b_ | Duration of deeper current blockade of type 12 in ms |
| τ2 | Duration of current blockade of type 2 in ms |
| V | Applied voltage in mV |
| V c | Threshold voltage above which 2- and 12-type events occur |
| V R | Reversal voltage with zero ionic current in mV |
| W m(t) | Probability of realizing a state for a prescribed F(m) |
Figure 1.
The αHL protein nanopore embedded onto a lipid bilayer in 1_M_ KCl solution (pH=7.5). Charged polymers are driven by the applied voltage to pass through the nanopore.
Most of the previous studies treated the blockage events as single-level events characterized by one event duration and one average blockage current. In reality, it is not uncommon to observe multiple-level events and the usual treatment averages out the multiple-level information. Recently, Butler et al.7, 8 analyzed the multiple-level events produced by single-stranded RNA and DNA through αHL. They concluded that the shallow blockage levels correspond to the polymer trapping inside the vestibule of αHL and the deep blockage levels correspond to the polymer passage through the pore.
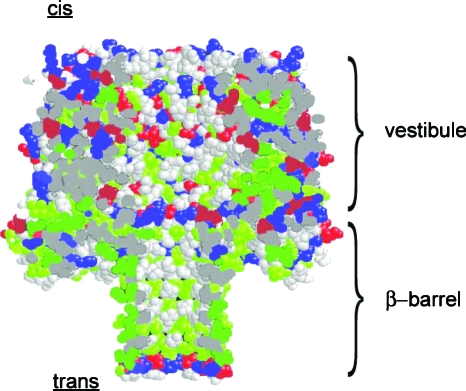
For the case of αHL pore, the internal surface exposed to the polymer undergoing translocation is decorated with hydrophobic, hydrophilic, and ionic residues, with substantial spatial correlations of their locations. The structure of αHL pore is shown in Fig. 2.25 To pass through the pore from the _cis_-side (facing the vestibule of the pore) to the _trans_-side (facing the β-barrel of the pore), a polymer molecule first enters the relatively spacious vestibule with ∼4.6 nm diameter. It then passes through the 1.5 nm constriction, which restricts the polymer molecule to pass through only linearly, to enter the ∼5 nm long and ∼2 nm wide β-barrel. Both the pore geometry and the charge distribution influence the dynamics of polymer translocation. Most notably, the vestibule may act as an entropic trap to the polymer because it is relatively spacious, allowing the polymer to adopt many of the favorable conformations. The 1.5 nm constriction allows the polymer to enter the β-barrel only with chain ends but not hairpins. The 1.5 nm constriction is composed of seven lysines (Lys147, in each of the heptamers of the αHL pore assembly) and seven glutamic acids (Glu111). At pH 7.5, the Lys147 residues are positively charged and the Glu111 residues are negatively charged, making the overall charge of the constriction zero. At the end of the β-barrel, there is a highly charged ring composed of 14 aspartic acids (Asp127 and Asp128) and 7 lysines (Lys131). At pH 7.5, the net charge of the ring is −7 electron charges (e), possibly impeding the translocation of negatively charged polymers.
Figure 2.
The space-filling model of αHL protein nanopore in pH 7.5. Blue: positively charged residues. Red: negatively charged residues. Green: hydrophobic residues. Gray: hydrophilic residues.
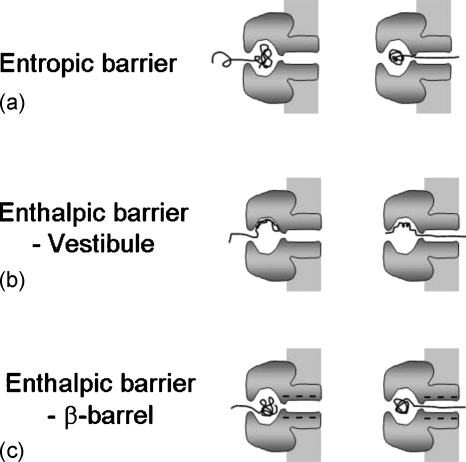
Based on the existence of the vestibule and the β-barrel compartments, and the chemical variations on the internal surface of the pore, there might be three distinct contributing factors to the translocation process as sketched in Fig. 3. For the first, the polymer is preferentially partitioned into the vestibule over the β-barrel allowing more number of conformations inside the vestibule. In order to pass through the pore, one of the chain ends must be placed at the entrance of the β-barrel and this requires a loss in the conformational entropy of the chain. Therefore, the vestibule acts as an entropic trap. This results in an entropic contribution to the free energy barrier for the translocation. The second contributing factor is the polymer-pore interaction inside the vestibule region. The attraction between the vestibule surface and the chain can hold the chain from entering the β-barrel. The chain has to overcome this attraction, and hence this results in an enthalpic contribution to the free energy barrier for translocation. The third factor arises from the polymer-pore interaction inside the β-barrel region. This also results in an enthalpic contribution to the free energy barrier. In particular, the enthalpic barrier from the β-barrel might be dominated by the electrostatic repulsion between the negatively charged polymer and the ring with a net negative charge (−7_e_ at pH=7.5) at the exit region of the pore. Given that the nominal Debye length (over which the electrostatic interactions are correlated) for 1_M_ KCl is about 0.4 nm, the electrostatic repulsion between the charged ring and the polymer may be significant inside the 2 nm wide β-barrel. All of the above three factors are expected to contribute to the free energy barrier for translocation.
Figure 3.
Three possible contributions controlling the free energy barrier for translocation through αHL. (a) Chain confinement inside the vestibule leads to entropic barrier. (b) Adsorption of polymer at the interior surface of the vestibule leads to enthalpic barrier. (c) Electrostatic interaction between the polymer and the β-barrel results in an enthalpic barrier.
To date, the relative weights of the entropic and enthalpic contributions to the free energy barrier have not been established for the translocation of polymer molecules. The extent of enthalpic part depends on the nonuniversal nature of the monomers constituting the polymer and how they interact with the internal surface of the protein pore. In order to unravel these specific enthalpic contributions, one methodology is to generate different mutations of the amino acid sequences of the protein molecules constituting the protein pore, as demonstrated in a recent study.14 Another convenient methodology is to modify the charge decoration on the surface of the pore by generating a pH gradient. We have followed the latter method to investigate the electrostatic interactions between the pore and the polymer. Further, temperature dependent studies will quantitatively resolve the enthalpic and entropic components of the free energy barrier. In the present paper, we report results at only one temperature and the ongoing investigation on the temperature effect is relegated to a future publication.
The significant role of electrostatic forces from the amino acid residues inside the αHL pore on the pore conductance has already been demonstrated by Misakian and Kasianowicz.26 In their study, the extent of rectification of the ionic current through α-HL pore was shown to depend on the pH and its gradient. In addition to establishing that pH gradients can be used to alter the charge decoration of αHL, this investigation clearly demonstrates that electrostatic interactions among the charged amino acid groups of α-HL and the permeant ions play a significant role in determining the ion transport. These electrostatic interactions are expected to play a similar role for the translocation of a charged polymer through αHL as well. Also, in a recent study14 with a single- stranded DNA, Maglia et al. modified the internal positive charge within αHL by site-directed mutagenesis and showed that the voltage threshold for translocation can be altered dramatically.
By following the strategy of Misakian and Kasianowicz26 to modify the electrostatic nature of the αHL pore, we have investigated polymer translocation in order to determine the role of electrostatic interaction between the pore and polymer. In this paper, we report the effect of pH gradients across the αHL pore on the translocation of sodium (polystyrene sulfonate) (NaPSS). The pH gradient has allowed us to tune the net charge of the ring at the end of the β-barrel and the constriction inside the β-barrel near the vestibule and consequently the sign and strength of the electrostatic interaction between the polymer and β-barrel.
The thickness and the monomer length along the backbone of NaPSS are 0.9 and 0.3 nm, respectively. These values are to be compared with 1.2 and 0.4 nm, respectively, for single-stranded DNA in solutions. Each sulfonated styrene monomer carries one nominal negative charge, although the effective charge arising from counterion adsorption is about −0.3_e_. In our experiments, the polymer length is in the range between 23.3 and 734.8 nm. In view of the geometrical and charge similarities between the NaPSS and single-stranded DNA, we expect the mechanism of translocation through αHL pore to be similar for these two kinds of flexible polyelectrolytes.
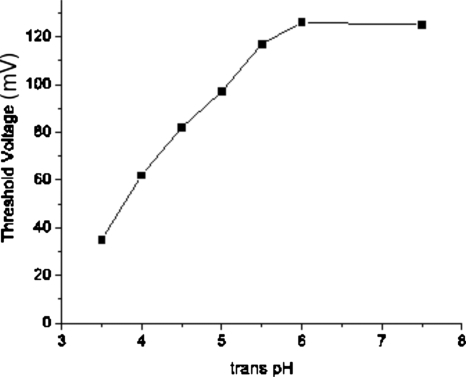
The measured ionic current traces show two distinct blockage levels (shallow and deep), as seen recently for the translocation of polynucleotides.7, 8 Our analysis of these blockage levels is consistent with the interpretation that the shallow and deep blockages correspond to the polymer trapping inside the vestibule and the β-barrel, respectively. Furthermore, by distinguishing successful translocation events among all translocation attempts, we show that the success rate increases with the lowering of pH on the _trans_-side. Detailed analysis of the ionic current traces has allowed us to monitor the probability and duration of successful translocation events. We show that the ratio of successful translocation events to failed events can be as much as two orders of magnitude when the _trans_-pH is lowered from 7.5 to 4.5. The threshold voltage V c required for successful translocation depends nonlinearly on the pH gradient. By keeping _cis_-pH to be 7.5, V c decreases nonlinearly from ∼125 to ∼35 mV as the _trans_-pH is lowered from 7.5 to 3.5. The average duration of successful translocation events increases with lowering _trans_-pH, whereas that for trapping inside the vestibule decreases. All of these conclusions are consistent with making the β-barrel less electrostatically repulsive for the polymer as the _trans_-pH is lowered. Also, we find that the average translocation time associated with successful translocation events scales linearly with the ratio of polymer length to applied voltage, in accordance with theoretical predictions based on drift-dominated translocation dynamics. We have also measured the reversal voltage under a salt gradient in order to monitor the role of the electro-osmotic force (EOF) on polymer translocation through αHL. Our assessment is that EOF plays negligible role for the translocation of NaPSS through αHL. Finally, in an attempt to explain our experimental findings, we present a stochastic theory based on vestibule trapping and polymer-pore interactions.
The rest of the paper is organized as follows. Section 2 describes the materials and methods. Experimental results are given in Sec. 3. After discussing the stochastic theory in Sec. 4, main conclusions are presented in Sec. 5.
MATERIALS AND METHODS
The NaPSS polymers were purchased from Scientific Polymer Products (NY) with weight-averaged molecular weights M w_=16, 57.5, 126.7, and 505 kg∕mol. The polydispersity indices are 1.13, 1.10, 1.17, and 1.24, respectively. The pH 7.5 buffer solution is 1_M KCl solution with 10 mM HEPES. Double de-ionized water with resistivity of 18 MΩ cm (Millipore, MA) was used to prepare the buffer solutions.
As shown in Fig. 1, the experimental setup consisted of two compartments connected by a polyethylene tube with a 50 μm Teflon aperture on one end.3, 4, 15 A pair of Ag∕AgCl electrodes (In Vivo Metric, CA), connected to Axopatch 200B patch clamp amplifier (Axon Instruments, CA), was placed in the two compartments to apply an electric potential difference across the compartments and measure the ionic current passing through the pore. The ionic currents were recorded in the voltage-clamp mode through a 10 kHz low-pass Bessel filter with 3 μs sampling intervals.
The experimental procedure for preparing a single αHL pore is as follows. The Teflon aperture was first coated with several layers of 2g∕l diphytanoyl-phosphatidylcholine (Avanti Polar Lipids, AL) in hexane solution. After the lipid hexane solution had dried up completely, 1_M_ KCl 10 mM HEPES pH 7.5 solution was introduced into both compartments and the polyethylene tube. After a diphytanoyl-PC lipid bilayer was formed across the Teflon aperture, 0.5 μl (or less) of 0.01 g∕l of α-toxin from Staphylococcus aureus (Calbiochem, NJ) was added to the _cis_-compartment. The spontaneous toxin insertion into the lipid bilayer produced an abrupt, quantized increase in the ionic current such that it was ∼120 pA at 120 mV and ∼−90 pA at −120 mV for a single αHL pore.
We used solutions with pH ranges from 3.5 to 7.5 throughout this study. We used 10 mM HEPES and 10 mM citric acid as the buffering agent of pH 7.5 and 3.5–6.0 solutions, respectively, at various salt concentrations.
Polymer translocation experiments were performed by either adding 1–10 μl of 1 g∕l NaPSS solutions to the _cis_-compartment, or forming the αHL pore in NaPSS solution followed by flushing the _trans_-compartment with clean buffer solution. The ionic current trace was recorded by the CLAMPEX 9.2 software and analyzed by our custom MATLAB (Mathworks, Inc., MA) software.
The effect of the electro-osmotic flow was monitored by following the procedure of Gu et al.27, 28, 29 in determining the reversal voltage with agarose salt bridges.
EXPERIMENTAL RESULTS
αHL in asymmetric pH solution
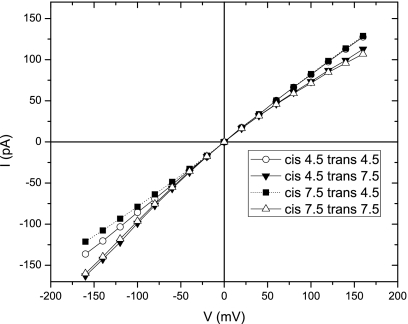
We have studied the responses of αHL to asymmetric pH achieved by simple solution displacement instead of titration. More precisely, for example, pH 7.5 on the _cis_-side and pH 4.5 on the _trans_-side of αHL were achieved by first forming an αHL in symmetric pH 7.5 solution followed by simply flushing the _trans_-compartment with pH 4.5 solution. In this way, changing the solution pH on one side of the pore is convenient and reversible. The I-V curves under different asymmetric pH conditions are shown in Fig. 4. In accordance with Misakian and Kasianowicz,26 we observed that the I-V curve was nearly symmetric in _cis_-pH 7.5 and _trans_-pH 4.5 solution. Specifically, the current rectification ratio γ120 (defined as the ratio of ionic current at −120 and 120 mV) was found to be 1.06. The I-V curves changed more significantly upon a change in the _trans_-pH than a change in the _cis_-pH, suggesting that the ionic passages were largely controlled by the surface charges of the narrow β-barrel rather than those of the spacious vestibule. This result agrees with the molecular dynamics simulations of αHL pore30 that most of the electric potential change occurs inside the β-barrel. The result also suggests that the pH values on one side of the pore do not apply to the whole nanopore within the short durations of the experiments.
Figure 4.
The ionic current (I) is plotted against the applied voltage (V) for αHL pores in 1_M_ KCl solution with different pH values on the _cis_- and _trans_-sides. Open and solid symbols denote symmetric and asymmetric solutions, respectively.
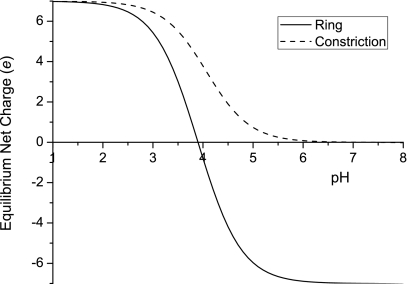
We have estimated the effective charge of the constriction and the ring at the end of the β-barrel as a function of pH. By the standard analysis of ionic equilibria, and taking the pK a values of aspartic acid, lysine, and glutamic acid as 3.9, 10.53, and 4.07, respectively, the equilibrium net charges of the ring at the end of the β-barrel and the constriction for different pH values are plotted in Fig. 5. For pH 7.5 hosting solution, in which most of the previous experiments were conducted, the constriction is neutral while the ring at the end of the β-barrel is −7_e_. Decreasing the solution pH leads to neutralization of negative charges and eventually turns both to be positive.
Figure 5.
Tuning of the electrostatic nature of αHL with pH. The equilibrium net charges of the 1.5 nm constriction and the charged ring at the end of the β-barrel of αHL, as functions of pH.
NaPSS translocation through nanopores in asymmetric pH condition
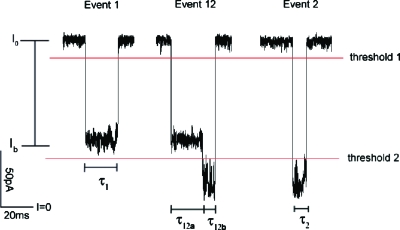
We applied an electric field to drive NaPSS from the cis_- to the trans_-side of the αHL pore. In pH 7.5 solution on both sides, the three most common event types that accounted for more than 95% of all events are shown in Fig. 6. They were composed of two distinct blockage levels, the shallow (level 1) and the deep (level 2) levels. We define a level 1 blockage as a steady blockage with a blockage current I b between thresholds 1 and 2. A level 2 blockage is defined as a steady blockage with I b below threshold 2. From these two blockage levels, we define an event 1 as an event that is composed of a single level 1 blockage. An event 12 is defined as an event that is composed of a level 1 blockage followed by a level 2 blockage. Finally, an event 2 is an event that is composed of a single level 2 blockage. We denote events 12a and 12b as the first and second sublevels of event 12 with durations τ12_a and τ12_b, respectively. By investigating translocation of polynucleotides, Butler et al.7, 8 concluded that level 1 blockages corresponded to polymer trapping inside the vestibule and level 2 blockages corresponded to polymer passing through the β-barrel. Our results on NaPSS are consistent with this interpretation.
Figure 6.
The three most prominent event types (events 1, 12, and 2) in NaPSS translocation through αHL. The blockages were produced by 57.5 kg/mol NaPSS in 1_M_ KCl pH 7.5 solution under 150 mV. _I_0 and I b are the open pore current and the current in the blockaded state, respectively.
Frequency of blockage events
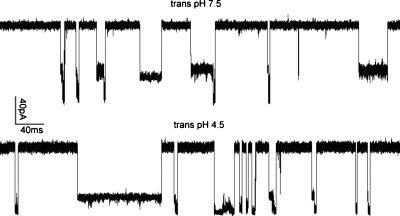
Figure 7 compares the typical ionic current blockages produced by single molecules of NaPSS (57.5 kg∕mol) when the _trans_-pH values were 7.5 and 4.5, respectively. The _cis_-pH was maintained at 7.5 in both cases. Both ionic current traces consisted mainly of events 1, 12, and 2. However, we note that there are several differences between the two traces. The blockages were more frequent for _trans_-pH 4.5 than for _trans_-pH 7.5. The measured frequencies of blockage events at 160 mV are 2.4 events∕s in pH 7.5 and 5.2 events∕s in pH 4.5. Both of the two blockage levels in _trans_-pH 4.5 were deeper than those in _trans_-pH 7.5. Inspection of the measured ionic current traces showed that the values of thresholds 1 and 2 depend on the _trans_-pH. These values were chosen during the data analysis, after the traces were generated. Thresholds 1 and 2 were adjusted accordingly in different pH conditions to capture the two levels. Thresholds 1 and 2 were 0.8_I_0 and 0.3_I_0 for _trans_-pH 7.5, and were 0.6_I_0 and 0.2_I_0 for _trans_-pH 4.5. In our analysis, the minimum durations of blockades of types 1 and 2 are taken as 0.45 and 1.5 ms, respectively. We chose a longer minimum duration for type 2 blockade as the ionic current fluctuates more in this state in comparison with type 1 blockade.
Figure 7.
Typical ionic current traces in _trans_-pH 7.5 and 4.5 for 57.5 kg∕mol NaPSS under 160 mV. The _cis_-pH is 7.5 in both cases.
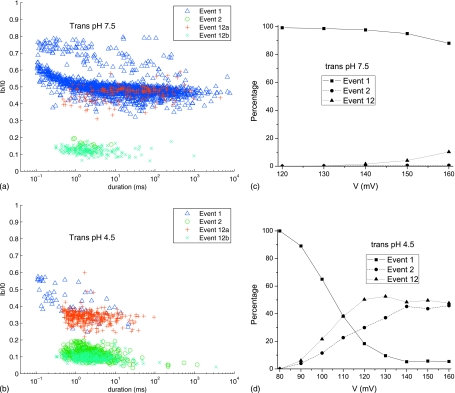
The effects of pH gradient and applied voltage on the translocation of NaPSS (16 kg∕mol) are given in Fig. 8. We have analyzed 1000 blockage events for the applied voltage of 140 mV, in terms of their durations (τ1, τ2, τ12_a_, and τ12_b_) and blockage levels I b. The results are presented as the event diagrams where the ratio of the blockage current I b in an event to the open pore current is plotted against the duration of that particular event. The event diagrams for _trans_-pH of 7.5 and 4.5 are presented in Figs. 8a, 8b, respectively. The identities of the types of blockages (1, 2, 12a, and 12b) are also marked in these figures. The events of 12b- and 2-types appear to overlap with each other in these event diagrams. A significant change in the event diagrams is seen as the _trans_-pH is changed from 7.5 to 4.5. The blockages of the 2- and 12b-types are much more prevalent for _trans_-pH of 4.5. Furthermore, the durations of the individual events of 12a- and 1-types are reduced by a couple of orders of magnitude. The percentage of 2-type events is less than 1% of the total events at 140 mV and _trans_-pH of 7.5, whereas it is ∼45% at _trans_-pH of 4.5. In addition, the percentage of 12-type events increases from ∼2% at _trans_-pH of 7.5 to ∼50% at _trans_-pH of 4.5 for 140 mV. These observations are consistent with our expectation based on the electrostatic interaction between the pore ring and the polymer. As the _trans_-pH is decreased, the net negative charge on the pore ring is decreased (Fig. 5), and as a result, deep blockages corresponding to actual polymer translocation become more prevalent. The relative propensity of the different types of events depends on the applied voltage, which is given in Figs. 8c, 8d. The value of _trans_-pH makes a dramatic change in the relative frequency of the three event types. It is clear that the percentage of 1-type blockage decreases with an increase in applied voltage while that for 12- and 2-types increases. While this is a general result for any pH, the quantitative details for _trans_-pH of 7.5 and 4.5 are striking. For _trans_-pH of 7.5, 1-type events account for more than 80% of all blockages. The second dominant blockage is the 12-type accounting for less than 20% of all events for applied voltages less than 160 mV. The 2-type events contributed to less than 1% of the total events. In contrast to this situation, a change of _trans_-pH from 7.5 to 4.5 dramatically increased the frequency of 2- and 12-type events [Fig. 8d]. In fact, for applied voltages above 110 mV, the 1-type events are of lower occurrence compared to the combined 2- and 12-type events.
Figure 8.
The event diagrams and the percentages of event types for pH 7.5 and 4.5 on the _trans_-side of the pore. The pH on the _cis_-side is 7.5. [(a) and (b)] Event diagrams, the normalized current blockage against the event duration, for 16 kg/mol NaPSS under 140 mV in _trans_-pH 7.5 and 4.5 solutions, respectively. 1000 events are plotted in both diagrams. Levels 1 and 2 blockages of events 12 are treated separately and denoted as events 12a and 12b. [(c) and (d)] Percentages of event types under the same conditions as in (a) and (b), respectively, at different voltages.
It is also evident from Figs. 8c, 8d that there exists a threshold voltage V c below which there are no appreciable occurrences of 2- and 12-type events. This threshold voltage depends on the value of _trans_-pH. For the 16 kg∕mol NaPSS (Fig. 8) system, V c is about 130 and 80 mV, respectively, for _trans_-pH of 7.5 and 4.5.
Average durations of events
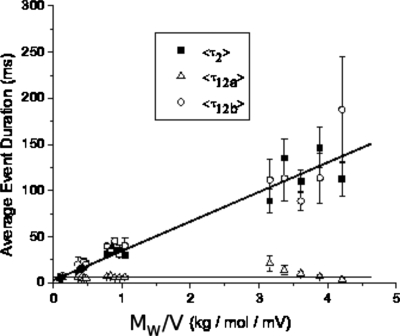
Since the 12- and 2-type events occur more frequently for _trans_-pH of 4.5 than for _trans_-pH of 7.5, we have analyzed the durations of 12a-, 12b-, and 2-type events at _trans_-pH of 4.5. The average durations ⟨τ12_a_⟩, ⟨τ12_b_⟩, and ⟨τ2⟩ for these three types of events are collected for different molecular weights (M _w_=16, 57.5, 126.7, and 505 kg∕mol) of NaPSS and applied voltages. In view of the reports in literature that the average translocation time is proportional to M w_∕_V, we have plotted ⟨τ12_a_⟩, ⟨τ12_b_⟩, and ⟨τ2⟩ against M w_∕_V in Fig. 9. It is clear that ⟨τ2⟩ and ⟨τ12_b_⟩, which are both level 2 blockages, are directly proportional to M w_∕_V with a slope of 31.95±1.69 ms mV mol∕kg. On the other hand, ⟨τ12_a_⟩ is essentially independent of M w_∕_V. It must be remarked that the linear dependence of ⟨τ12_b_⟩ and ⟨τ2⟩ on M w_∕_V can be observed for only large enough values of V. Furthermore, the average duration ⟨τ1⟩ for the 1-type blockages is essentially independent of M w and V for less than 120 mV. As discussed below, the shallow blockages of the 1-type become very long-lived at higher voltages for higher molecular weights of NaPSS.
Figure 9.
The average event duration is plotted against the molecular weight (N) divided by the applied voltage (V). Both ⟨τ12_b_⟩ and ⟨τ2⟩ obeyed the same linear relation against M w_∕_V, while ⟨τ12_a_⟩ was insensitive to the changes in M w and V. The _cis_-pH and _trans_-pH are 7.5 and 4.5, respectively.
Based on the above results, we can arrive at a model of polymer translocation through αHL. The key observations are as follows: (i) the percentages of 12- and 2-type events increase with applied voltage, (ii) ⟨τ2⟩ and ⟨τ12_b_⟩, corresponding to deep blockages, depend on M w and V, and are specifically proportional to M w_∕_V for large enough voltages, (iii) ⟨τ2⟩ and ⟨τ12_b_⟩ are roughly equal to each other within the shown error bars, and (iv) ⟨τ1⟩ and ⟨τ12_a_⟩, corresponding to the shallow blockages, do not depend on M w and V for low enough voltages. These results suggest that only level 2 blockages, that are 12- and 2-type events, are successful translocation events, whereas the shallow level 1 blockages are merely unsuccessful attempts. Therefore, we conclude that the level 1 blockages, which appear in 1- and 12-type events, correspond to polymer trapping inside the vestibule. A level 1 blockage might lead to a successful translocation into the _trans_-side as in the 12-type events, or an unsuccessful return back to the _cis_-side as in 1-type events. This picture is entirely consistent with the observations and the model of Butler et al.7, 8 Also, it must be remarked that in our earlier work15 and other previous analysis of ionic current blockages, all events including 1-, 12-, and 2-types were lumped together in constructing the histograms of the blockage times. In the present work, we are able to monitor the statistics of only the successful translocation events among all blockage events.
Threshold voltage of successful translocation
Since we have deduced that only events of 12- and 2-types are successful translocations, we define the threshold voltage of successful translocation as the lowest voltage at which the sum of 12- and 2-type events accounts for more than 1% out of all recorded events. The results of the threshold voltage so defined for 16 kg∕mol NaPSS are given in Fig. 10 for different values of _trans_-pH. The threshold voltage remains as a constant at 125±0.5 mV when _trans_-pH is lowered from 7.5 to 6.0. Further lowering of _trans_-pH decreases the threshold voltage significantly to 35±0.5 mV at _trans_-pH of 3.5. In other words, the free energy barrier for polymer translocation is significantly decreased when the _trans_-pH is lowered below 5.5.
Figure 10.
The threshold voltage for successful translocation of 16 kg∕mol NaPSS in _cis_-pH 7.5 decreases as _trans_-pH is decreased. The error bars are smaller than the symbols.
Dependence of average blockage durations on pH gradient
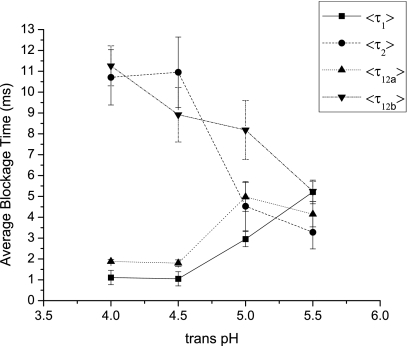
Figure 11 shows how the average blockage durations (⟨τ1⟩, ⟨τ2⟩, ⟨τ12_a_⟩, and ⟨τ12_b_⟩ defined in Fig. 6) depend on the _trans_-pH while the _cis_-pH is kept constant at 7.5. The average durations of level 2 blockages (⟨τ2⟩ and ⟨τ12_b_⟩), which represent successful translocations starting from the chain entering the β-barrel, increase when the _trans_-pH is lowered. This is in contrast to the average durations of level 1 blockages (⟨τ1⟩ and ⟨τ12_a_⟩) representing the trapping of the chain inside the vestibule, which decrease when the _trans_-pH is lowered.
Figure 11.
The average blockage times of 16 kg∕mol NaPSS at 140 mV depend on _trans_-pH. The durations of level 1 blockages, ⟨τ1⟩ and ⟨τ12_a_⟩, decrease with decreasing pH while the durations of level 2 blockages, ⟨τ2⟩ and ⟨τ12_b_⟩, increase with decreasing pH.
The above results are due to the change of polymer-pore interactions inside the β-barrel in response to the change in _trans_-pH. Lowering the _trans_-pH increases the attraction between the polymer and the β-barrel. This makes the polymer easier to enter the β-barrel and thus decreases the trapping time in the vestibule. However, the attraction also makes the chain harder to leave the β-barrel by imposing a free energy barrier for leaving the pore. The translocation time increases as a result. This effect was predicted by Ref. 31 and recently studied by a computer simulation.32 We present a stochastic theory in the following section to describe the polymer-pore interaction and compare with our experimental results.
Effect of electro-osmotic flow on polymer translocation
EOF, the coupled movement of water molecules with charged species under electric fields, is known to drive small molecules into αHL.27, 28, 29 Since increasing the surface charge of the β-barrel increases the negatively charged ions inside the pore and NaPSS is also negatively charged, a decrease in the _trans_-pH is expected to increase the EOF in the direction of the NaPSS translocation. Therefore, it is necessary to estimate whether the increase in EOF is responsible for the enhanced occurrence of successful translocations.
We follow the method of Gu et al.28, 29 to estimate the EOF through the nanopore in asymmetric pH conditions. First we estimate the permeability ratio P+∕_P_− of the two most dominant contributors of the ionic current, K+ and Cl− ions, across the nanopore. It is given by the Goldman–Hodgkin–Katz voltage equation33
| P+P−=[Cl−]c−exp(−eVR∕kBT)[Cl−]texp(−eVR∕kBT)[K+]c−[K+]t, | (3.1) |
|---|
where [K+] and [Cl−] denote the concentrations of K+ and Cl− ions, respectively, on one side of the nanopore. The subscripts c and t denote the _cis_- and _trans_-sides, respectively. V _R_=V t_−_V c is the reversal voltage which sets the ionic current passing through the nanopore zero. e, k B, and T are the electron charge, the Boltzmann constant, and the temperature, respectively.
To estimate the flux of the EOF, following that of Guet al.,28, 29 we further assume that each ion passing through the nanopore is coupled with N w water molecules. N _w_≃10 according to an all-atom molecular dynamics simulation.30 Therefore, the flux of the EOF (in number of water molecules per unit time) is given by
| Jw=NwIe(1−P+∕P−1+P+∕P−), | (3.2) |
|---|
where I is the ionic current under a given voltage.
Equation 3.1 shows that an asymmetric salt condition, i.e., different salt concentrations on the _cis_- and trans_-sides, is necessary for measuring the reversal voltages V R. To ensure the stability of the electrodes in the asymmetric salt conditions, we placed 1.5% agarose salt bridges containing 3_M KCl between the buffer solution and the electrodes. The V R measured were then corrected for the junction potentials using the Junction Potential Calculator, which used the Henderson equation,34 supplied by the CLAMPEX 9.2 current recording program.
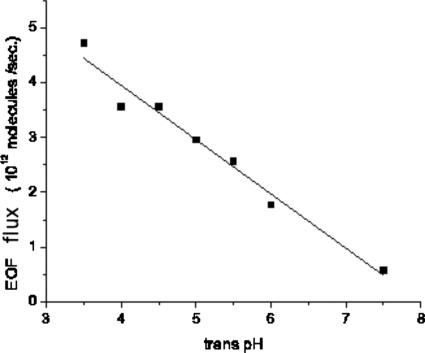
We used 1_M_ KCl solution on the _cis_-side and 200 mM KCl solutions on the trans_-side when measuring the reversal voltage V R. The cis_-pH was kept at 7.5 while trans_-pH ranged from 4.5 to 7.5. The measured V R and the corresponding permeability ratios P+∕_P_− are shown in Table 2. All measured values of P+∕_P_− were less than unity, meaning that negative ions passed through the pore more easily than positive ones. The flux of the EOF was then calculated using Eqs. 3.1, 3.2, and is plotted in Fig. 12. We used 0.6 and 0.72 for the activities of 1_M and 200 mM KCl solution (for example, [KCl] in Eq. 3.1 is corrected to 1_M_×0.6=0.6_M for a 1_M KCl solution.).33, 35 As expected, lowering the _trans_-pH increased the strength of the EOF through αHL in the direction of cis to trans. We observe a linear relation between the strength of the EOF and the _trans_-pH.
Table 2.
The reversal voltage (V R) measured in pH 7.5, 1 M KCl (cis) and 200 mM KCl with variable pH (trans). The permeability ratio P+∕_P_− is calculated using Eq. 3.1.
| _trans_-pH | V R (mV) | P+∕_P_− |
|---|---|---|
| 7.5 | −2.2 | 0.87 |
| 6.0 | −8.1 | 0.60 |
| 5.5 | −13.9 | 0.40 |
| 5.0 | −16.9 | 0.32 |
| 4.5 | −18.0 | 0.30 |
| 4.0 | −18.5 | 0.28 |
| 3.5 | −19.6 | 0.26 |
Figure 12.
The strength of the electro-osmotic flow as a function of the pH value of the _trans_-side solution. The _cis_-pH=7.5.
If EOF is responsible for the increased propensity of successful translocations, we would expect a direct correlation between the strength of the EOF and the threshold voltage of successful translocation. A cautionary note is that the EOF flux in Fig. 12 is only for the open pore without the polymer. Comparing Fig. 12 with Fig. 10, we find that the two do not correlate well. In particular, when the _trans_-pH is changed from 7.5 to 6.0, the strength of the electro-osmotic flow almost triples but the threshold voltage remains unchanged. We conclude that electro-osmotic flow is not the main reason for the dramatic increase in successful translocation events when lowering the _trans_-pH. This conclusion is further corroborated by our experimental observation that a similar concentration of polyethylene glycol, a neutral water-soluble polymer, on the _cis_-side was unable to produce any blockage signals. Therefore, although EOF could drive small molecules into αHL,27, 28, 29 it does not assist macromolecular translocations through αHL in a notable way.
STOCHASTIC MODEL OF POLYMER TRANSLOCATION THROUGH αHL
Formalism
To model the dynamics of polymer translocation through αHL that captures both successful translocations and unsuccessful attempts, we use the Fokker–Planck equation for polymer translocation
| ∂Wm(t)∂t=∂∂m(k0∂F(m)∂mWm(t)+k0∂Wm(t)∂m), | (4.1) |
|---|
with absorbing boundary conditions at both ends of the translocation coordinate m. The variable m denotes the number of polymer segments that have been threaded through the β-barrel.31 Here W m(t) is the probability that the chain is in state m at time t, F(m) denotes the free energy profile of translocation and k_0 is a phenomenological rate constant depending on the friction between one monomer and αHL. Starting from Eq. 4.1, it can be shown that the probability of successful translocation P t(z) and the corresponding mean successful translocation time ⟨τ_t(z)⟩ follow36
| k0[Pt(z)⟨τt(z)⟩]″−F′(z)kBTk0[Pt(z)⟨τt(z)⟩]′=−Pt(z), | (4.2) |
|---|
| Pt″(z)−F′(z)kBTPt′(z)=0, | (4.3) |
|---|
where z (a_≤_z_≤_b) is the initial position in the translocation coordinate and the prime denotes the differentiation with respect to z. Just as m, the initial position z is dimensionless. Starting at z, we define absorption by a and b as unsuccessful and successful translocations, respectively. Equations 4.2, 4.3 are solved with the boundary conditions P t(a)⟨τ_t_(a)⟩=P t(b)⟨τ_t_(b)⟩=0, P t(a)=0, and P t(b)=1. The mean time and probability for unsuccessful events follow similar equations. Explicitly, the successful translocation probability, the mean successful translocation time, and the mean unsuccessful translocation time are
| Pt(z)=Ψ(a,z)Ψ(a,b), | (4.4) |
|---|
| ⟨τt(z)⟩=1k0Ψ(a,z)Φt(z,b)−Ψ(z,b)Φt(a,z)Ψ(a,z)Ψ(a,b), | (4.5) |
|---|
| ⟨τu(z)⟩=1k0Ψ(a,z)Φu(z,b)−Ψ(z,b)Φu(a,z)Ψ(z,b)Ψ(a,b), | (4.6) |
|---|
where
| Φt(p,q)≡∫pqdz∫azdy∫aydw[e−F(y)+F(z)+F(w)], | (4.8) |
|---|
| Φu(p,q)≡∫pqdz∫azdy∫ybdw[e−F(y)+F(z)+F(w)]. | (4.9) |
|---|
The probability of unsuccessful translocations P u(z) satisfies P u(z)+P t(z)=1, of course.
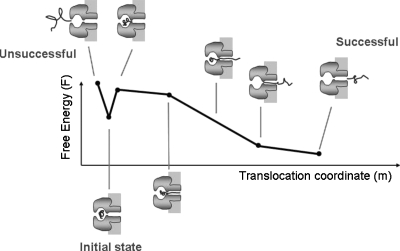
We describe the translocation of 16 kg∕mol NaPSS using a one-dimensional pairwise free energy profile F(m) shown schematically in Fig. 13. The initial local minimum in F(m) at _m_=δ represents the trapped state of the polymer inside the vestibule. The free energy barrier Δ_F_1 from _m_=δ to _m_=0 represents the free energy barrier for the polymer to escape from the vestibule back to the _cis_-side. The free energy barrier Δ_F_2+ln _z_0+ϵ from _m_=δ to _m_=2δ represents the free energy change for partitioning one chain segment into the β-barrel. Here _z_0≃1.54 is the mean coordination number of a self-avoiding chain37 accounting for the total loss of entropy of segments inside the β-barrel. ϵ is the interaction energy between one monomer and the β-barrel, with negative values corresponding to attractions between the polymer and the β-barrel. Δ_F_2 is the entropy loss when one of the chain ends is fixed at the entrance of the β-barrel. For 2δ<m<2δ+_M_−1, where M is the length of the β-barrel, the chain end worms through the β-barrel in single-file and reaches the _trans_-side. For 2δ+_M_−1<m<2δ+_N_−1, part of the chain resides in the _trans_-compartment while keeping the number of segments inside the β-barrel the same. Finally, for 2δ+_N_−1<m<2δ+M+_N_−1, the chain leaves the β-barrel while the other chain end is inside the β-barrel. Explicitly, the free energy of translocation is
| F(m)={−ΔF1m∕δ,0≤m≤δF(δ)+(ΔF2+ln z0+ϵ)(m−δ)∕δ,δ<m≤2δF(2δ)+(qV+ln z0+ϵ)(m−2δ),2δ<m≤2δ+M−1F(2δ+M−1)+qV(m−(2δ+M−1)),2δ+M−1<m≤2δ+N−1F(2δ+N−1)−(ln z0+ϵ)(m−2δ−Nt+1),2δ+N−1<m≤2δ+M+N−1.} | (4.10) |
|---|
We have expressed the energy in k B T and the length in the monomer length of NaPSS. We have assumed that the conformational entropy of the chain tails residing in the _trans_-compartment is negligible and all the electric potential drop V takes place at the constriction between the vestibule and the β-barrel. q is the net charge of a monomer unit. Note that the free energy profile for 2δ<_m_≤2δ+M_−1 should be nonlinear because the confinement energy of a polyelectrolyte inside the vestibule ∼_N x with _x_≥2.38, 39, 40, 41 In other words, free energy of the chain changes nonlinearly when transferring segments from the vestibule to the β-barrel. However, we have neglected this confinement energy for simplicity and retained only the entropy loss (Δ_F_2) when entering the β-barrel. Owing to the numerical difficulty in handling Eqs. 4.5, 4.6 when F(m) is nonlinear, we confine our calculations using the pairwise free energy profile Eq. 4.10, which allows us to keep the expressions analytical until final evaluations.
Figure 13.
Schematic free energy profile for a short NaPSS molecule translocating through αHL. With two absorbing boundaries, exiting on the left and right represent unsuccessful and successful translocations, respectively.
Results
We interpret our experimental results in different _trans_-pH as the change in the polymer-pore interaction, which is described by ϵ. As shown in Fig. 5, the equilibrium net charges of the constriction and the charged ring at the end of the β- barrel depend on the pH of the hosting solution. In particular, decreasing the _trans_-pH increases the net charge of the β-barrel, which increases its attraction to the negative polymer. In our formalism, the decrease in _trans_-pH corresponds to a decrease in ϵ. We note that the total free energy drop across the translocation profile does not depend on the value of ϵ because it is always given by the free energy barriers Δ_F_1 and Δ_F_2, and the potential difference across the αHL pore. In the present theoretical analysis, Δ_F_1 and Δ_F_2 are taken only as parameters. ϵ<0 represents attraction between the polymer and the β-barrel, which competes with the confinement free energy and makes the entrance of the polymer into the narrow β-barrel more probable. Mathematically, the free energy barrier Δ_F_2+ln _z_0+ϵ for entering the β-barrel is lowered as ϵ decreases. However, the same attraction makes the removal of the chain from the β-barrel more difficult. This creates a free energy barrier for leaving the pore, as discussed in Refs. 31, 39.
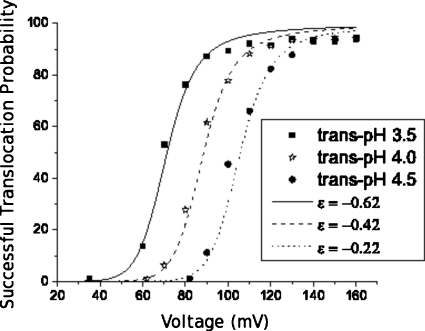
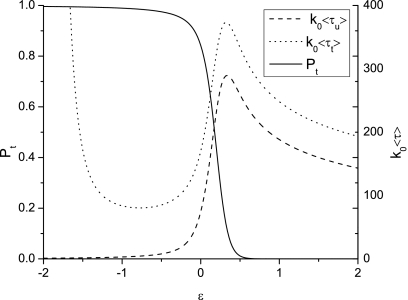
This simple theoretical model is able to capture some of the features of our experimental results, in terms of qualitative trends. Figure 14 compares the experimental results with the probability of successful translocations calculated using Eq. 4.4. We used _N_=78 corresponding to the weighted-averaged molecular weight of 16 kg∕mol NaPSS with monomer length 0.3 nm. The length of the β-barrel is 5 nm which translates to _M_=17. We have assumed the degree of ionization of the NaPSS molecule to be 0.3. Equivalently, the average net charge of each unit is q_=−0.3_e. Further, the values of the parameters Δ_F_1 and Δ_F_2 are taken as 8 and 2, respectively, in order to show the qualitative resemblance to the experimental results. The probability of successful translocation in the experiment is the percentage of the sum of events 12 and 2 in all blockage events. Note that the threshold voltage of successful translocation emerges naturally in our model, a unique feature in using two absorbing boundaries. Although the successful translocation probability describes the experimental results well, we note that the predicted average translocation times are highly nonlinear. Figure 15 shows the average successful and unsuccessful translocation times, ⟨τ_t_⟩ and ⟨τ_u_⟩, and the corresponding successful translocation probabilities P t. ⟨τ_t_⟩ corresponds to ⟨τ12⟩ and ⟨τ2⟩, while ⟨τ_u_⟩ corresponds to ⟨τ1⟩. ⟨τ_t_⟩ increases with decreasing ϵ for ϵ≲−1 and the opposite is true for ⟨τ_u_⟩. Both trends agree qualitatively with those observed in our experiments as shown in Fig. 11. However, significant deviations are predicted at higher values of ϵ. It is difficult to find a set of parameters that quantitatively describes the average successful translocation time, the average unsuccessful translocation time, and the successful translocation probabilities at the same time. We attribute the quantitative discrepancy to our highly simplified pairwise free energy profile for translocation.
Figure 14.
Probability of successful translocation. The scatter points are the percentages of the sum of events 12 and 2 at 140 mV. The lines are evaluated using Eq. 4.4 with δ=1, Δ_F_1=8, Δ_F_2=2, _M_=17, _N_=69,_V_=140 mV, and q_=−0.3_e.
Figure 15.
The average successful translocation time ⟨τ_t_⟩, the average unsuccessful translocation time ⟨τ_u_⟩, and the successful translocation probability P t. δ=1, Δ_F_1=8, Δ_F_2=2, _M_=17, _N_=69, _V_=140 mV, and q_=−0.3_e are used. ϵ is the pore-polymer interaction energy parameter in units of k B T.
CONCLUSIONS AND DISCUSSIONS
In this paper, we have investigated the molecular mechanisms that are responsible for the two-level ionic current blockages produced by single polyelectrolyte passage through αHL. Agreeing with Butler et al.,7, 8 we show that only the translocation events or subevents with deep current blockages (level 2) are successful translocations. The average translocation time for successful events follows the relation τ∼M w_∕_V. By changing the pH on the _trans_-side of the pore, we have tuned the effective charge of the β-barrel and shown that the successful translocation events increase dramatically when the polymer-pore attraction is increased. Furthermore, we have shown that the electro-osmotic flow does not drive macromolecules through the pore in a significant way, although it has been previously known to be able to drive small molecules into the pore.27, 28, 29 Finally, we have constructed a stochastic theory with a pairwise free energy profile with polymer-pore interaction, which is qualitatively consistent with our experimental results.
It must be noted that the validity of the equilibrium condition during polymer translocation through nanopores is being debated in literature.42, 43, 44, 45 The Fokker–Planck formalism we used is only valid when the chain is able to equilibrate at every step of translocation. The longest relaxation times (the Zimm times) of NaPSS in free solutions46 are ∼10−5 to 10−2 ms for 16–505 kg∕mol NaPSS, which are several orders of magnitude shorter than the successful translocation times. Therefore, it is safe to assume that the chain is in equilibrium during translocation through αHL. In fact, as shown in Fig. 9, the successful translocation times followed the relation ∼M w_∕_V, a theoretical result that was derived under the equilibrium assumption.19, 20
Our experimental results suggest a practical method of controlling single polymer passage through nanopores. The successful passage rate can be controlled by simply displacing the trans_-side solution with solutions of different pH. This method is convenient and reversible, and of low cost. Similar effects to those seen in our experiments with NaPSS should be realizable for the translocation of polynucleotides through αHL pore. Also, the same method should apply to a synthetic nanopore if the pore surface is coated with charged species with pK_a within the range of the solution pH used on the _trans_-side. However, since the diameters of synthetic nanopores are generally much larger than that of αHL, EOF has been shown47 to contribute to the polymer passage more significantly. After the completion of our work, a problem similar to the present work has been addressed in a recent publication.48
There are several directions in which the experiments conducted here may be extended. While the present work clearly demonstrates the presence of entropic and enthalpic contributions to the free energy profile, it would be of particular interest to establish quantitatively their relative magnitudes by varying the temperature. Implementation of the same strategies presented here for DNA translocation through the αHL pore would also be of interest.
ACKNOWLEDGMENTS
It is a pleasure to thank Li-Qun Gu and Xiangdong Gu for discussions. Acknowledgment is made to the NSF under Grant No. 0605833 and the NIH under Grant No. R01HG002776.
References
- Kasianowicz J. J., Brandin E., Branton D., and Deamer D. W., Proc. Natl. Acad. Sci. U.S.A. 93, 13770 (1996). 10.1073/pnas.93.24.13770 [DOI] [PMC free article] [PubMed] [Google Scholar]
- Henrickson S. E., Misakian M., Robertson B., and Kasianowicz J. J., Phys. Rev. Lett. 85, 3057 (2000). 10.1103/PhysRevLett.85.3057 [DOI] [PubMed] [Google Scholar]
- Meller A., Nivon L., Brandin E., Golovchenko J., and Branton D., Proc. Natl. Acad. Sci. U.S.A. 97, 1079 (2000). 10.1073/pnas.97.3.1079 [DOI] [PMC free article] [PubMed] [Google Scholar]
- Akeson M., Branton D., Kasianowicz J. J., Brandin E., and Deamer D. W., Biophys. J. 77, 3227 (1999). 10.1016/S0006-3495(99)77153-5 [DOI] [PMC free article] [PubMed] [Google Scholar]
- Meller A. and Branton D., Electrophoresis 23, 2583 (2002). [DOI] [PubMed] [Google Scholar]
- Bonthuis D. J., Zhang J. S., Hornblower B., Mathe J., Shklovskii B. I., and Meller A., Phys. Rev. Lett. 97, 128104 (2006). 10.1103/PhysRevLett.97.128104 [DOI] [PubMed] [Google Scholar]
- Butler T. Z., Gundlach J. H., and Troll M., Biophys. J. 93, 3229 (2007). 10.1529/biophysj.107.107003 [DOI] [PMC free article] [PubMed] [Google Scholar]
- Butler T. Z., Gundlach J. H., and Troll M. A., Biophys. J. 90, 190 (2006). 10.1529/biophysj.105.068957 [DOI] [PMC free article] [PubMed] [Google Scholar]
- Meller A., J. Phys.: Condens. Matter 15, R581 (2003). 10.1088/0953-8984/15/17/202 [DOI] [Google Scholar]
- Nakane J., Wiggin M., and Marziali A., Biophys. J. 87, 615 (2004). 10.1529/biophysj.104.040212 [DOI] [PMC free article] [PubMed] [Google Scholar]
- Vercoutere W., Winters-Hilt S., Olsen H., Deamer D., Haussler D., and Akeson M., Nat. Biotechnol. 19, 248 (2001). 10.1038/85696 [DOI] [PubMed] [Google Scholar]
- DeGuzman V. S., Lee C. C., Deamer D. W., and Vercoutere W. A., Nucleic Acids Res. 34, 6425 (2006). 10.1093/nar/gkl754 [DOI] [PMC free article] [PubMed] [Google Scholar]
- Deamer D. W. and Branton D., Acc. Chem. Res. 35, 817 (2002). 10.1021/ar000138m [DOI] [PubMed] [Google Scholar]
- Maglia G., Restrepo M. R., Mikhailova E., and Bayley H., Proc. Natl. Acad. Sci. U.S.A. 105, 19720 (2008). 10.1073/pnas.0808296105 [DOI] [PMC free article] [PubMed] [Google Scholar]
- Murphy R. J. and Muthukumar M., J. Chem. Phys. 126, 051101 (2007). 10.1063/1.2435717 [DOI] [PubMed] [Google Scholar]
- Brun L., Pastoriza-Gallego M., Oukhaled G., Mathe J., Bacri L., Auvray L., and Pelta J., Phys. Rev. Lett. 100, 158302 (2008). 10.1103/PhysRevLett.100.158302 [DOI] [PubMed] [Google Scholar]
- Butler T. Z., Pavlenokb M., Derringtona I. M., Niederweisb M., and Gundlach J. H., Proc. Natl. Acad. Sci. U.S.A. 105, 20647 (2008). 10.1073/pnas.0807514106 [DOI] [PMC free article] [PubMed] [Google Scholar]
- Sung W. and Park P. J., Phys. Rev. Lett. 77, 783 (1996). 10.1103/PhysRevLett.77.783 [DOI] [PubMed] [Google Scholar]
- Muthukumar M., J. Chem. Phys. 111, 10371 (1999). 10.1063/1.480386 [DOI] [Google Scholar]
- Lubensky D. K. and Nelson D. R., Biophys. J. 77, 1824 (1999). 10.1016/S0006-3495(99)77027-X [DOI] [PMC free article] [PubMed] [Google Scholar]
- Slonkina E. and Kolomeisky A. B., J. Chem. Phys. 118, 7112 (2003). 10.1063/1.1560932 [DOI] [Google Scholar]
- Ambjörnsson T., Apell S. P., Konkoli Z., Di Marzio E. A., and Kasianowicz J. J., J. Chem. Phys. 117, 4063 (2002). 10.1063/1.1486208 [DOI] [Google Scholar]
- Mathe J., Aksimentiev A., Nelson D. R., Schulten K., and Meller A., Proc. Natl. Acad. Sci. U.S.A. 102, 12377 (2005). 10.1073/pnas.0502947102 [DOI] [PMC free article] [PubMed] [Google Scholar]
- Muthukumar M. and Kong C. Y., Proc. Natl. Acad. Sci. U.S.A. 103, 5273 (2006). 10.1073/pnas.0510725103 [DOI] [PMC free article] [PubMed] [Google Scholar]
- Song L. Z., Hobaugh M. R., Shustak C., Cheley S., Bayley H., and Gouaux J. E., Science 274, 1859 (1996). 10.1126/science.274.5294.1859 [DOI] [PubMed] [Google Scholar]
- Misakian M. and Kasianowicz J. J., J. Membr. Biol. 195, 137 (2003). 10.1007/s00232-003-0615-1 [DOI] [PubMed] [Google Scholar]
- Gu L. Q., Dalla Serra M., Vincent J. B., Vigh G., Cheley S., Braha O., and Bayley H., Proc. Natl. Acad. Sci. U.S.A. 97, 3959 (2000). 10.1073/pnas.97.8.3959 [DOI] [PMC free article] [PubMed] [Google Scholar]
- Gu L. Q., Cheley S., and Bayley H., J. Gen. Physiol. 118, 481 (2001). 10.1085/jgp.118.5.481 [DOI] [PMC free article] [PubMed] [Google Scholar]
- Gu L. Q., Cheley S., and Bayley H., Proc. Natl. Acad. Sci. U.S.A. 100, 15498 (2003). 10.1073/pnas.2531778100 [DOI] [PMC free article] [PubMed] [Google Scholar]
- Aksimentiev A. and Schulten K., Biophys. J. 88, 3745 (2005). 10.1529/biophysj.104.058727 [DOI] [PMC free article] [PubMed] [Google Scholar]
- Muthukumar M., J. Chem. Phys. 118, 5174 (2003). 10.1063/1.1553753 [DOI] [Google Scholar]
- Luo K., Ala-Nissila T., Ying S. C., and Bhattacharya A., Phys. Rev. Lett. 99, 148102 (2007). 10.1103/PhysRevLett.99.148102 [DOI] [PubMed] [Google Scholar]
- Hille B., Ionic Channels of Excitable Membranes, 2nd ed. (Sinauer Associates Inc., Sunderland, MA, 1992). [Google Scholar]
- Barry P. H. and Lynch J. W., J. Membr. Biol. 121, 101 (1991). 10.1007/BF01870526 [DOI] [PubMed] [Google Scholar]
- Hostetler P. B., Truesdell A. H., and Christ C. L., Science 155, 1537 (1967). 10.1126/science.155.3769.1537 [DOI] [PubMed] [Google Scholar]
- Gardiner C. W., Handbook of Stochastic Methods for Physics, Chemistry, and the Natural Sciences (Springer, New York, 1983). [Google Scholar]
- de Gennes P. G., Scaling Concepts in Polymer Physics (Cornell University Press, Ithaca, 1979). [Google Scholar]
- Grosberg A. Y. and Khokhlov A. R., Statistical Physics of Macromolecules, 1st ed. (American Institute of Physics, New York, 2002). [Google Scholar]
- Kong C. Y. and Muthukumar M., J. Chem. Phys. 120, 3460 (2004). 10.1063/1.1642588 [DOI] [PubMed] [Google Scholar]
- Cacciuto A. and Luijten E., Phys. Rev. Lett. 96, 238104 (2006). 10.1103/PhysRevLett.96.238104 [DOI] [PubMed] [Google Scholar]
- Kumar R. and Muthukumar M., J. Chem. Phys. 128, 184902 (2008). 10.1063/1.2917354 [DOI] [PMC free article] [PubMed] [Google Scholar]
- Chuang J., Kantor Y., and Kardar M., Phys. Rev. E 65, 011802 (2002). 10.1103/PhysRevE.65.011802 [DOI] [PubMed] [Google Scholar]
- Kantor Y. and Kardar M., Phys. Rev. E 69, 021806 (2004). 10.1103/PhysRevE.69.021806 [DOI] [PubMed] [Google Scholar]
- Dubbeldam J. L. A., Milchev A., Rostiashvili V. G., and Vilgis T. A., Europhys. Lett. 79, 18002 (2007). 10.1209/0295-5075/79/18002 [DOI] [Google Scholar]
- Panja D., Barkema G. T., and Ball R. C., J. Phys.: Condens. Matter 19, 432202 (2007). 10.1088/0953-8984/19/43/432202 [DOI] [Google Scholar]
- Doi M. and Edwards S. F., The Theory of Polymer Dynamics (Oxford University Press, Oxford, 1988). [Google Scholar]
- van Dorp S., Keyser U. F., Dekker N. H., Dekker C., and Lemay S. G., Nat. Phys. 5, 347 (2009). 10.1038/nphys1230 [DOI] [Google Scholar]
- Henrickson S. E., DiMarzio E. A., Wang Q., Stanford V. M., and Kasianowicz J. J., J. Chem. Phys. 132, 135101 (2010). 10.1063/1.3328875 [DOI] [PMC free article] [PubMed] [Google Scholar]
