SATB2 augments ΔNp63α in head and neck squamous cell carcinoma (original) (raw)
SATB2 augments ΔNp63α in head and neck squamous cell carcinoma
The transcription factor SATB2, preferentially expressed in advanced stage head and neck squamous cell carcinomas, promotes chemoresistance by enhancing ΔNp63α-mediated repression of pro-apoptotic p53-family target genes.
Keywords: apoptosis, chemotherapy, p63, SATB2, SCC
Abstract
ΔNp63α is a critical pro-survival protein overexpressed in 80% of head and neck squamous cell carcinomas (HNSCCs) where it inhibits TAp73β transcription of p53-family target genes, which is thought to increase HNSCC resistance to chemotherapy-induced cell death. However, the mechanisms governing ΔNp63α function are largely unknown. In this study, we identify special AT-rich-binding protein 2 (SATB2) as a new ΔNp63α-binding protein that is preferentially expressed in advanced-stage primary HNSCC and show that SATB2 promotes chemoresistance by enhancing ΔNp63α-mediated transrepression by augmenting ΔNp63α engagement to p53-family responsive elements. Furthermore, SATB2 expression positively correlates with HNSCC chemoresistance, and RNA interference-mediated knockdown of endogenous SATB2 re-sensitizes HNSCC cells to chemotherapy- and γ-irradiation-induced apoptosis, irrespective of p53 status. These findings unveil SATB2 as a pivotal modulator of ΔNp63α that governs HNSCC cell survival.
Introduction
p63 and p73 are members of the p53 family of proteins that encode multiple isoforms by alternative splicing or alternative promoter usage (Flores, 2007). The latter generates transactivation-competent (TA) or truncated, dominant-negative (ΔN) p63 and p73 that lack the amino (N)-terminal transactivation domain that is necessary for the induction of apoptosis and tumour suppression (Yang et al, 2002). ΔNp63 and ΔNp73 antagonize the activity of full-length TAp63 and TAp73, as well as p53, by forming abortive transcriptional tetramers that compete against TA–p53 family complexes for promoter-binding sites (Yang et al, 2002). In addition, ΔNp63 can directly activate transcription of genes involved in differentiation and development (Flores, 2007).
Unlike p53, p63 and p73 are rarely mutated or inactivated in human cancers. However, ΔNp63 and ΔNp73 are overexpressed in certain tumours, suggesting an oncogenic role for these truncated isoforms (Cam et al, 2006; Rocco et al, 2006). For example, the ΔNp63α isoform is specifically upregulated in stratified squamous cell carcinoma (SCC), including those found in the lung and cervix (Hibi et al, 2000; Deyoung & Ellisen, 2007). Perhaps the most well-studied model is SCC of the head and neck (HNSCC), in which ΔNp63α is upregulated in approximately 80% of cases (Hibi et al, 2000). Although the loss of p53 probably contributes to the malignant progression of HNSCC lesions (Forastiere et al, 2001), p53 is not inhibited by ΔNp63α in HNSCC (Rocco et al, 2006). Instead, ΔNp63α functions as an essential survival protein by specifically inhibiting the pro-apoptotic TAp73β—the predominant p73 isoform expressed in HNSCC—and by repressing the transcription of target genes, such as noxa and puma (Rocco et al, 2006). Notably, DNA-damaging chemotherapeutic drugs have been shown to trigger apoptosis, in part, by downregulating ΔNp63α in squamous epithelial and HNSCC cells (Zangen et al, 2005; Rocco et al, 2006). Furthermore, forced expression of ΔNp63α promotes chemoresistance, suggesting that ΔNp63α activity is a critical determinant of drug responsiveness (Sun et al, 2009). Although the vast majority of HNSCCs highly express ΔNp63α, these tumours vary in their susceptibility to treatment modalities, indicating that unidentified pathways exist that influence ΔNp63α function and cell survival (Hibi et al, 2000).
Special AT-rich-binding protein 2 (SATB2) is a member of the SATB family of transcription factors that was first identified in mammals as a gene involved in palatogenesis and craniofacial morphogenesis (Dobreva et al, 2006). In addition to important roles in development, recent evidence suggests that SATB member proteins might have significant roles in cancer biology (Han et al, 2008). The SATB2 homologue, SATB1, is overexpressed in a subset of breast cancers that exhibit increased invasiveness and more readily form xenograft tumours (Han et al, 2008). This homologue, SATB1, regulates the expression of specific sets of genes involved in breast cancer metastasis, including erbB2 and mmp3 (Han et al, 2008), and high SATB1 levels are associated with poor prognosis in breast tumours (Han et al, 2008). Similar to SATB1, SATB2 binds to AT-rich sequences in nuclear matrix attachment regions and regulates gene expression by arranging chromatin packing and organization (Dobreva et al, 2003, 2006). In addition, SATB2 can indirectly affect gene transcription by augmenting the activity of other transcription factors, such as Runx2 and activating transcription factor 4 (Dobreva et al, 2006), which suggests that SATB2 can mediate downstream target gene expression independently of its matrix attachment region-binding capability. However, the role of SATB2 in cancer is unclear. In this study, we identify SATB2 as the first modulator of p63 and provide evidence supporting the role of SATB2 in the determination of HNSCC chemotherapy sensitivity.
Results And Discussion
SATB2 is expressed in HNSCC cells
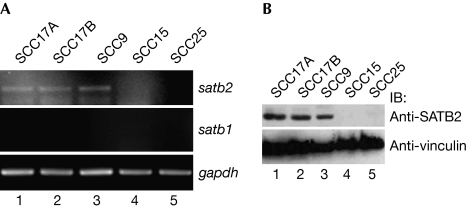
To identify proteins that interact with p63α and p73α, SaOs-2 osteosarcoma cells stably expressing T7-tagged carboxy (C)-terminal regions of p63α and p73α were immunoprecipitated with T7 antibody. Mass spectroscopy identified SATB2 as a 100-kDa co-precipitating protein (data not shown). satb2 transcripts were not expressed ubiquitously across multiple cell lines of different tissue, but were present in a subset of HNSCC cells (Fig 1A; data not shown). By contrast, satb1 transcripts were not detected in any HNSCC cell lines tested through reverse transcriptase (RT)–PCR (Fig 1A; supplementary Fig S1A online). We next generated two polyclonal SATB2-specific antibodies (supplementary Fig S1B online), and determined that SATB2, but not SATB1, protein is expressed in HNSCC cell lines, which also expressed satb2 transcript (Fig 1B; supplementary Fig S1C,D online). These results demonstrate that SATB2 is expressed in a subset of HNSCC-derived cell lines.
Figure 1.
Special AT-rich-binding protein 2 is expressed in a subset of HNSCC cells. (A) RT–PCR was performed on total RNA from the indicated HNSCC cell lines using the indicated primers. (B) SATB2 immunoblotting was performed on HNSCC whole-cell lysates. HNSCC, head and neck squamous cell carcinoma; RT–PCR, reverse transcriptase PCR; SATB2, special AT-rich-binding protein 2.
SATB2 is upregulated in advanced HNSCC tumours
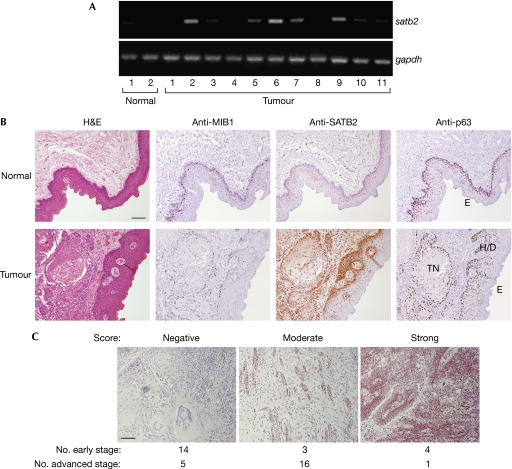
We asked whether SATB2 was upregulated in patient-derived HNSCC tumour specimens. Approximately 50% of the tumour samples showed elevated satb2 in comparison with non-neoplastic squamous epithelial samples, as determined by RT–PCR (Fig 2A). Consistent with the messenger RNA (mRNA) expression data, immunohistochemistry performed on sections derived from multiple sites, including the tongue (19), floor of the mouth (7), buccal mucosa (3) and gingiva (5), revealed negative SATB2 staining in normal squamous epithelium, whereas tumour tissues stained positively for SATB2 (Fig 2B). In the majority of samples tested, SATB2 was detected in both nuclear and cytoplasmic compartments of tumour cells and, interestingly, hyperplastic and dysplastic tissues displayed the most prominent nuclear SATB2 staining (Fig 2B). Positive anti-MIB1 staining, an antibody that detects the Ki67 proliferation marker, correlated with the most intense SATB2 and p63 staining (Fig 2B). Decreased levels of SATB2 were observed in tumour nests exhibiting more differentiated, keratinizing phenotypes and in the outer squamous epithelial layer (Fig 2B). In addition, SATB2 was most prominently expressed in the majority (17 of 22) of tongue HNSCC tumours with advanced pathological staging, whereas only a minority (7 of 21) of lower-stage tumours showed elevated SATB2 expression (χ2=8.88, d.f.=2, P<0.05; Fig 2C; supplementary Tables S1, S2 online). Notably, all 43 tumours showed positive p63 staining using a pan-p63 antibody, as ΔN-isoform-specific antibodies are not available for immunohistochemistry (data not shown).
Figure 2.
Special AT-rich-binding protein 2 transcript and protein are detected in primary HNSCC tumours. (A) One microgram of total RNA isolated from HNSCC primary tumours (all of which are at advanced stage with the exception of tumour 6, which was early stage) was used for semi-quantitative RT–PCR using the indicated primers. (B) Representative paraffin-embedded human tongue HNSCC sections were stained with haematoxylin and eosin (top panels) and the indicated antibodies. (C) Forty-three tongue tumour specimens immunostained with SATB2-C-terminal antibody were scored as negative, moderate or strong. The numbers of early- and advanced-stage specimens are indicated under the representative images of each scoring category. Scale bar, 100 μm. E, outer squamous epithelium; H/D, hyperplastic and dysplastic; HNSCC, head and neck squamous cell carcinoma; RT–PCR, reverse transcriptase PCR; SATB2, special AT-rich-binding protein 2; TN, tumour nests.
ΔNp63α and SATB2 form a stable complex in vivo
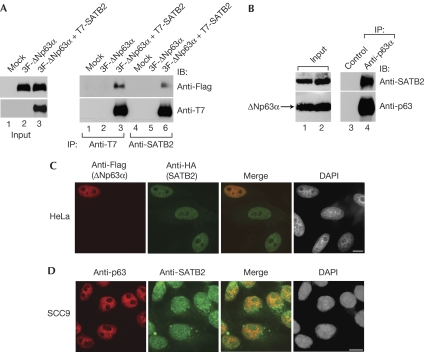
As ΔNp63α is a critical pro-survival protein that is commonly overexpressed in HNSCC (Rocco et al, 2006), and we show that overlapping staining patterns of SATB2 and ΔNp63α in HNSCC (Fig 2B), we asked whether SATB2 associates physically with ΔNp63α. Flag-ΔNp63α specifically precipitated with T7-SATB2 (Fig 3A), as well as endogenous SATB2 (supplementary Fig S2A online). In addition, T7-SATB2 precipitated with Flag-TAp63α, but not TAp73β (supplementary Fig S2B online; data not shown). Notably, a complex between SATB1 and p63α was not observed in similar assays (supplementary Fig S2C,D online).
Figure 3.
ΔNp63α and special AT-rich-binding protein 2 form a molecular complex in vivo. (A) HEK293 cells transiently transfected with the indicated expression plasmids were lysed and immunoprecipitated with the indicated antibodies. This was followed by anti-Flag immunoblotting. (B) SCC17A (p53 wild-type) lysates were immunoprecipitated and analysed by using immunoblotting with the indicated antibodies. (C) Transiently transfected HeLa cells were fixed and analysed by using confocal fluorescence microscopy with the indicated antibodies. (D) SCC9 (p53 mutant) cells were stained with the indicated antibodies and DAPI, and visualized using confocal fluorescence microscopy. Scale bar, 10 μm. DAPI, 4',6-diamidino-2-phenylindole; HEK, human embryonic kidney; IB, immunoblotting; IP, immunoprecipitation; SATB2, special AT-rich-binding protein 2; SCC, squamous cell carcinoma.
We next asked whether ΔNp63α interacted physically with SATB2 under physiological conditions and observed that endogenous SATB2 specifically precipitated with ΔNp63α in HNSCC cells (Fig 3B; supplementary Fig S1E online; Rocco et al, 2006). Furthermore, haemagglutinin–SATB2 and Flag–ΔNp63α expressed in HeLa cells, as well as endogenous ΔNp63α and SATB2 in SCC9 cells, co-localized in the nucleus, as shown by confocal immunofluorescence analysis (Fig 3C,D, respectively). These results suggest that ΔNp63α and SATB2 form a stable complex in vivo.
ΔNp63α recruits SATB2 to promoters
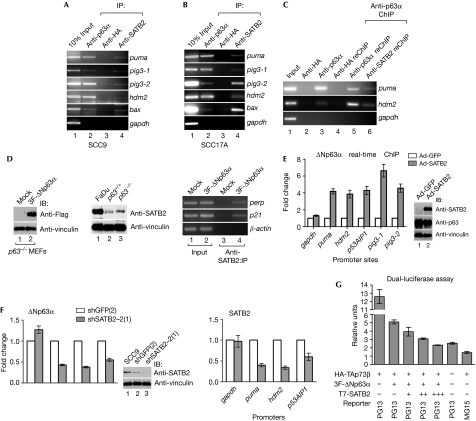
We next performed chromatin immunoprecipitation (ChIP) analysis by using SCC9 (p53 mutant) cells and SCC17A (p53 wild-type) cells to address whether SATB2 localizes to the _cis_-acting DNA elements of p53-family target genes. Endogenous SATB2 localized on p53-family responsive elements recognized by ΔNp63α, including puma, pig3-1, pig3-2, hdm2, bax and perp (Fig 4A,B; supplementary Fig S3A online). Sequential ChIP:reChIP analysis showed that endogenous ΔNp63α and SATB2 co-localized on puma and hdm2 promoters, but not on the non-p53 gapdh promoter (Fig 4C). Furthermore, SATB2 was only detected on target gene promoters in HCT116 (_p53_−/−) cells, which also lack p63 expression, in the presence of ectopic ΔNp63α expression (supplementary Fig S3B online). In addition, analysis of the indicated p53-family target genes using an algorithm designed to identify SATB-family DNA-binding consensus did not reveal any SATB-binding sites within 2 kb of the p53-family responsive elements (data not shown). A 2-kb interval was used in our analysis because the resolution of our ChIP analysis was less than 1 kb (data not shown). Notably, the algorithm reliably predicted SATB-family consensus sequences previously identified in the promoters of genes, such as mmp3 and cldn1 (Han et al, 2008; data not shown). Previous research has shown that SATB2 might regulate gene expression indirectly by interacting with other transcription factors, such as Runx2 and activating transcription factor 4 (Dobreva et al, 2006). Our results, here, suggest that SATB2 might function similarly and is recruited by ΔNp63α to p53-family target promoter regions. In accord, ChIP analysis using primary _p63_−/− mouse embryonic fibroblasts showed that endogenous SATB2 readily localized on the murine p21 and perp promoters only in the presence of Flag-ΔNp63α (Fig 4D). Although direct comparison with p63+/+ mouse embryonic fibroblasts was not feasible with available reagents due to low basal endogenous ΔNp63α levels, endogenous SATB2 was detected on the perp promoter in p63+/+ murine brain lysates (supplementary Fig S3A online).
Figure 4.
Special AT-rich-binding protein 2 engages p53-family promoters through ΔNp63α and augments ΔNp63α-mediated transrepression. (A,B) SCC9 (p53 mutant) and SCC17A (p53 wild-type) cells were analysed by using ChIP with indicated antibodies, and PCR was performed using p53-family responsive-element-specific primers for the indicated genes. (C) Sequential ChIP:reChIP was performed on SCC17A cells using the indicated antibodies. (D) SATB2 ChIP analysis was performed on _p63_−/− MEFs transfected with the indicated plasmids using primers specific for p53-family responsive elements targeting murine promoters (bottom panel). Levels of ΔNp63α and endogenous SATB2 were confirmed in _p63_−/− and p63+/+ MEFs (FaDu SCC cells are positive control; top right panel). (E) Real-time ΔNp63α ChIP analysis was performed on HaCat cells infected with adenoviruses (Ad) encoding GFP (open bars) or SATB2 (grey bars) using primers for p53-family responsive elements in the indicated promoters. Results were normalized to the gapdh promoter input. Representative experiments (mean±s.d.) performed three independent times in quadruplicate are shown. The expression of endogenous ΔNp63α and Ad-transduced SATB2 was confirmed through western blot analysis (right panels). (F) Real-time ΔNp63α ChIP analysis was performed on SCC9 cells stably expressing shGFP (clone 2) (open bars) or shSATB2-2 (clone 1) (grey bars). Results were normalized to the input level of each individual gene promoter. The graph shows data from one representative experiment (mean±s.d.). (G) ΔNp63α-mediated inhibition of TAp73β was analysed by performing PG13-luciferase assays on HCT116-_p53_−/− cells transfected with various combinations of HA-TAp73β and 3F-ΔNp63α with increasing amounts of T7-SATB2 (0.024, 0.24 and 2.4 μg). A representative experiment performed in triplicate is shown (mean±s.d.). ChIP, chromatin immunoprecipitation; GFP, green fluorescent protein; HA, haemagglutinin; MEF, mouse embryonic fibroblast; SATB2, special AT-rich-binding protein 2; SCC, squamous cell carcinoma; sh, short hairpin; WT, wild type.
We next asked whether SATB2 influences the ability of ΔNp63α to bind to p53-family responsive elements. HaCat cells, which express no detectable SATB2 transcript or protein (Fig 4E, right panel; data not shown), were transduced with adenovirus-expressing green fluorescent protein (Ad-GFP) or SATB2 (Ad-SATB2). Real-time ChIP analysis showed that SATB2 significantly increased the engagement of ΔNp63α on several indicated p53-family responsive elements (Fig 4E). Conversely, SCC9 cells with stable knockdown of endogenous SATB2 exhibited markedly reduced ΔNp63α and SATB2 binding to p53-family target gene promoters (Fig 4F). SATB2 did not affect ΔNp63α stability (supplementary Fig S4A,B online), suggesting that the effect of SATB2 on ΔNp63α DNA binding was not due to changes in ΔNp63α expression level. Furthermore, SATB2 enhanced the ability of ΔNp63α to inhibit TAp73β-mediated PG13 (13 contiguous p53-family responsive elements) reporter activation in HCT116 (_p53_−/−) colon and H1299 (_p53_−/−) lung adenocarcinoma cells in a dosage-dependent manner (Fig 4G; data not shown, respectively). These results suggest that SATB2 promotes the binding of ΔNp63α to p53-family target gene promoters to repress gene expression.
SATB2 promotes chemoresistance in HNSCC
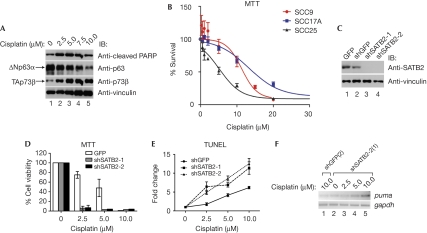
ΔNp63α and TAp73β have critical roles in HNSCC cell survival and chemosensitivity irrespective of p53 status (Zangen et al, 2005; Rocco et al, 2006). Consistent with these findings, cisplatin—one of the chemotherapeutic agents commonly used in the treatment of HNSCC—induced downregulation of ΔNp63α and concomitant induction of TAp73β, and cleaved poly (ADP-ribose) polymerase, a marker of apoptosis, in SCC9 and other HNSCC cell lines (Fig 5A; data not shown). We show here that SATB2 augments the recruitment of ΔNp63α to p53-family target gene promoters and that SATB2 is frequently overexpressed in advanced HNSCCs that are typically more chemoresistant. Thus, we asked whether SATB2 expression correlated with HNSCC chemosensitivity. The SCC25 cells that do not exhibit SATB2 expression were more sensitive to cisplatin and displayed lower survival levels and lethal dose 50 (LD50) values over a range of doses correspondingly lower than SATB2-expressing SCC9 and SCC17A cells (Fig 5B; Table 1). Interestingly, SCC17A and SCC9 cells had similar LD50 values, indicating that p53 status is not a strong indicator of cisplatin responsiveness (Table 1).
Figure 5.
Special AT-rich-binding protein 2 promotes radioresistance and chemoresistance of HNSCC cells. (A) SCC9 (p53 mutant) cells treated with cisplatin were subjected to cleaved-PARP, p63 and p73β immunoblotting. (B) MTT assay was performed on SATB2-positive SCC9 (circles) and SCC17A (squares) cells, and SATB2-negative SCC25 cells (triangles) treated with cisplatin. Data from one representative experiment are shown (_n_=3, mean±s.d.). (C) Lysates of SCC9 cells transiently infected with GFP-, shGFP- or SATB2-specific shRNAs (shSATB2-1 and -2) lentiviruses were lysed and analysed by immunoblotting. (D) MTT assay was performed on cisplatin-treated SCC9 cells infected with GFP (open bars), shSATB2-1 (grey bars) or shSATB2-2 (black bars) lentiviruses and scored relative to untreated cells. Error bars represent mean±s.d. from four data points in a representative experiment. (E) Indicated lentivirus-infected SCC9 cells treated with cisplatin were analysed by TUNEL staining. Fold changes were normalized to the untreated cells. Error bars represent mean±s.d. from five fields of view of a representative experiment. (F) Stable SCC9 cells expressing the indicated shRNAs were treated with indicated cisplatin doses and semi-quantitative RT–PCR was performed with the indicated primers. GFP, green fluorescent protein; HNSCC, head and neck squamous cell carcinoma; MTT, 3-(4,5-dimethylthiazol-2-yl)-2,5-diphenyltetrazolium bromide; RT–PCR, reverse transcriptase PCR; SATB2, special AT-rich-binding protein 2; SCC, squamous cell carcinoma; shRNA, short hairpin RNA; TUNEL, terminal deoxynucleotidyl transferase-mediated dUTP-biotin nick end labelling.
Table 1. LD50 values for HNSCC cell lines with varying SATB2 expression.
| Cell line | p53 status | SATB2 expression | LD50 (μM)* |
|---|---|---|---|
| SCC9 | Mutant | Positive | 11.6±0.2 |
| SCC17A | Wild type | Positive | 11.8±0.8 |
| SCC25 | Mutant | Negative | 6.6±0.8 |
| *Mean±s.e.m., _n_=3. | |||
| Abbreviations: HNSCC, head and neck squamous cell carcinoma; LD50, lethal dose 50; SATB2, special AT-rich-binding protein 2. |
We next asked whether SATB2 directly promoted chemoresistance. The SCC9 and SCC17A cells with SATB2 knockdown through lentivirus-expressing SATB2-specific short hairpin RNA or small interfering RNA transfection, respectively, were much more susceptible to cisplatin-induced death in comparison with SCC9 cells infected with GFP- or shGFP-expressing lentiviruses, which had only modest, non-specific effects on protein expression, including SATB2 (Fig 5C–E; data not shown). Furthermore, SATB2 knockdown in SCC9 cells decreased viability in response to 5-fluorouracil and γ-irradiation in comparison with control SCC9 cells (supplementary Fig S5A,B online). We therefore hypothesized that a reduction in SATB2 levels would compromise ΔNp63α transrepression activity and consequently lead to TAp73β-mediated transactivation of apoptotic genes. Consistent with this idea, cisplatin treatment of SCC9 cells with stable knockdown of SATB2 showed enhanced levels of puma, noxa and Bax as compared with cells expressing SATB2 (Fig 5F; supplementary Fig S5C,D online). These results demonstrate that SATB2 enhances cell survival in the presence of radiation and chemotherapeutic agents.
SATB2 has an important role in development (Dobreva et al, 2006; Alcamo et al, 2008). However, a role for SATB2 in cancer or apoptosis has not, until now, been described. In the progression model of HNSCC, dysplasia and hyperplasia represent precursor lesions that progress, on accumulation of additional genetic alterations, into malignant and invasive carcinomas (Forastiere et al, 2001). The prominent expression of SATB2 observed in hyperplastic/dysplastic regions suggests that SATB2 overexpression constitutes an early step in oncogenesis, similar to the role of SATB1 in breast cancer (Forastiere et al, 2001; Han et al, 2008). This idea is consistent with the highly proliferative, undifferentiated, non-keratinizing cells located at the periphery of tumour nests showing the most intense SATB2 staining in comparison with more differentiated, keratinizing nests often displaying negligible SATB2 staining. Interestingly, downregulation of SATB2 and ΔNp63 during differentiation of primary keratinocytes has been reported (Pozzi et al, 2009). Our findings that SATB2 is preferentially expressed in advanced HNSCC tumours and has modulatory effects on the p53-family protein, ΔNp63α, help to explain the resistance of late-stage HNSCC to common cancer treatments. In addition to primary tumour data, the use of multiple cancer cell lines and primary cells highlights the physiological significance of our results. DeYoung et al (2006) have shown that, in contrast to normal keratinocytes, HNSCC cells are uniquely dependent on ΔNp63α for survival, which further supports ΔNp63α and modulators, such as SATB2, that augment ΔNp63α-anti-apoptotic function as new therapeutic targets. Ultimately, drugs targeting key players in p53-family signalling pathways might translate into improved therapies and prognoses for patients with advanced-stage HNSCC and other cancers that exploit the p63/p73 network (Deyoung & Ellisen, 2007; Leong et al, 2007).
Methods
Immunohistochemistry. Research Ethics Board Approval at University Health Network (Toronto) was obtained for tumour analyses. Immunohistochemistry was performed as previously described (Dos Reis et al, 2008). The SATB2 staining intensity was scored as previously described for SATB1 (Han et al, 2008) with modifications (see supplementary information online).
RT–PCR. A total of 1 μg of total RNA, isolated using the RNeasy kit (Qiagen, Germantown, MD, USA), was used for reverse transcription with the Omniscript RT kit (Qiagen). The PCR amplification was performed as described under ChIP with an annealing temperature of 55°C except for puma (60°C) and noxa (50°C). See supplementary information online for primer sequences and expected PCR product sizes.
Dual-Luciferase, MTT and TUNEL assays. Luciferase assays were performed using the Dual-Luciferase Reporter Assay System (Promega, Madison, WI, USA) according to the manufacturer's instructions. At 3 days after infection, cells were seeded (8.0 × 10³–1.0 × 10⁴ cells per well) in 96-well plates and, 24 h later, treated with the indicated drugs for 48 h in quadruplicate. 3-(4,5-dimethylthiazol-2-yl)-2,5-diphenyltetrazolium bromide (MTT) cell proliferation assay (Roche Applied Science, Brandford, CT, USA) was carried out according to the manufacturer's instructions. Data analysis was carried out using GraphPad Prism 5.0 (GraphPad Software, La Jolla, CA, USA; mean±s.e.m., _n_=3). After infection, SCC9 cells were seeded (5.0 × 10⁴ cells per well) in a 12-well plate. 137Cesium was used as a γ-irradiation source and, 48 h later, affixed onto Shandon Double Coated Cytoslides (Thermo Scientific Corporation, Waltham, MA, USA). Terminal deoxynucleotidyl transferase-mediated dUTP-biotin nick end labelling (TUNEL) staining was performed using the DeadEnd Fluorometric TUNEL System (Promega). Percentage apoptosis was scored by dividing the number of green, TUNEL-positive nuclei by the total number of 4',6-diamidino-2-phenylindole-stained nuclei (five fields of view per experiment, _n_=3).
See supplementary information online for additional materials and methods.
Supplementary information is available at EMBO reports online (http://www.emboreports.org).
Supplementary Material
Supplementary Information
Acknowledgments
This study was supported by funds from Canadian Cancer Society (018054) and the Cancer Research Society. J.C. is a recipient of a Doctoral Canada Graduate Scholarship from Canadian Institutes of Health Research. M.O., D.R.K. and M.S.I. are Canada Research Chairs. We thank A. Marzotto for assistance with the development of SATB DNA-binding sites algorithm.
Footnotes
The authors declare that they have no conflict of interest.
References
- Alcamo EA, Chirivella L, Dautzenberg M, Dobreva G, Farinas I, Grosschedl R, McConnell SK (2008) Satb2 regulates callosal projection neuron identity in the developing cerebral cortex. Neuron 57: 364–377 [DOI] [PubMed] [Google Scholar]
- Cam H et al. (2006) p53 family members in myogenic differentiation and rhabdomyosarcoma development. Cancer Cell 10: 281–293 [DOI] [PubMed] [Google Scholar]
- Deyoung MP, Ellisen LW (2007) p63 and p73 in human cancer: defining the network. Oncogene 26: 5169–5183 [DOI] [PubMed] [Google Scholar]
- DeYoung MP, Johannessen CM, Leong CO, Faquin W, Rocco JW, Ellisen LW (2006) Tumor-specific p73 up-regulation mediates p63 dependence in squamous cell carcinoma. Cancer Res 66: 9362–9368 [DOI] [PubMed] [Google Scholar]
- Dobreva G, Dambacher J, Grosschedl R (2003) SUMO modification of a novel MAR-binding protein, SATB2, modulates immunoglobulin mu gene expression. Genes Dev 17: 3048–3061 [DOI] [PMC free article] [PubMed] [Google Scholar]
- Dobreva G, Chahrour M, Dautzenberg M, Chirivella L, Kanzler B, Farinas I, Karsenty G, Grosschedl R (2006) SATB2 is a multifunctional determinant of craniofacial patterning and osteoblast differentiation. Cell 125: 971–986 [DOI] [PubMed] [Google Scholar]
- Dos Reis PP, Bharadwaj RR, Machado J, Macmillan C, Pintilie M, Sukhai MA, Perez-Ordonez B, Gullane P, Irish J, Kamel-Reid S (2008) Claudin 1 overexpression increases invasion and is associated with aggressive histological features in oral squamous cell carcinoma. Cancer 113: 3169–3180 [DOI] [PubMed] [Google Scholar]
- Flores ER (2007) The roles of p63 in cancer. Cell Cycle 6: 300–304 [DOI] [PubMed] [Google Scholar]
- Forastiere A, Koch W, Trotti A, Sidransky D (2001) Head and neck cancer. N Engl J Med 345: 1890–1900 [DOI] [PubMed] [Google Scholar]
- Han HJ, Russo J, Kohwi Y, Kohwi-Shigematsu T (2008) SATB1 reprogrammes gene expression to promote breast tumour growth and metastasis. Nature 452: 187–193 [DOI] [PubMed] [Google Scholar]
- Hibi K, Trink B, Patturajan M, Westra WH, Caballero OL, Hill DE, Ratovitski EA, Jen J, Sidransky D (2000) AIS is an oncogene amplified in squamous cell carcinoma. Proc Natl Acad Sci USA 97: 5462–5467 [DOI] [PMC free article] [PubMed] [Google Scholar]
- Leong CO, Vidnovic N, DeYoung MP, Sgroi D, Ellisen LW (2007) The p63/p73 network mediates chemosensitivity to cisplatin in a biologically defined subset of primary breast cancers. J Clin Invest 117: 1370–1380 [DOI] [PMC free article] [PubMed] [Google Scholar]
- Pozzi S, Zambelli F, Merico D, Pavesi G, Robert A, Maltere P, Gidrol X, Mantovani R, Vigano MA (2009) Transcriptional network of p63 in human keratinocytes. PloS One 4: e5008. [DOI] [PMC free article] [PubMed] [Google Scholar]
- Rocco JW, Leong CO, Kuperwasser N, DeYoung MP, Ellisen LW (2006) p63 mediates survival in squamous cell carcinoma by suppression of p73-dependent apoptosis. Cancer Cell 9: 45–56 [DOI] [PubMed] [Google Scholar]
- Sun Q, Ming L, Thomas SM, Wang Y, Chen ZG, Ferris RL, Grandis JR, Zhang L, Yu J (2009) PUMA mediates EGFR tyrosine kinase inhibitor-induced apoptosis in head and neck cancer cells. Oncogene 28: 2348–2357 [DOI] [PMC free article] [PubMed] [Google Scholar]
- Yang A, Kaghad M, Caput D, McKeon F (2002) On the shoulders of giants: p63, p73 and the rise of p53. Trends Genet 18: 90–95 [DOI] [PubMed] [Google Scholar]
- Zangen R, Ratovitski E, Sidransky D (2005) DeltaNp63alpha levels correlate with clinical tumor response to cisplatin. Cell Cycle 4: 1313–1315 [DOI] [PubMed] [Google Scholar]
Associated Data
This section collects any data citations, data availability statements, or supplementary materials included in this article.
Supplementary Materials
Supplementary Information
