Gene optimization mechanisms: A multi-gene study reveals a high success rate of full-length human proteins expressed in Escherichia coli (original) (raw)
Abstract
The genetic code is universal, but recombinant protein expression in heterologous systems is often hampered by divergent codon usage. Here, we demonstrate that reprogramming by standardized multi-parameter gene optimization software and de novo gene synthesis is a suitable general strategy to improve heterologous protein expression. This study compares expression levels of 94 full-length human wt and sequence-optimized genes coding for pharmaceutically important proteins such as kinases and membrane proteins in E. coli. Fluorescence-based quantification revealed increased protein yields for 70% of in vivo expressed optimized genes compared to the wt DNA sequences and also resulted in increased amounts of protein that can be purified. The improvement in transgene expression correlated with higher mRNA levels in our analyzed examples. In all cases tested, expression levels using wt genes in tRNA-supplemented bacterial strains were outperformed by optimized genes expressed in non-supplemented host cells.
Keywords: synthetic genes, gene optimization, heterologous protein expression, fluorescence-based quantification, codon usage, recombinant proteins
Introduction
Escherichia coli (E. coli) is the most commonly used system for production of recombinant human proteins. Despite its known limitation in protein folding and its inability to perform certain post-translational modifications, proteins expressed in and purified from E. coli are widely used as research tools, for example, in proteomics for various functional and structural analyses or as biopharmaceuticals.1,2 Reasons for choosing E. coli as an expression host are its fast growth and its well understood genetics which offers an unmatched toolbox for genetic engineering. However, high-level and reliable transgene expression in in vivo and cell-free E. coli expression systems is often hampered by the presence of non-frequently used codons within the gene-coding region. There is a strong correlation between the availability of tRNAs and the frequency their respective codon is used by the expressing host.3 Codons not favoured by E. coli are for example, AGG and AGA which both code for Arginine and frequently occur in human genes. A strategy to overcome expression limitations caused by non-preferred codons is to co-express certain tRNAs. Although co-expression of selected tRNAs can overcome expression problems to some extend due to the presence of extremely rare codons, it has been reported that best and most consistent expression of a malaria protein has been achieved only by consequently adapting the entire gene to most frequently used E. coli codons.4 In addition to codon choice and tRNA availability, other sequence-based factors influence expression yields, for example, the presence of an 8 base pair stem loop structure near the Shine-Dalgarno ribosomal entry site5 and the AU-content of the mRNA.6,7 The presence of intragenic sequences mimicking E. coli ribosomal entry sites, as found in many mammalian genes, may lead to truncated products during heterologous expression8 and should be avoided. Therefore, sequence optimization has to be balanced between introducing frequently used codons and avoiding mRNA secondary structures, extreme GC-content and DNA motifs such as internal ribosomal entry sites for which usually elaborated software is necessary.9 Only true multi-parameter algorithms allowing weighted and paralleled optimization of local sequence features without limitations regarding the analyzed sequence space will allow consistent and reproducible results.9,10
Rational gene optimization in conjunction with de novo gene synthesis has been shown to enhance transgene expression in various host cells and in numerous examples.11–16 However, these studies were limited to few and randomly selected proteins or a single protein family (short chain dehydrogenases/reductases)11 and therefore do not provide systematic insight into the potential of using codon-optimized sequences in heterologous transgene expression. Accordingly, it is still unclear whether the use of rationally designed synthetic genes can generate expression templates that are generally superior to cloned cDNA's in terms of (i) availability, (ii) quality as well as (iii) reliability and (iv) level of expression, and all this over a representative range of protein classes. To address these issues, genes from five important functional groups of the human proteome have been selected for this study, comprising (i) RNA polymerases and ribosomal subunits, (ii) polypeptides involved in transcription, (iii) protein kinases, (iv) GPCR's and other membrane proteins, as well as (v) cytokines and chemokines. Altogether, 100 full-length human reading frames have been optimized for expression in E. coli for subsequent comparison with the corresponding wt genes. The optimized reading frames were synthesized de novo and the respective wt cDNAs were retrieved from public clone selections where available or likewise synthesized de novo. To facilitate the comparative analysis, all genes were placed under the transcriptional control of the T7 promoter and fused to the 3′ end of a 5′-[6x Histidine] tag. All selected genes encoded for the same amino acid sequence as it can be retrieved from the NCBI EntrezGene database. This is the largest comparative study conducted so far on expression of wt and optimized genes analyzing different sets of protein classes with regard to enhanced expression yield and underlying mechanism for this enhancement.
Results
RNA and codon optimization strategy
The degeneration of the genetic code and the possibility to use synonymous codons provide a powerful tool to circumvent limitations of recombinant expression. However, the sequence space encoding even small peptides is so vast that efficient software algorithms are necessary to identify the putative best sequence encoding the very same native protein as the wt sequence. Here, we used a sliding combination window (7 codons) in which any possible sequence encoding the same peptide as the respective wt sequence is generated.17 Each sequence was analyzed regarding the following parameters: codon quality, GC-content, DNA motifs like ribosomal entry sites and probability to form stable mRNA secondary structures. By a weighted scoring and penalty system the ideal sequence was automatically identified within the given window. By sliding this window from the 5′ end towards the 3′ end, the optimized full-length sequence was generated without limiting the analyzed sequence space by random generators as Monte Carlo approaches would do.
Multi-gene study: Gene selection and synthesis
In the multi-gene study presented here, in vivo expression levels of wt and sequence-optimized human genes were analyzed in E. coli. 100 proteins were chosen comprising a peer group of candidates from five important protein classes within the human proteome: transcription factors, RNA polymerases and ribosomal subunits, protein kinases, membrane proteins and cytokines as secreted proteins. Our study included 45 proteins of more than 50 kDa whereas eleven candidates covered a mass of 100 to 264 kDa. Furthermore, membrane proteins which are difficult to express represent the second largest category within this study (28 members). For reasons of comparability, we expressed every wt and sequence-optimized construct under standardized conditions only, without pursuing systematic domain or tag screenings or any other optimization efforts. All analyzed genes are summarized in Table I and all sequences are listed in Supporting Information Table I. Due to unavailability at public clone selections (e.g., RZPD, geneservice), nonsilent mutations and difficulties with cloning, only 34 out of 100 wt clones were successfully cloned by performing PCR on cDNAs as a template (Table I). Thus, 66 of 100 wt genes also needed to be synthesized de novo. Synthesis of 6 wt genes (Gene Bank Acc. No's NM_002011, NM_002576, NM_002577, NM_005760, NM_022451 and NM_014233) was impossible, since in these cases PCR and/or oligonucleotide assembly failed repeatedly due to unfavorable sequence composition and therefore had to be excluded from the side-by-side expression comparison study. In contrast, 99 optimized genes encoding the selected panel of proteins could be synthesized successfully, as we could make use of the relative freedom of sequence design. If annotated in the NCBI database as cleavable, sequences representing signal peptides were omitted for expression of mature human proteins in E. coli.
Tabel I.
Side-by-Side Comparison of 100 wt and Sequence-Optimized Human Genes
| Ref_seq. | Name | Protein size (kDa) | Wild-type construct correct and commercially available | Optimized construct available upon de novo synthesis | ratio total expression (opt/wt) |
|---|---|---|---|---|---|
| Kinases | |||||
| NM_002648 | Pim-1 oncogene (PIM1) | 35.6 | ✓ | ✓ | 1.65 ▴ |
| NM_006875 | Pim-2 oncogene (PIM2) | 34.2 | ✓ | ✓ | 1.29 ▴ |
| NM_001001852 | Pim-3 oncogene (PIM3) | 35.8 | ✓ | 5.79 ▴ | |
| NM_003668 | Mitogen-activated protein kinase-activated protein kinase 5 (MAPKAPK5) | 54.2 | ✓ | ✓ | 2.77▴ |
| NM_025195 | Tribbles homolog 1 (Drosophila) (TRIB1) | 41 | ✓ | ✓ | 0.83▾ |
| NM_004972 | Janus kinase 2 (JAK2) | 130 | ✓ | 11.51▴ | |
| NM_002037 | FYN oncogene related to SRC, FGR, YES (FYN) | 60.7 | ✓ | ✓ | 0.96▸ |
| NM_002110 | Hemopoietic cell kinase (HCK) | 59.6 | ✓ | 1.21▴ | |
| NM_005356 | Lymphocyte-specific protein tyrosine kinase (LCK) | 58 | ✓ | 0.41▾ | |
| NM_002011 | Fibroblast growth factor receptor 4 (FGFR4) | 87.9 | ✓* | / | |
| NM_002019 | Fms-related tyrosine kinase 1 (FLT1) | 150.7 | ✓ | 0 | |
| NM_005163 | v-akt murine thymoma viral oncogene homolog 1 (AKT1) | 55.6 | ✓ | ✓ | 0.10▾ |
| NM_003161 | Ribosomal protein S6 kinase, 70kDa, polypeptide 1 (S6K) | 59.1 | ✓ | 11.01▴ | |
| NM_005627 | Serum/glucocorticoid regulated kinase 1 (SGK1) | 48.9 | ✓ | ✓ | 3.76▴ |
| NM_005308 | G protein-coupled receptor kinase 5 (GPRK5) | 67.7 | ✓ | ✓ | 1.17▴ |
| NM_004333 | v-raf murine sarcoma viral oncogene homolog B1 (BRAF1) | 84.4 | ✓ | 0 | |
| NM_002880 | v-raf-1 murine leukemia viral oncogene homolog 1 (c-Raf) | 73 | ✓ | ✓ | 1,47▴ |
| NM_002576 | p21 protein (Cdc42/Rac)-activated kinase 1 (PAK1) | 60.6 | ✓* | / | |
| NM_002577 | p21 protein (Cdc42/Rac)-activated kinase 2 (PAK2) | 58 | / | ||
| NM_002755 | Mitogen-activated protein kinase kinase 1 (MKK1) | 43.4 | ✓ | 1.26▴ | |
| NM_004073 | Polo-like kinase 3 (Drosophila) (PLK3) | 71.6 | ✓ | ✓ | 0 |
| NM_005030 | Polo-like kinase 1 (Drosophila) (PLK1) | 68.2 | ✓ | ✓ | 50 ▴ |
| NM_002745 | Mitogen-activated protein kinase 1 (MAPK1) | 41.4 | ✓ | 0.38▾ | |
| NM_001315 | Mitogen-activated protein kinase 14 (MAPK14) | 41.6 | ✓ | 1.52▴ | |
| NM_002750 | Mitogen-activated protein kinase 8 (MAPK8) | 48.3 | ✓ | 0.80 ▾ | |
| NM_002093 | Glycogen synthase kinase 3 beta (GSK3B) | 46.7 | ✓ | 1.31 ▴ | |
| NM_002753 | Mitogen-activated protein kinase 10 (MAPK10) | 52.5 | ✓ | 1.11 ▴ | |
| NM_001292 | CDC-like kinase 3 (CLK3), transcript variant phclk3/152 | 16.8 | ✓ | 0 | |
| NM_000906 | Natriuretic peptide receptor A/guanylate cyclase A (atrionatriuretic peptide receptor A) (NPR1) | 119 | ✓ | ✓ | 0.95▸ |
| NM_001892 | Casein kinase 1, alpha 1 (CK1) | 37.2 | ✓ | 3.89 ▴ | |
| RNA polymerase and ribosomal proteins | |||||
| NM_005760 | CCAAT/enhancer binding protein zeta (CEBPZ) | 120.9 | ✓ | ✓* | / |
| NM_015658 | Nucleolar complex associated 2 homolog (S. cerevisiae) (NOC2L) | 85 | ✓ | 1.34 ▴ | |
| NM_022451 | Nucleolar complex associated 3 homolog (S. cerevisiae) (NOC3L) | 92.5 | ✓* | / | |
| NM_024078 | Nucleolar complex associated 4 homolog (S. cerevisiae) (NOC4L) | 58.5 | ✓ | ✓ | 0.76 ▾ |
| NM_003703 | NOP14 nucleolar protein homolog (yeast) (NOP14) | 97.7 | ✓ | ✓ | 0 |
| NM_014976 | Programmed cell death 11 (PDCD11) | 208.7 | ✓ | 1.91 ▴ | |
| NM_006331 | EMG1 nucleolar protein homolog (S. cerevisiae) (EMG1) | 26.7 | ✓ | 1.27 ▴ | |
| NM_014233 | Upstream binding transcription factor, RNA polymerase I (UBF) | 89.4 | ✓* | / | |
| NM_139071 | SWI/SNF related, matrix associated, actin dependent regulator of chromatin, subfamily d, member 1 (SMARCD1) | 54.9 | ✓ | 1.22▴ | |
| Cytokines | |||||
| NM_000758 | Colony stimulating factor 2 (granulocyte-macrophage) (CSF2) | 14.4 | ✓ | ✓ | 1.72▴ |
| NM_000585 | Interleukin 15 (IL-15) | 14.9 | ✓ | ✓ | 2.26▴ |
| NM_001001437 | Chemokine (C-C motif) ligand 3-like 3 (CCL3L3) | 7.8 | ✓ | 0.81▾ | |
| NM_009855 | CD80 antigen (Cd80) | 30.5 | ✓ | 10 ▴ | |
| NM_000586 | Interleukin 2 (IL-2) | 14.6 | ✓ | ✓ | 0.89▾ |
| NM_000589 | Interleukin 4 (IL-4) | 14.9 | ✓ | 1.40▴ | |
| NM_000600 | Interleukin 6 (interferon, beta 2) (IL-6) | 21 | ✓ | ✓ | 1.10▴ |
| NM_002187, NM_000882 | Interleukin 12A and 12B (IL-12A and IL-12B) | 65 | ✓ | 0.1▾ | |
| AY890689, NM_000619, NP_000610 | Synthetic construct Homo sapiens clone FLH031198.01L interferon gamma (IFNG) | 16.8 | ✓ | 0.53▾ | |
| NM_006850 | Interleukin 24 (IL-24) | 18.2 | ✓ | 2.71▴ | |
| NM_000880 | Interleukin 7 (IL-7) | 17.4 | ✓ | ✓ | 2▴ |
| NM_000572 | Interleukin 10 (IL-10) | 18.6 | ✓ | ✓ | 1.00▸ |
| NM_024013 | Interferon, alpha 1 (IFN-α) | 19.2 | ✓ | 5 ▴ | |
| NM_000594 | Tumor necrosis factor (TNF-α) | 17.4 | ✓ | 1.56▴ | |
| NM_002985 | Chemokine (C-C motif) ligand 5 (CCL5) | 7.5 | ✓ | 2.72▴ | |
| Transcription factors | |||||
| NM_021975 | v-rel reticuloendotheliosis viral oncogene homolog A (avian) (RELA) | 60.2 | ✓ | 2 ▴ | |
| NM_020529 | Nuclear factor of kappa light polypeptide gene enhancer in B-cells inhibitor, alpha (NFκBIA) | 35.6 | ✓ | ✓ | 1.11▴ |
| NM_001429 | E1A binding protein p300 (EP300) | 264.1 | ✓ | 0 | |
| NM_002228 | Jun oncogene (AP1) | 35.7 | ✓ | ✓ | 2.63▴ |
| NM_002049 | GATA binding protein 1 (globin transcription factor 1) (GATA1) | 42.7 | ✓ | 0.91▾ | |
| NM_015859 | General transcription factor IIA, 1, 19/37kDa (TFIIA) | 41.5 | ✓ | ✓ | 50 ▴ |
| NM_000546 | Tumor protein p53 (p53) | 43.7 | ✓ | 0.51▾ | |
| NM_003403 | YY1 transcription factor (YY1) | 44.7 | ✓ | ✓ | 2.57▴ |
| NM_001514 | General transcription factor IIB (TFIIB) | 34.8 | ✓ | 0.83▾ | |
| NM_004379 | cAMP responsive element binding protein 1 (CREB1) | 36.7 | ✓ | 1.30▴ | |
| NM_016269 | Lymphoid enhancer-binding factor 1 (LEF1) | 44.2 | ✓ | 0 | |
| NM_018952 | Homeobox B6 (HOXB6) | 25.4 | ✓ | 1.17▴ | |
| NM_005901 | SMAD family member 2 (SMAD2) | 52.3 | ✓ | ✓ | 0.85▾ |
| NM_005238 | v-ets erythroblastosis virus E26 oncogene homolog 1 (avian) (ETS-1) | 50 | ✓ | 0.86▾ | |
| NM_014596 | zinc ribbon domain containing 1 (ZNRD1) | 13.9 | ✓ | 1.70▴ | |
| Membrane proteins | |||||
| NM_000633 | B-cell CLL/lymphoma 2 (Bcl-2) | 26.3 | ✓ | 1.16▴ | |
| NM_001005862 | v-erb-b2 erythroblastic leukemia viral oncogene homolog 2, neuro/glioblastoma derived oncogene homolog (avian) (HER-2) | 137.9 | ✓ | 0 | |
| NM_003042 | Solute carrier family 6 (neurotransmitter transporter, GABA), member 1 (SLC6A1) | 67 | ✓ | ✓ | 1.18▴ |
| NM_001045 | Solute carrier family 6 (neurotransmitter transporter, serotonin), member 4 (SLC6A4) | 70.3 | ✓ | 1.92▴ | |
| NM_014229 | Solute carrier family 6 (neurotransmitter transporter, GABA), member 11 (SLC6A11) | 70.6 | ✓ | 0.46▾ | |
| NM_016615 | Solute carrier family 6 (neurotransmitter transporter, GABA), member 13 (SLC6A13) | 63.7 | ✓ | ✓ | 1.60▴ |
| NM_024006 | Vitamin K epoxide reductase complex, subunit 1 (VKORC1) | 18.2 | ✓ | 0 | |
| NM_003264 | Toll-like receptor 2 (TLR2) | 89.8 | ✓ | 2 ▴ | |
| NM_030956 | Toll-like receptor 10 (TLR10) | 94 | ✓ | ✓ | 9.83▴ |
| NM_016562 | Toll-like receptor 7 (TLR7) | 120.9 | ✓ | 1.5 ▴ | |
| NM_012140 | Solute carrier family 25 (mitochondrial carrier; dicarboxylate transporter), member 10 (SLC25A10) | 31.2 | ✓ | 1.28▴ | |
| NM_014437 | Solute carrier family 39 (zinc transporter), member 1 (SLC39A1) | 34.2 | ✓ | ✓ | 0 |
| NM_000447 | Presenilin 2 (Alzheimer disease 4) (PSEN1) | 52.6 | ✓ | 0.71▾ | |
| NM_000220 | Potassium inwardly-rectifying channel, subfamily J, member 1 (KCNJ1) | 44.7 | ✓ | 0 | |
| NM_021625 | Transient receptor potential cation channel, subfamily V, member 4 (TRPV4) | 98.2 | ✓ | 10 ▴ | |
| NM_001651 | Aquaporin 5 (AQP5) | 28.3 | ✓ | ✓ | 0 |
| NM_005228 | Epidermal growth factor receptor (erythroblastic leukemia viral (v-erb-b) oncogene homolog, avian) (EGFR) | 134.2 | ✓ | 0 | |
| NM_001753 | Caveolin 1, caveolae protein (CAV1) | 20.4 | ✓ | ✓ | 10.95▴ |
| NM_000593 | Transporter 1, ATP-binding cassette, sub-family B (MDR/TAP) (TAP1) | 80.9 | ✓ | ✓ | 0 |
| NM_000544 | Transporter 2, ATP-binding cassette, sub-family B (MDR/TAP) (TAP2) | 75.6 | ✓ | 0 | |
| NM_005561 | Lysosomal-associated membrane protein 1 (LAMP1) | 44.7 | ✓ | ✓ | 0 |
| NM_002294 | Lysosomal-associated membrane protein 2 (LAMP2) | 44.9 | ✓ | 0 | |
| NM_014398 | Lysosomal-associated membrane protein 3 (LAMP3) | 44.3 | ✓ | 0 | |
| NM_000086 | Ceroid-lipofuscinosis, neuronal 3 (CLN3) | 47.6 | ✓ | 0.31▾ | |
| NM_014319 | LEM domain containing 3 (LEMD3) | 99.9 | ✓ | 0 | |
| NM_000914 | Opioid receptor, mu 1 (OPRM1) | 44.7 | ✓ | 1.49▴ | |
| NM_023921 | Taste receptor, type 2, member 10 (TAS2R10) | 35.3 | ✓ | 0 | |
| NM_002507 | Nerve growth factor receptor (NGFR) | 45.1 | ✓ | 0 | |
| “Other” proteins | |||||
| NM_004523 | Kinesin family member 11 (KIF11) | 119.1 | ✓ | 2.33▴ | |
| NM_001012271 | Baculoviral IAP repeat-containing 5 (BIRC5) | 16.4 | ✓ | 0.59▾ | |
| NM_001786 | Cell division cycle 2, G1 to S and G2 to M (CDC2) | 34 | ✓ | 3.47▴ |
Workflow of multigene study
An expression vector (pQE-T7) with combined features for cell-free and in vivo expression was developed. To facilitate detection and purification, the vector fuses a N-terminal hexahistidine (6xHis) tag to the recombinant protein as described in Figure 1. Tight regulation with little or no basal expression in vivo was shown for the pQE-T7 vector equipped with a T7 promoter (Supporting Information Fig. 1). In preparation of our in vivo study, we analyzed the impact of using either IPTG or an autoinduction medium20 on the expression yields of six selected proteins representing the various protein classes. In addition to simplified handling, the autoinduction medium consistently resulted in higher cell densities and expression levels from equal culture volume compared to conventional IPTG induction (Supporting Information Fig. 2). Furthermore, cultures expressing sequence-optimized constructs showed a higher cell density per volume in both induction systems [Autoinduction OD600 nm 5.6 (wt) versus 8.1 (opt) on average; IPTG OD600 nm 2.1 (wt) versus 2.9 (opt) on average, respectively]. This suggests a more efficient translation of optimized heterologous transcripts probably by allowing an increased total rate of protein synthesis which results in accelerated cell growth.
Figure 1.
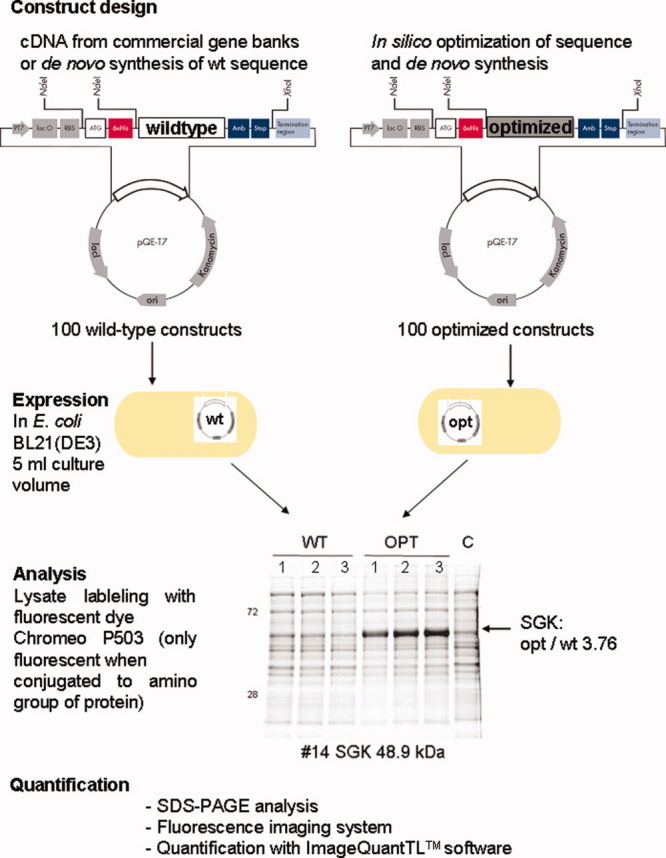
Workflow of multi-gene study: 100 wt and sequence-optimized genes were cloned or synthesized into a pQE-T7 E. coli expression vector. PT7: T7 promoter; lac O: lac operator; RBS: ribosome-binding site; ATG: start codon; 6xHis: N-terminal hexahistidine tag; wt/optimized: cloning cassette to receive the gene coding sequence; Amb: amber stop codon; Stop: translational stop; ori: origin of replication; lacI: Lac repressor gene; Kanamycin: kanamycin resistance gene. The N-terminal 6xHis tag is exoproteolytically cleavable using the TAGzyme system. Every QIAgene E. coli contains a universal stop point for the TAGzyme protease.18 His tag sequences can be deleted by NdeI restriction for generation of a construct for expression of an untagged protein. The amber stop codon (UAG, Amb) can be used to incorporate a label making use of the amber suppression principle.19 Each wt and optimized construct was expressed in E.coli cells in vivo. The total cell lysate was labeled with the dye Chromeo P503 which only becomes fluorescent upon binding to an amino group of a protein. Lysates were separated on a SDS gel and scanned using an Ettan DIGE™ Fluorescent Scanner. Signals were quantified using the ImageQuant™ TL software. The factor (3.76) displays the ratio of protein expression using optimized (opt) and wild type (wt) sequences. [Color figure can be viewed in the online issue, which is available at www.interscience.wiley.com.\]
Each wt-cDNA and its sequence-optimized counterpart were expressed in E. coli BL21(DE3). A dye (Chromeo P503), which only becomes fluorescent once it is conjugated to an amino group of a protein, was added to each lysate in excess.21 The absolute fluorescence was then measured with a fluorescent imaging system by scanning with decreasing intensity until no saturation was visible. The protein band of interest was drawn on to determine the absolute expression (Workflow Fig. 1). For quantitative comparison, the mean fluorescence value from three independent expressions was calculated and the expression level of optimized genes was divided by the wt value. A ratio value >1 implies a higher expression level for the optimized sequence, a ratio value <1 a higher level for the wt sequence, respectively (Table I, column opt/wt). The most important findings from the analysis of Table I are summarized in Table II.
Tabel II.
Summary of In Vivo Expression Results of wt and Sequence-Optimized Genes
| Cases of opt >wt (%) | Cases of opt = wt (%) | Cases of opt <wt (%) | No expression (%) | Ratio total expression (opt s wt, mean) | Ratio total expression (opt/wt, median) | |
|---|---|---|---|---|---|---|
| All genes (n = 94) | 54.3 | 3.2 | 20.2 | 22.3 | / | / |
| Expressible genes (n = 73) | 70.0 | 4.1 | 25.9 | / | 3.50 | 1.29 |
Impact of gene optimization on reliability and levels of transgene expression
Altogether, 54 out of 94 optimized expression constructs (57.5%) performed equal or better than their wt counterparts (Table I). On the contrary, 19 optimized constructs (20.2%) performed slightly weaker and further 21 full-length constructs, neither wt nor optimized showed any expression at all under standardized conditions. Within the group of proteins that could be expressed in E. coli cells (73 out of 94), gene optimization resulted in significantly higher expression levels in 51 cases (70%; Table II). Expression levels of optimized human genes in E. coli were elevated up to 50-fold compared to wt sequences. In nine cases, we observed protein expression in vivo exclusively using optimized sequences, whereas the wt cDNAs failed to support any transgene expression. Here, the increase of expression level could not be quantified by our method and was estimated individually (Supporting Information Fig. 3). The mean of expression enhancement (ratio total expression, opt/wt) using sequence-optimized genes was 3.5-fold for expressible genes and the median 1.29 (Table II). The overall chance to express one of the 100 proteins raised from 69 to 78% using sequence-optimized constructs under standardized expression conditions [Supporting Information Fig. 4(A)]. To focus on the individual protein classes, especially cytokines benefit from gene optimization in terms of enhanced expression level whereas the effect is less pronounced in the class of transcription factors (median values of 1.56 and 1.17, respectively; Supporting Information Fig. 4(A). On the other hand, however, one transcription factor (TFIIA) was one of the proteins in the study that benefitted most from optimization (50-fold) and this contributed to the resulting average increase of expression for transcription factors (mean value of 5.11). Gene optimzation increased the success rate for protein expression most significantly in the groups of cytokines, transcription factors and membrane proteins [100% versus 80%, 86.6% versus 73%, 50% versus 39.3% of proteins expressed, respectively; Supporting Information Figure 4(A)]. Overall, production levels of 70% of the expressible genes were higher upon optimization (Table II). Optimized genes coding for cytokines, membrane and ribosomal proteins performed better than the overall average [78.6%, 78.6% and 80% of the genes, respectively, Supporting Information Fig. 4(A)]. Histograms for absolute expression rates are shown in Supporting Information Figure 4(C–G) for each protein. Although constructs which failed in DNA synthesis belonged to the set of fifty larger constructs [47-264 kDa, Supporting Information Fig. 4(B)], this mostly occurs with wt sequences (6 wt and 1 sequence-optimized construct). The probability to benefit from sequence optimization in terms of enhanced expression results is slightly reduced by 12% in the set of the larger constructs [Supporting Information Fig. 4(B)]. Nevertheless, an important feature of optimization and de novo gene synthesis is sequence availability and reliability which will allow future investigation of any large protein in the first place.
Purification and protein solubility
Results for IMAC purification via His tag under native and/or denaturing conditions are shown for 24 candidates of our multi-gene study (Table III). The amount which can be expressed and purified is protein dependent and ranged between 1.2 to 80 mg/l culture volume measured in elution fractions of expressions using sequence-optimized genes. In the cases where we purified and quantified the protein expressed using both wt and sequence-optimized constructs a yield ratio was calculated and can be compared to the expression ratio from Table I achieved by fluorescent quantification of total lysates. In 16 out of 17 cases the ratios of expression and purification match well, only in case of MAPK8 we analyzed an inverted tendency (Table III). This strong correlation shows that enhanced expression levels using sequence-optimized constructs can not only be detected in crude lysates but also results in enhanced amounts of protein amenable for chromatographic recovery. Purification of membrane proteins was only done for Caveolin 1 in our multi-gene study since a screen to determine the most suitable detergent would have had to be performed for each member of this class of proteins to enable successful purification. In case of Caveolin 1, only the use of an optimized sequence results in significant protein expression (Fig. 2, Table III). IFN alpha is another example where only sequence optimization leads to purification of a noteworthy amount of protein (Fig. 2, Table III). In cases where full-length proteins are difficult to express or purify (e.g., JAK2) or show degradation products (e.g., TLR2), the optimized coding sequences have also proven useful to efficiently express single domains of the protein (Supporting Information Fig. 5).
Tabel III.
Amount of Protein After IMAC Purification Using 25 wt and Sequence-Optimized Genes for Expression in E. coli
| Protein yield (mg/L) | Purification mode | Yield ratio after purification | Ratio total expression | ||
|---|---|---|---|---|---|
| Name | Wild-type gene | Optimized gene | Native (N)/ denat. (D) | opt/wt (elution fractions) | opt/wt (lysate) |
| Pim-1 | 10.5 | 19.4 | N | 1.85 | 1.65 ▴ |
| Pim-2 | n.d. | 10 | N | 1.29 ▴ | |
| MAPKAPK5 | 14.9 | 80 | N | 5.37 | 2.77 ▴ |
| TRIB1 | 11.3 | 6.3 | N | 0.56 | 0.83 ▾ |
| FYN | n.d. | 6 | N | 0.96 ▸ | |
| MAPK1 | 24.3 | 11.5 | N | 0.47 | 0.38 ▾ |
| MAPK14 | n.d. | 43 | N | 1.52 ▴ | |
| MAPK8 | 33.8 | 42.2 | N | 1.25 | 0.80 ▾ |
| EMG1 | 30 | 31.5 | N | 1.05 | 1.27 ▴ |
| IFN gamma | 76 | 22 | N | 0.29 | 0.53 ▾ |
| IFN alpha | 0 | 13.3 | N | 5.00 ▴ | |
| TNF alpha | n.d. | 68 | N | 1.56 ▴ | |
| NFKB1a | 34 | 34.8 | N | 1.02 | 1.11 ▴ |
| YY1 | n.d. | 24 | N | 2.57 ▴ | |
| TFIIB | 19.1 | 4 | N | 0.21 | 0.83 ▾ |
| Kif11 | 2 | 3.5 | N | 1.75 | 2.33 ▴ |
| CDC2 | 8.2 | 14 | N | 1.71 | 3.47 ▴ |
| Caveolin 1 | 0 | 1.2 | N | 10.95▴ | |
| CSF2 | 8.5 | 23.8 | D | 2.80 | 1.72 ▴ |
| IL-4 | 25.5 | 34.8 | D | 1.36 | 1.40 ▴ |
| IL-6 | 19.6 | 21.2 | D | 1.08 | 1.10 ▴ |
| IL-7 | 0 | 16.2 | D | 2.00 ▴ | |
| IL-10 | 6 | 5.8 | D | 0.97 | 1.00 ▸ |
| IFN alpha | 0 | 25.5 | D | 5.00 ▴ | |
| TNF alpha | 25.5 | 38.6 | D | 1.51 | 1.56 ▴ |
| CCL5 | n.d. | 63 | D | 2.72 ▴ | |
| TFIIB | 25.9 | 19 | D | 0.73 | 0.83 ▾ |
Figure 2.

Optimized sequences increase yield of soluble protein in in vivo E. coli expression system. The expression in E. coli BL21(DE3) and Ni-NTA purification via His tag under native conditions of four wild type (WT) and optimized (OPT) sequences and optimized CAV1 is shown (wt CAV1 cannot be detected). Samples were analyzed on a SDS gel and stained with Coomassie Brilliant blue. Arrows indicate the protein of interest, arrowheads show lysozyme; elution fractions (E) were quantified with a Bradford assay and 3 μg protein was separated in case of sequence-optimized expression in comparison to the same volume of wt protein fraction. TL: total lysate, CL: cleared lysate; 2.5 μL of each fraction were separated R: resolubilized membrane fraction; BT: break through; W: wash. Note that some protein in the cleared lysates is insoluble and purification of the soluble protein results in enrichment in the elution fraction. Marker: Page ruler prestained protein Ladder (Fermentas); for more information on the genes and proteins see Table I. [Color figure can be viewed in the online issue, which is available at www.interscience.wiley.com.\]
Multi-parameter gene optimization versus host supplementation with rare tRNAs
The impact of tRNA availability to compensate for rare codons in wt cDNAs was determined and compared to the effects achievable by a multi-parameter optimization. We determined the expression level of wt cDNAs encoding human genes in E. coli strains, which co-express certain rare tRNAs (Rosetta2, BL21-CodonPlus), and of their sequence-optimized counterparts in E. coli BL21(DE3) without any additional tRNAs. First, we analyzed the distribution of rare codons in silico and grouped the 100 human genes listed in Table I into three categories, where, on average, either every 6th, 12th or 22nd amino acid is encoded by a rare codon. The impact of co-expression of rare tRNAs should decrease within this series. The comparison was performed with two to three members of each of the groups (seven proteins in total, Fig. 3). Regardless of the grouping, the expression level of all candidates was highest when we expressed the sequence-optimized construct in BL21(DE3) cells without any additional tRNAs [Fig. 3(A,B)]. Whereas gene optimization reliably led to substantial protein expression even in a conventional BL21(DE3) strain in all cases tested, the rare tRNA supplemented Rosetta2 (CSF-2) and the BL21 CodonPlus strain (PLK1, CSF-2, and Caveolin 1) in some cases failed to promote production of the protein of interest. These data suggest that more factors than simply the availability of rare tRNAs contribute to efficient expression of human genes in E. coli, which are accounted for in the multi-parameter gene optimization software.
Figure 3.

Enhanced codon usage is only one aspect of gene optimization. (A) Human wt genes coding for PLK1, SMARCD1, CSF2, AP-1, YY1, CCL5, and CAV1 were expressed in Rosetta2 (white) and BL21CodonPlusRIPL (grey) E. coli strains, both supplemented with rare tRNAs. Wt and sequence-optimized genes coding for the same proteins were expressed in E. coli BL21(DE3) (black). (B) Lysates were labeled and quantified using the fluorescent dye Chromeo P503, separated on an SDS gel and analyzed with an Ettan DIGE scanner. Proteins bands were evaluated using the ImageQuant TL software. Every expression was done in triplicates. WT: wild type sequences; OPT: optimized sequences; C: control (mock transformation).
Molecular mechanisms underlying the level of human gene expression in E. coli
To characterize the molecular mechanisms underlying the observed modulation of human protein expression in E. coli, we compared the mRNA transcript level during recombinant protein expression from wt and sequence-optimized constructs, respectively. For two different scenarios the correlation between mRNA level and efficiency of protein expression was analyzed: (i) the optimized construct shows higher expression level than the wt construct (e.g., CK1, ratio opt/wt 3.89), (ii) the optimized construct shows lower expression level than the wt construct (e.g., LCK, ratio opt/wt 0.41). The transcript level was monitored at four different time points with regard to IPTG induction by relative quantification with real-time PCR. Since the nucleotide sequences of optimized and wt DNA differ up to 30%, we first examined the amplification efficiencies of different primer sets using at least 6-log template dilution series to ensure the comparability of the detected mRNA expression levels (Supporting Information Fig. 6 and Table II). We then monitored mRNA levels during recombinant protein expression of both wt and sequence-optimized genes in two independent expression experiments and determined the increase in mRNA abundance relative to the transcript level prior IPTG induction. In the case of sequence-optimized CK1, IPTG induction caused a 1400-fold change of the mRNA level after 4 hours while transcript levels of wt CK1 did not increase more than 38-fold in response to induction. This is in agreement with a higher and more rapid protein expression for the optimized construct [Fig. 4(A)]. Analysis of the mRNA levels of LCK showed a 500-fold increase of mRNA transcripts for the wt gene in response to 1 hour of IPTG induction whereas the mRNA level for the sequence-optimized gene was only elevated about 130-fold, which could be also observed at the protein expression level [Fig. 4(B)]. In these two cases tested, mRNA and protein expression levels correlated suggesting that an increase of mRNA is required to achieve an increase on the protein level. However, the ratio values show that the resulting effect on the mRNA level is not necessarily proportional to the effect on the protein level.
Figure 4.
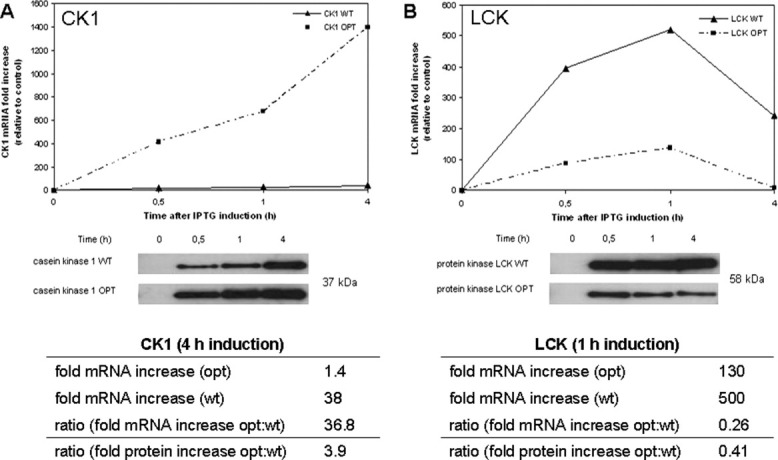
mRNA level correlates with amount of recombinant protein. Expressions of CK1 (A), LCK (B) were analyzed at 4 different time points after IPTG induction at mRNA and protein level. 6 × 10⁸ cells were harvested, total RNA was isolated and used for relative quantification by two-step real-time PCR. Real-time PCR measurements were done in triplicate with samples from two independent experiments. The fold changes in mRNA expression relative to the mRNA level at _T_0 are plotted against the time after induction. Representative Western blots show the expression levels of the corresponding proteins. Total cell lysates from an identical number of cells at the different time points post induction were subjected to SDS-PAGE and subsequent Western blotting using Penta-His HRP Conjugate.
Discussion
This multi-gene study evaluates the influence of sequence optimization on the level of protein expression of human genes in E. coli. Unlike previous reports describing individual expression studies,11–16 we analyzed 94 genes representing various protein classes which were optimized using a standardized multi-parameter algorithm and the expression was analyzed side by side to their wt counterpart. We expressed full-length proteins without systematically screening deletions, domain boundaries, tag positions or expression conditions. Such methods can increase the amount of expressed soluble protein22 and may be required when producing a single protein domain in high amounts23 as shown here by high-level expression of TLR2 and Jak2 subdomains (Supporting Information Fig. 5). Besides optimization, de novo gene synthesis provides for the accurate gene whereas only one third of the wt genes obtained from commercial sources showed the correct and complete DNA sequence compared to its EntrezGene entry. Due to freedom of sequence design, 99 of 100 sequence-optimized genes were successfully synthesized whereas 6 wt genes failed. We developed an expression vector which contains a cleavable N-terminal His-tag and a tightly regulated T7 promoter. A fluorescence-based method for reliable protein quantification using the fluorescent dye Chromeo P503 was applied to quantify in vivo protein expression with a fluorescent imaging system. Membrane and a few weakly expressed proteins were detected by Western blotting using a fluorescence-labeled primary antibody24 directed against the His tag.
In our opinion, the use of rationally designed synthetic genes has several advantages over wt cDNAs: (i) 99% in contrast to 34% of the desired constructs were readily available with a reliable, proven sequence, (ii) the chance to achieve expression of a protein was elevated from 69 to 78% in our study using sequence-optimized constructs, and (iii) the level of expression was enhanced 3.5-fold on average. We observed a success rate of 70% using sequence-optimized genes (enhanced expression compared to wt genes). This observation matches closely with results already seen for the expression of 30 human sequence-optimized short-chain dehydrogenase/reductase genes.11
Cells grew to higher cell densities when expressing sequence-optimized genes, probably due to a more efficient translation of heterologous transcripts which might lead to accelerated cell growth in general. As postulated by Kudla et al., a mRNA transcribed from an optimized gene might sequester fewer ribosomes resulting in smoother translation which could lead to an increase of the total cellular protein synthesis and thus cell growth.25
In cases where optimized genes expressed lower than wt genes, OD values of the bacterial cultures also lacked behind. Negative influence of the accumulating protein within the bacterial cell, especially when using autoinduction medium, might be one explanation for the observation of a higher expression level measured for 19 wt genes (wt > opt). In three out of ten cases tested (kinase FYN and transcription factors NFκBIA and GATA1), expression level analysis after a shorter induction period showed an inverse result (opt > wt; data not shown). In addition to in vivo expression, all constructs were analyzed in an E. coli cell-free expression system (Supporting Information Table 4). Similar to in vivo, cell-free expression levels of wt genes were higher in 13 out of these 19 cases. With 5 out of 15 genes in vivo and 6 out of 15 in the cell-free expression system this finding was most pronounced within the group of transcription factors. This might be explained with disturbing effects of these foreign DNA-binding proteins to the transcriptional regulation of the host cell machinery. Even though it is commonly believed that proteins toxic to the living cell can generally be expressed in the corresponding cell-free lysate26 it is obvious that cellular functions such as transcription are also required for in vitro transcription/translation systems. Whether or not DNA binding or other effects are responsible for the failure to express certain proteins like transcription factors will have to be elucidated by more selective studies. Assuming that homologous expression of such proteins does not or not as severely disturb the physiology of the host, the toxicity hypothesis is indirectly supported by the fact that in a similar study conducted in eukaryotic cells expression of all transcription factors could be increased by gene optimization (Stephan Fath, Ralf Wagner et al., manuscript in preparation).
We observed a good correlation between cell-free and in vivo expression in E. coli as it has been reported in other studies27,28 and confirm that cell-free expression is a convenient screening tool for small-scale protein expression.
We did not check for solubility of all proteins expressed using sequence-optimized constructs, but 34.2% of those tested could be purified under native conditions and an additional 30% worked under denaturing conditions. This degree of solubility is slightly higher than described in other studies.29 The exact yield was quantified for 24 proteins and varied between 1.2 and 80 mg/L bacterial culture. The expression ratios determined in crude cell-lysates and the yield ratios calculated from amounts of purified protein show a good correlation. Therefore, sequence-optimization does not only result in enhanced expression levels in crude cell-lysates but also in elevated protein amounts that can be purified. Beyond that, protein expressed from sequence-optimized constructs does not change its solubility compared to protein derived from wt sequences.
It has been postulated that although heterologous expression can be improved by altering the codon preference, the effect can generally be achieved by introducing rare codon tRNAs into the host cell.11 Our results clearly show that an adapted codon bias is only one parameter which contributes to an enhanced expression level using sequence-optimized genes. In all cases analyzed here and in a study reported previously,4 the expression level of wt genes in bacterial strains supplemented with rare tRNAs was exceeded significantly by using sequence-optimized counterparts in nonsupplemented strains. This might be in accordance with the finding that simply choosing the codons most frequently used by an expression host will not ensure protein expression. Instead, the use of codons served by tRNAs during translation which are most efficiently recharged seems to be important in situations of amino acid starvation.30 Recently, it was reported that the use RosettaDE3 strains leads to improved purity of purified protein rather than to a great enhancement of protein expression levels.31
The mRNA stability at the 5′terminus has an influence on the expression level of heterologously expressed genes in E. coli. A lower amount of free energy corresponds to weaker hairpins in the 5′ region of mRNAs and therefore enhances translation initiation efficiency.25,32 One of our algorithm parameters aims at avoiding hairpin forming inverted repeats in the 5′ region but we did not observe a correlation between lower Δ_G_ values and enhanced expression levels (Supporting Information Table 3). However, all of our constructs contained a 24 nucleotide His tag in the 5′ region which is known to elevate recombinant protein expression.27,33,34 We believe that this leader sequence attenuates mRNA secondary structure formation and allows efficient initiation of translation. Therefore, at least in case of N-terminally tagged proteins other factors discussed in this study seem to play a more important role than a low amount of free energy in the 5′ region.
Our data show that the mRNA amount clearly correlates with protein expression levels in case of LCK and CK1. Factors like a prolonged half-life or a reduced sensitivity for RNA nucleases might be explanations for elevated mRNA levels. At this point it is probably fair to state that, compared to the situation in mammalian expression systems, the impact of mRNA optimization in E. coli is not as well understood. Certainly however, effects during translation elongation can also have an influence on protein expression since the ratio of maximum mRNA levels of optimized to wt for CK1 is 36.8 whereas the protein ratio is only 3.9, and ratios for LCK are 0.26 (mRNA) and 0.41 (protein). These data show that despite the high success rate of increasing yields of full-length human proteins details of the molecular mechanisms underlying translational control remain to be elucidated. The fact that 20% of the gene sequences calculated by our algorithm resulted in lower expression compared to the wt cDNA suggests a potential for further improvement in gene design for heterologous protein expression.
In summary, this multi-gene study supports the conclusion that an improved codon usage is not the only parameter which has to be considered when using an expression system like E. coli for heterologous protein production. In fact, an optimization strategy has to provide a balance of (i) an adapted codon choice, (ii) a balanced GC-content, (iii) avoidance of sequence repeats and other DNA motifs, and (iv) the avoidance of mRNA secondary structures especially at the translation initiation region, all of which is accounted for in our algorithm. In our view, the gene redesign concept can be regarded as the method of choice for expression of recombinant proteins, since it not only guarantees the availability of an expression construct of correct sequence but also significantly increases success, that is expression rate. This applies to heterologous expression of human genes in E. coli and may also hold true for homologous expression of human genes in human (HEK293) as well as in insect cells (Stephan Fath, Ralf Wagner et al., manuscript in preparation). As the improved success rate applies to high-level production of full-length proteins the concept promises to facilitate investigation of multi-protein complexes, an important future goal in biochemistry.
Material and Methods
Plasmids and bacterial strains
The pQE-T7 vector (Qiagen) contains a T7 promotor, a lac operator sequence, a T7 termination signal, a _lac_I gene for cis mediated repression and a gene conferring resistance to kanamycin. A coding sequence cloned into this vector expresses a N-terminal 6x His tag sequence (MKHHHHHHMKQ) which is exoproteolytically removable with the TAGzyme system.18 An amber stop codon for co-translational label incorporation by amber suppression is inserted at the C-terminus.19 All cloning and plasmid propagation steps were carried out using E. coli strain DH10B (Invitrogen) and EZ Competent Cells (Qiagen). Expression trials were performed using the E. coli strains BL21(DE3) (Lucigen), BL21-CodonPlus (DE3)-RIPL (Stratagene) and Rosetta2 (DE3) (Novagen).
Construct design and cloning
Standard human gene sequences were retrieved from the NCBI GeneEntrez database and the coding region was optimized using the GeneOptimizer® expert software system (Geneart AG) as described elsewhere.17 Briefly, optimization parameters include codon usage, DNA motifs such as ribosomal entry sites, GC content and avoidance of (inverted) repeats. All optimized genes were then assembled by synthetic oligonucleotides (de novo gene synthesis), cloned and sequence verified. Very large genes were first divided into subgenetic fragments, which were then assembled from oligonucleotides using PCR, cloned and sequence verified. Next, these subfragments were fused by PCR and then cloned and sequence verified. The wt (“native”) versions of the same genes were obtained from the RZPD, Germany or Geneservice, UK, if available (based on the beginning of 2007). All cDNA clones from clone selections were sequence verified after receipt. Only those clones encoding for the very same amino acid sequence as specified by their respective GeneEntrez database entry were used as templates for further subcloning steps. Those wt genes, which either could not be obtained from clone selections or showed nonsilent mutations resulting in a different amino acid sequence than specified by GeneEntrez, were synthesized de novo as described above. All optimized and wt coding sequences (Supporting Information Table 1) were subcloned into the pQE-T7 expression vector and the correctness of the resulting constructs was verified by DNA sequencing. For efficient protein expression in E. coli signal sequences were removed from wt and optimized constructs, respectively, based on information in the NCBI database. Optimized human genes for expression of His-tagged proteins in E. coli or eukaryotic expression systems as used in this study are marketed as QIAgenes by QIAGEN.
Protein expression
Wt and optimized expression constructs were transformed into E. coli BL21(DE3) and, if indicated, additionally into rare tRNA-supplemented E. coli strains BL21CodonPlus(DE3)-RIPL and Rosetta2(DE3). Three independent colonies were inoculated into 5 mL Luria-Bertani (LB) broth containing kanamycin (50 μg/mL), with addition of chloramphenicol (34 μg/mL) for the Rosetta2(DE3) and BL21CodonPlus(DE3)-RIPL strains, and grown overnight in a 24-deep-well block at 30°C with shaking at 160 rpm. Overnight cultures were then diluted to a final OD600 nm of 0.1 in 5 mL of freshly prepared autoinduction medium20 with suitable antibiotics and incubated for 24 h at 30°C in a 24-deep-well block with shaking at 160 rpm before cells were harvested by centrifugation.
Quantification of expression
For the quantification of in vivo expressed proteins, cell pellets were resuspended in lysis buffer B (100 m_M_ NaH2PO4, 10 m_M_ Tris-Cl, 7 M Urea, pH8.0) containing 10 U/mL of Benzonase (Merck) and protease inhibitor cocktail (Complete EDTA-Free, Roche) and lysed by shaking at 600 rpm for 1 h at room temperature. The crude lysates were labeled with Chromeo P503 (Active Motif) as described previously.21 Briefly, proteins were denatured in 2x sample buffer (62.5 m_M_ Tris, pH 8.5, 20% (v/v) glycerol, 4% (w/v) SDS and 3% (w/v) DTT) for 5 min at 95°C and ChromeoP503 dye was added to the samples at a final concentration of 125 μ_M_. Labeling reactions were incubated for 30 min at 50°C and subsequently subjected to SDS-PAGE. Membrane proteins were analyzed by Western blotting using a fluorescent primary antibody. Crude lysates were separated by SDS-PAGE and transferred onto nitrocellulose membranes. Membranes were blocked with 5% bovine serum albumin (BSA), incubated with Penta-His Alexa Fluor 647 Conjugate (Qiagen) diluted 1:500 in 3% BSA and washed three times with TBS. Recombinant protein-specific bands in SDS-gels and on Western blots were detected using the Ettan DIGE Imager (GE Healthcare). Corresponding wt and optimized constructs were analyzed in triplicates on the same gel or Western blot, respectively, and scanned with decreasing intensity until no saturation was visible. The protein bands were quantified using the ImageQuant TL software (GE Healthcare). Lysate from E. coli cells transformed with the empty expression construct served as negative controls for analysis.
Protein purification
For purification of His-tagged proteins under native conditions, lysis was performed by resuspending cells in buffer NPI-10 (50 m_M_ NaH2PO4, 300 m_M_ NaCl, 10 m_M_ imidazole, pH 8.0) containing 1 mg/mL lysozyme (Roche), 10 U/mL Benzonase and proteinase inhibitor cocktail followed by an incubation for 30 min on ice. For purification under denaturing conditions, the lysis buffer contained 8 M urea or 6 M Gu-HCl, respectively. Cleared lysates were obtained through a centrifugation step (20 min, 13.000g, 4°C) and incubated with Ni-NTA Magnetic Agarose Beads (Qiagen) for 1 h at 4°C. Beads were separated using magnetic force and washed twice with NPI-20 (50 m_M_ NaH2PO4, 300 m_M_ NaCl, 20 m_M_ imidazole, pH 8.0). Protein was eluted twice with NPI-500 (50 m_M_ NaH2PO4, 300 m_M_ NaCl, 500 m_M_ imidazole, pH 8.0). Protein concentrations were determined by Bradford protein assay (Bio-Rad) and elution fractions analyzed by SDS-PAGE with subsequent Coomassie staining using Imperial Protein Stain (Thermo Scientific).
Analysis of mRNA levels
Overnight cultures of cells freshly transformed with either wt or optimized LCK or CK1 coding sequences, respectively, were diluted to an OD600 nm of 0.1 in 20 mL LB medium containing kanamycin (50 μg/mL) and grown at 37°C in a shaking incubator. At an OD600 nm of 0.8-1.0 cells were induced with 1_mM_ isopropyl-β-D-thiogalactopyranoside (IPTG). Samples containing 6 × 10⁸ cells were taken immediately before the addition of IPTG and 0.5, 1 and 4 hours after induction and were harvested directly into RNAprotect Bacteria Reagent (Qiagen). Total RNA was isolated using the RNeasy Protect Bacteria Mini Kit (Qiagen) including an on-column DNAse digestion step with the RNase-Free DNase Set (Qiagen) according to the manufacture's instructions. RNA quantity and quality was assessed using the NanoDrop® ND-1000 UV-Vis Spectrophotometer (NanoDrop Technologies). Reverse Transcription of 1 μg total RNA was performed with the QuantiTect Reverse Transcription Kit (Qiagen) in accordance to the manufacturer's protocol. All oligonucleotides were purchased from Sigma. The final primer set selection was based on the efficiency of amplification. All real-time PCR reactions were performed with an Applied Biosystems 7700 Sequence Detection System using the QuantiTect SYBR Green PCR Kit (Qiagen). For each sample, PCR was carried out in triplicate in 25 μl reaction volumes containing cDNA corresponding to 0.25–0.025 ng RNA. Amplification conditions comprised an initial activation step of 15 min at 95°C followed by 40 cycles of 94°C for 15 s, 55–56°C for 30 s and 72°C for 30 s.
To ensure comparability between data for the same target obtained from different PCR runs, the threshold value was manually set to the same value for data analysis. For the calculation of the relative changes in gene expression the Pfaffl method35 was applied taking the amplification efficiencies into account. Briefly, delta Ct values were calculated by subtracting the mean Ct of each sample from the mean Ct of the control (samples taken immediately before induction) and then the amount of target relative to the control was computed by _E_Δ_Ct_target. Values were obtained from measurements of two different cDNAs generated in two independent expression experiments.
Acknowledgments
The authors thank Nicole Brinker, Imke Schneider and Iris Claussnitzer for their technical support.
Glossary
Abbreviations:
6xHis tag
hexahistidine tag
IMAC
immobilized metal affinity chromatography
wt
wild type
Supplementary material
References
- 1.Gräslund S, Nordlund P, Weigelt J, Hallberg BM, Bray J, Gileadi O, Knapp S, Oppermann U, Arrowsmith C, Hui R, Ming J, dhe-Paganon S, Park HW, Savchenko A, Yee A, Edwards A, Vincentelli R, Cambillau C, Kim R, Kim SH, Rao Z, Shi Y, Terwilliger TC, Kim CY, Hung LW, Waldo GS, Peleg Y, Albeck S, Unger T, Dym O, Prilusky J, Sussman JL, Stevens RC, Lesley SA, Wilson IA, Joachimiak A, Collart F, Dementieva I, Donnelly MI, Eschenfeldt WH, Kim Y, Stols L, Wu R, Zhou M, Burley SK, Emtage JS, Sauder JM, Thompson D, Bain K, Luz J, Gheyi T, Zhang F, Atwell S, Almo SC, Bonanno JB, Fiser A, Swaminathan S, Studier FW, Chance MR, Sali A, Acton TB, Xiao R, Zhao L, Ma LC, Hunt JF, Tong L, Cunningham K, Inouye M, Anderson S, Janjua H, Shastry R, Ho CK, Wang D, Wang H, Jiang M, Montelione GT, Stuart DI, Owens RJ, Daenke S, Schütz A, Heinemann U, Yokoyama S, Büssow K, Gunsalus KC. Protein production and purification. Nat Methods. 2008;5:135–146. doi: 10.1038/nmeth.f.202. [DOI] [PMC free article] [PubMed] [Google Scholar]
- 2.Swartz JR. Advances in Escherichia coli production of therapeutic proteins. Curr Opin Biotechnol. 2001;12:195–201. doi: 10.1016/s0958-1669(00)00199-3. [DOI] [PubMed] [Google Scholar]
- 3.Nakamura Y, Gojobori T, Ikemura T. Codon usage tabulated from the international DNA sequence databases: status from the year 2000. Nucl Acids Res. 2000;28:292. doi: 10.1093/nar/28.1.292. [DOI] [PMC free article] [PubMed] [Google Scholar]
- 4.Zhou Z, Schnake P, Xiao L, Lal AA. Enhanced expression of a recombinant malaria candidate vaccine in Escherichia coli by codon optimization. Protein Expr. Purif. 2004;34:87–94. doi: 10.1016/j.pep.2003.11.006. [DOI] [PubMed] [Google Scholar]
- 5.Nomura M, Ohsuye K, Mizuno A, Sakuragawa Y, Tanaka S. Influence of messenger RNA secondary structure on translation efficiency. Nucleic Acids Symp. Ser. 1984;15:173–176. [PubMed] [Google Scholar]
- 6.Nishikubo T, Nakagawa N, Kuramitsu S, Masui R. Improved heterologous gene expression in Escherichia coli by optimization of the AT-content of codons immediately downstream of the initiation codon. J Biotechnol. 2005;120:341–346. doi: 10.1016/j.jbiotec.2005.06.032. [DOI] [PubMed] [Google Scholar]
- 7.Krishna Rao DV, Rao JV, Narasu ML, Bhujanga Rao AK. Optimization of the AT-content of codons immediately downstream of the initiation codon and evaluation of culture conditions for high-level expression of recombinant human G-CSF in Escherichia coli. Mol Biotechnol. 2008;38:221–232. doi: 10.1007/s12033-007-9018-3. [DOI] [PubMed] [Google Scholar]
- 8.Ivanov IG, Alexandrova R, Dragulev B, Leclerc D, Saraffova A, Maximova V, Abouhaidar MG. Efficiency of the 5′-terminal sequence (omega) of tobacco mosaic virus RNA for the initiation of eukaryotic gene translation in Escherichia coli. Eur J Biochem. 1992;209:151–156. doi: 10.1111/j.1432-1033.1992.tb17271.x. [DOI] [PubMed] [Google Scholar]
- 9.Wu G, Dress L, Freeland SJ. Optimal encoding rules for synthetic genes: the need for a community effort. Mol Syst Biol. 2007;3:134. doi: 10.1038/msb4100176. [DOI] [PMC free article] [PubMed] [Google Scholar]
- 10.Graf M, Schoedl T, Wagner R. Rationales of gene design and de novo gene construction. In: Fu P, Panke S, editors. Systems biology and synthetic biology. Hoboken, NJ: Wiley; 2009. pp. 411–438. [Google Scholar]
- 11.Burgess-Brown NA, Sharma S, Sobott F, Loenarz C, Oppermann U, Gileadi O. Codon optimization can improve expression of human genes in Escherichia coli: a multi- gene study. Protein Exp Purif. 2008;59:94–102. doi: 10.1016/j.pep.2008.01.008. [DOI] [PubMed] [Google Scholar]
- 12.Williams DP, Regier D, Akiyoshi D, Genbauffe F, Murphy JR. Design, synthesis and expression of a human interleukin-2 gene incorporating the codon usage bias found in highly expressed Escherichia coli genes. Nucleic Acids Res. 1988;16:10453–10467. doi: 10.1093/nar/16.22.10453. [DOI] [PMC free article] [PubMed] [Google Scholar]
- 13.Hu X, Shi Q, Yang T, Jackowski G. Specific replacement of consecutive AGG codons results in high-level expression of human cardiac troponin T in Escherichia coli. Protein Exp Purif. 1996;7:289–293. doi: 10.1006/prep.1996.0041. [DOI] [PubMed] [Google Scholar]
- 14.Hale RS, Thompson G. Codon optimization of the gene encoding a domain from human type 1 neurofibromin protein results in a threefold improvement in expression level in Escherichia coli. Protein Expr Purif. 1998;12:185–188. doi: 10.1006/prep.1997.0825. [DOI] [PubMed] [Google Scholar]
- 15.Johansson AS, Bolton-Grob R, Mannervik B. Use of silent mutations in cDNA encoding human glutathione transferase M2–2 for optimized expression in Escherichia coli. Protein Expr Purif. 1999;17:105–112. doi: 10.1006/prep.1999.1117. [DOI] [PubMed] [Google Scholar]
- 16.Li Y, Chen CX, von Specht BU, Hahn HP. Cloning and hemolysin-mediated secretory expression of a codon-optimized synthetic human interleukin-6 gene in Escherichia coli. Protein Expr. Purif. 2002;25:437–447. doi: 10.1016/s1046-5928(02)00028-1. [DOI] [PubMed] [Google Scholar]
- 17.Raab D, et al. The GeneOptimizer Algorithm: using a sliding window approach to cope with the vast sequence space in multiparameter DNA sequence optimization. Systems and Synthetic Biology (SSBJ), ECSB II Special Issue. 2010 doi: 10.1007/s11693-010-9062-3. in the press. [DOI] [PMC free article] [PubMed] [Google Scholar]
- 18.Schäfer F, Schäfer A, Steinert K. A highly specific system for efficient removal of tags from recombinant proteins. J Biomolec Techniques. 2002;13:158–171. [PMC free article] [PubMed] [Google Scholar]
- 19.Gerrits M, Strey J, Claußnitzer I, von Groll U, Schäfer F, Rimmele M, Stiege W. Cell-free synthesis of defined protein conjugates by site-directed cotranslational labeling. In: Kudlicki T, Katzen F, Bennett R, editors. Cell-free expression. Burlington: Academic Press; 2007. pp. 166–180. [Google Scholar]
- 20.Studier FW. Protein production by auto-induction in high-density shaking cultures. Protein Expr Purif. 2005;41:207–234. doi: 10.1016/j.pep.2005.01.016. [DOI] [PubMed] [Google Scholar]
- 21.Meier RJ, Steiner MS, Duerkop A, Wolfbeis OS. SDS-PAGE of proteins using a chameleon-type of fluorescent prestain. Anal Chem. 2008;80:6274–6279. doi: 10.1021/ac800581v. [DOI] [PubMed] [Google Scholar]
- 22.Gräslund S, Sagemark J, Berglund H, Dahlgren L-G, Flores A, Hammarström M, Johansson I, Kotenyova T, Nilsson M, Nordlund P, Weigelt J. The use of systematic N- and C-terminal deletions to promote production and structural studies of recombinant proteins. Prot Expr Purif. 2008;28:210–221. doi: 10.1016/j.pep.2007.11.008. [DOI] [PubMed] [Google Scholar]
- 23.Dong A, Xu X, Edwards AM. In situ proteolysis for protein crystallization and structure determination. Nat Methods. 2007;4:1019–1021. doi: 10.1038/nmeth1118. [DOI] [PMC free article] [PubMed] [Google Scholar]
- 24.Bergendahl V, Glaser BT, Burgess RR. A fast Western blot procedure improved for quantitative analysis by direct fluorescence labeling of primary antibodies. J Immunol Methods. 2003;277:117–125. doi: 10.1016/s0022-1759(03)00183-2. [DOI] [PubMed] [Google Scholar]
- 25.Kudla G, Murray AW, Tollervey D, Plotkin JB. Coding-sequence determinants of gene expression in Escherichia coli. Science. 2009;324:255–258. doi: 10.1126/science.1170160. [DOI] [PMC free article] [PubMed] [Google Scholar]
- 26.von Groll U, Kubick S, Merk H, Stiege W, Schäfer F. Advances in insect-based cell-free protein expression. In: Kudlicki T, Katzen F, Bennett R, editors. Cell-free expression. Austin: Landes Bioscience; 2007. pp. 19–30. [Google Scholar]
- 27.Murthy TVS, Weilin W, Qiu QQ, Zhenwei SH, Labaer J, Brizuela L. Bacterial cell-free system for high-throughput protein expression and a comparative analysis of Escherichia coli cell-free and whole cell expression systems. Protein Expr Purif. 2004;36:217–225. doi: 10.1016/j.pep.2004.04.002. [DOI] [PubMed] [Google Scholar]
- 28.Lamla T, Hoerer S, Bauer MM. Screening for soluble expression constructs using cell-free protein synthesis. Int J Biol Macromol. 2006;39:111–121. doi: 10.1016/j.ijbiomac.2006.02.027. [DOI] [PubMed] [Google Scholar]
- 29.Kurotani A, Takagi T, Toyama M, Shirouzu M, Yokoyama S, Fukami Y, Tokmakov AA. Comprehensive bioinformatics analysis of cell-free protein synthesis: identification of multiple protein properties that correlate with successful expression. PMID. 2009:19940260. doi: 10.1096/fj.09-139527. [DOI] [PubMed] [Google Scholar]
- 30.Welch M, Govindarajan S, Ness JE, Villalobos A, Gurney A, Minshull J, Gustafsson C. Design parameters to control synthetic gene expression in Escherichia coli. PLoS One. 2009;4:e7002. doi: 10.1371/journal.pone.0007002. [DOI] [PMC free article] [PubMed] [Google Scholar]
- 31.Tegel H, Tourle S, Ottosson J, Persson A. Increased levels of recombinant human proteins with the Escherichia coli strain Rosetta(DE3) Protein Expr Purif. 2010;69:159–167. doi: 10.1016/j.pep.2009.08.017. [DOI] [PubMed] [Google Scholar]
- 32.Klompus S, Solomon G, Gertler A. A simple novel method for the preparation of noncovalent homodimeric, biologically active human interleukin 10 in Escherichia coli-enhancing protein expression by degenerate PCR of 5′ DNA in the open reading frame. Protein Expr Purif. 2008;62:199–205. doi: 10.1016/j.pep.2008.07.013. [DOI] [PubMed] [Google Scholar]
- 33.Busso D, Kim R, Kim SH. Expression of soluble recombinant proteins in a cell-free system using a 96-well format. J Biochem Biophys Methods. 2003;55:233–240. doi: 10.1016/s0165-022x(03)00049-6. [DOI] [PubMed] [Google Scholar]
- 34.Block H, Maertens B, Spriestersbach A, Brinker N, Kubicek J, Fabis R, Labhan J, Schäfer F. Immobilized-metal affinity chromatography (IMAC)—a review. Methods Enzymol. 2009;463:439–473. doi: 10.1016/S0076-6879(09)63027-5. [DOI] [PubMed] [Google Scholar]
- 35.Pfaffl MW. A new mathematical model for relative quantification in real-time RT-PCR. Nucleic Acids Res. 2001;29:2003–2007. doi: 10.1093/nar/29.9.e45. [DOI] [PMC free article] [PubMed] [Google Scholar]
Associated Data
This section collects any data citations, data availability statements, or supplementary materials included in this article.