Ethidium derivatives bind to G-quartets, inhibit telomerase and act as fluorescent probes for quadruplexes (original) (raw)
Abstract
The telomeric G-rich single-stranded DNA can adopt in vitro an intramolecular quadruplex structure, which has been shown to directly inhibit telomerase activity. The reactivation of this enzyme in immortalized and most cancer cells suggests that telomerase is a relevant target in oncology, and telomerase inhibitors have been proposed as new potential anticancer agents. In this paper, we describe ethidium derivatives that stabilize G-quadruplexes. These molecules were shown to increase the melting temperature of an intramolecular quadruplex structure, as shown by fluorescence and absorbance measurements, and to facilitate the formation of intermolecular quadruplex structures. In addition, these molecules may be used to reveal the formation of multi-stranded DNA structures by standard fluorescence imaging, and therefore become fluorescent probes of quadruplex structures. This recognition was associated with telomerase inhibition in vitro: these derivatives showed a potent anti-telomerase activity, with IC50 values of 18–100 nM in a standard TRAP assay.
INTRODUCTION
Telomeres protect against random fusion events and degradation and stabilize chromosome ends (1). Most human telomeric DNA is double-stranded (TTAGGG/CCCTAA)n except for the extreme terminal part where the 3′-region of the G-rich strand is single-stranded (2). These 3′ overhangs are surprisingly long (averaging 130–210 bases in length) and are present on all chromosomal ends (3). The observed G tails must exist during most of the cell cycle and probably result from degradation of both chromosome ends. The G-rich single-stranded DNA (ssDNA) can adopt an unusual DNA structure with four strands connected by G-quartets (4–6) (Fig. 1A).
Figure 1.

(A) A G-quartet (left) and a possible conformation of an intramolecular quadruplex formed by the human G-rich telomeric repeat (right). (B) Sequence of the oligonucleotides used in this study. Runs of G are indicated in bold characters; fluo, 5′-fluorescein; tamra, 3′-tetramethylrhodamine; 7, 7-deazaG base analog. (C) Chemical formula of the tested G4 ligands.
The peculiar geometry of the G-quartet structure should allow its specific recognition by small artificial ligands, and previous experiments have shown that such an assumption is correct (7–10). Many of the G4-ligands (G-quartet ligands) were shown to have anti-telomerase activity in vitro, with IC50 in the low micromolar range (11–14). Several methods have been proposed to identify G4-ligands. For example, UV-absorbance melting experiments could be used to measure a ligand-induced thermal stabilization of a G-quartet structure (15). Such a method was initially used to screen molecules for specific triplex recognition (16).
The present study was undertaken to determine the potential use of ethidium derivatives as probes for telomeric G-rich quadruplex nucleic acid structures. Ethidium itself binds to duplex DNA by intercalating between adjacent base pairs (17). Ethidium derivatives were chosen because their parent molecule, ethidium bromide, has been reported to interact with triplexes (18,19) and quadruplexes (20,21). This interaction might result from the stacking between the planar rings of the dye and the G4 structure. Original work by Guo et al. (20) established that one ethidium molecule could bind to a d(T4G4)4 quadruplex, with a slight preference over duplex DNA. However, other experiments demonstrated that ethidium affinity for quadruplexes is rather weak compared to triplexes (22). This observation prompted us to search for analogs that would provide better interaction and better selectivity. We reasoned that ethidium derivatives that could provide a better stacking or bear extra positive charges might be better ligands. Four derivatives were compared for their quadruplex affinity. The ligand-induced stabilization of the quadruplex was associated with anti-telomerase activity and a large enhancement of fluorescence quantum yield.
MATERIALS AND METHODS
Oligonucleotides
All oligonucleotides were synthesized and purified by Eurogentec, Belgium. Their sequences are shown in Figure 1B.
Compounds
Some properties of ethidium derivatives such as 1, 2, 3 (see Fig. 1C for formulae) and prothidium iodide have been previously described (23). Ethidium bromide and propidium iodide were purchased from Molecular Probes.
Compound 2, also known as isomethamidium, was previously prepared and identified as a trypanocidal drug (24). Compound 1 was similarly prepared from 2,7-diamino-10-ethyl-9-phenyl-phenanthridinium iodide, using 4-benzamido-diazonium salt in place of the 3-benzamido-diazonium salt used to synthesize 2. Compound 3 was identified as the main by-product in the synthesis of 2. It occurred through azo-coupling of 3-benzamido-diaazonium salt at position 8 of 2,7-diamino-10-ethyl-9-phenyl-phenanthridinium iodide, ortho to the 7-amino group. Compound 4 was identified as the main by-product in the synthesis of prothidium iodide according to May & Baker patent (GB 816236). It occurred through substitution of the chlorine atom of 2-amino-4-chloro-6-methyl-pyrimidine with the 7-amino group of 2,7-diamino-10-ethyl-9-phenyl-phenanthridinium iodide, instead of substitution with the 2-amino group, as occurs in the synthesis of prothidium iodide.
Solutions of all derivatives were kept at –20°C in the dark between experiments.
UV absorption studies
Unless otherwise specified, all experiments were performed in a 10 mM cacodylate buffer, 0.1 M LiCl, pH 7.0, at 3 µM oligonucleotide (22A) strand concentration. Thermal denaturation profiles were obtained with a Kontron Uvikon 940 spectrophotometer, as previously described (25). All melting temperatures (_T_m) are given ±1°C.
Fluorescence melting experiments
All fluorescence resonance energy transfer (FRET) measurements with the F21T oligonucleotide were performed on a Spex Fluorolog DM1B instrument, using a bandwidth of 1.8 nm and 0.2 × 1 cm quartz cuvettes, containing 600 µl of solution in a 10 mM sodium cacodylate buffer, 0.1 M LiCl, pH 7.3. The temperature of the circulating water bath was manually recorded at regular time intervals. All measurements were made as previously described (26).
Fluorescence titrations
Fluorescence titrations were performed on a Spex Fluorolog DM1B instrument, using a bandwidth of 1.8 nm and 0.4 × 1 cm quartz cuvettes, containing 1.4 ml of solution in a 10 mM sodium cacodylate, 0.1 M KCl, pH 7.3, buffer. Increasing amounts of a stock solution of oligonucleotide were added to a 0.4 µM solution of compound 4. A fluorescence emission spectrum was recorded 10 min after each addition.
Demonstration of FRET from DNA bases to ethidium derivatives
Demonstration of a FRET phenomenon from DNA bases to a ligand was performed as previously described (16). The conventional method to evaluate FRET requires determination of the absorbance spectrum of the bound dye, especially in the far UV region (17). This spectrum was obtained by substracting the absorbance of DNA (22A oligonucleotide) from the absorbance of the drug–DNA complex. Excitation spectra of the bound dye were recorded as previously described (18).
Accelerated assembly of G-quadruplexes
The formation of intermolecular G-quadruplex species induced by G4-ligands was followed as previously described (27). Briefly, the TR2 oligonucleotide (TACAGATAGTTAGGGTTAGGGTTA) was purified, 5′-end radiolabeled with T4 polynucleotide kinase (New England Biolabs, Beverly, MA) and [γ-32P]ATP (Amersham), and used at a final strand concentration of 8 µM. The solution was heated to 95°C for 5 min in a TE buffer containing 0.1 M KCl and slowly cooled to room temperature. Various concentrations of compound 1 were added. Reaction mixtures were incubated for 1 h at room temperature, and loaded on a native 12% acrylamide vertical gel (1:19 bisacrylamide) in a 0.5× TBE buffer, supplemented with 20 mM KCl. The gel was run at 4°C for 6 h, dried and analyzed with a Phosphorimager.
G-quadruplex probing by ethidium derivatives
Aliquots (100 ml) of a 2.5% standard molecular biology grade agarose solution in a 1× TAE or TBE buffer were boiled for 1 min, allowed to cool to 65°C, and different ethidium derivatives were added to a final concentration of 0.1 or 0.4 µM. Aliquots (20 µl) of sample solution were loaded in each comb, and the gel was run at 20°C for 30 min at a constant voltage (100 V or 8 V/cm). The gel was then placed directly above a standard UV source (λexc = 312 nm), without any washing or destaining step. Images were acquired with a digital camera.
Assay of telomerase activity
Telomerase activity was assayed using a modified TRAP assay (28,29) adapted to scintillation proximity. An aliquot of 105 HL60 cells in exponential phase of growth was pelleted and lysed for 30 min on ice using 200 µl of 0.5% CHAPS, 10 mM Tris–HCl pH 7.5, 1 mM MgCl2, 1 mM EGTA, 5 mM 2-mercaptoethanol, 0.1 mM PMSF and 10% w/v glycerol. The lysate was centrifuged at 16 000 g for 20 min at 4°C and the supernatant collected, stored at –80°C and used as the telomerase source. The TRAP reaction mix (20 mM Tris–HCl pH 8.3, 63 mM KCl, 1.5 mM MgCl2, 0.01% Tween-20, 1 mM EGTA, 200 µM of dATP, dCTP, dTTP, 4 µM of dGTP, 2 µg/ml of CXext and 5′-biotinylated TS primers, 0.1 mg/ml bovine serum albumin, 32 U/ml Taq polymerase and 0.4 µCi [3H]dGTP) was added directly to the mixture of compound or distilled water and 200 ng of telomerase extract, in a final volume of 50 µl in PCR microplates. The reaction was incubated in a crocodile thermocycler for 15 min at 30°C, then 1 min at 90°C followed by 30 cycles of: 30 s at 94°C, 30 s at 50°C and 90 s at 72°C. A final 2 min elongation step was performed at 72°C. After amplification, the telomerase products were transferred into 96-well isoplates (Wallac) and 150 µl samples of streptavidin beads (Amersham, 6.5 mg/ml in 0.53 M NaCl) were added to the reaction products and shaken for 30 min at room temperature to allow the binding of streptavidin to biotinylated molecules. Microplates were counted by using a Microbeta Trilux multidetector (Wallac). Each compound concentration was tested in triplicate, comparing the ratio of treated telomerase reactions to untreated telomerase after the substraction of a blank reaction without telomerase. IC50 were determined by plotting the data using Excel Fit software.
Taq polymerase assay
The specificity of compounds was assayed against the Taq polymerase reaction using the polylinker from plasmid pCDNA1 as a DNA template. The reaction mixture containing 25 mM TAPS pH 9.3, 50 mM KCl, 2 mM MgCl2, 1 mM 2-mercaptoethanol, 0.1 µg/ml pCDNA1, 15 pmol of Sp6 primer and 5′-biotinylated T7 primer, 0.2 mM of each dNTP, 32 U/ml Taq DNA polymerase and 0.4 µCi [3H]dGTP was added to the compound solution in a final volume of 50 µl in 96-well PCR microplates. The reaction was incubated in a crocodile thermocycler with heating cover for 2 min at 92°C followed by 30 cycles of: 30 s at 94°C, 30 s at 50°C and 90 s at 72°C. A final 2 min elongation step was performed at 72°C. Samples were treated with streptavidin beads and counted as described for telomerase assays.
RESULTS
The binding of ethidium derivatives to quadruplex structures was investigated using oligodeoxynucleotides of defined lengths, whose sequences are shown in Figure 1B. Three of them were previously shown to form an intramolecular quadruplex (21, 22A and 28G). 21 and 22A, which correspond to several repeats of the human telomeric motif, only differ by the presence of a 5′ extra adenine (for 22A). The solution structure of 22A was solved in 1993 (30): the intramolecular quadruplex consists of three adjacent G-quartets. 28G is able to form a very stable intramolecular quadruplex with four adjacent G-quartets connected by TTT loops (15). The sequence of T2G4T was chosen to allow the formation of a short, parallel-stranded quadruplex structure. Its sequence is close to TGGGGT, which allowed the determination of a well-resolved crystal structure (31). Different single-stranded controls, such as 26T, were also included in this study. The structures of the ethidium derivatives investigated in this study are shown in Figure 1C.
UV-melting profiles
One criterion for interaction of a drug with double-stranded DNA (dsDNA) is the observation of an increase in the melting temperature of the DNA in the presence of the drug (32). A similar phenomenon is expected for multi-stranded DNA structures in the presence of specific ligands. A quadruplex-specific ligand should increase the _T_m of the quadruplex, displacing the equilibrium between single strand and quadruplex towards the latter. Such a phenomenon has been extensively described for DNA ligands that bind weakly to single-stranded sequences and increase the _T_m of a duplex (32) or a triplex (16). Several putative quadruplex ligands were investigated for their effects on the stability of the intramolecular quadruplex structure formed by oligonucleotide 22A (see Fig. 1B for sequence). We used a buffer somewhat unfavorable to quadruplex formation, containing 10 mM sodium cacodylate and 100 mM LiCl. Under these conditions, the melting temperature of the 22A quadruplex is ∼40°C. This oligonucleotide is able to form an intramolecular quadruplex, as shown by the concentration-independent _T_m (15), and its solution structure has been solved (30). The addition of 15 µM ethidium bromide did not induce an increase in the melting temperature, and the absorbance melting profile was not significantly affected. In contrast, the addition of 6 µM of derivative 4 shifted the transition to higher temperatures. However, it was not possible to determine a precise _T_m, as no clear baseline could be drawn at high temperatures. Identical results were found with compounds 1, 2 and 3 (data not shown). These UV-melting experiments suggest that these derivatives interact with quadruplexes, but the relatively poor quality of the UV-absorbance melting profiles prompted us to use other methods to analyze the thermal stabilization induced by ethidium derivatives.
FRET melting experiments
FRET can be used to probe the secondary structure of oligodeoxynucleotides mimicking repeats of the G-rich strand of vertebrate telomeres, provided a fluorescein (donor) molecule and a tetramethylrhodamine (acceptor) derivative are attached to the 5′- and 3′-ends of the oligonucleotide, respectively (sequence shown in Fig. 1B). In the unfolded form, little transfer is expected, as the average distance of the two chromophores is larger than the Förster critical distance (calculated to be ∼5.0 nm). Intramolecular folding into a G-quadruplex should bring the two chromophores in close enough proximity to observe energy transfer. Therefore, FRET should be a convenient method to monitor the 3′- to 5′-end distance. Different oligonucleotides (21–26 bases) have been tested in previous experiments. For comparison purposes, we chose the F21T oligonucleotide (Fig. 1B).
Under identical conditions to the UV-melting experiments, the melting of F21T (0.2 µM strand concentration) leads to an increased emission at 520 nm. The melting behavior of such a fluorescent oligonucleotide was then recorded in the presence of different molecules: ligands known to specifically interact with a quadruplex increased the melting temperature of F21T, as shown by a different emission versus temperature profile. Contrary to the data obtained by UV-absorbance, the melting profiles were of excellent reproducibility and reversibility. Rather than using a true _T_m, which requires baseline assumptions for each curve, we chose the temperature at which the normalized intensity is 0.5 (_T_1/2) for comparison purposes. This _T_1/2 was determined to be 43.2°C in the absence of any compound, and a 2,6-diamidoanthraquinone derivative gave a stabilization of ∼4°C at 1 µM (data not shown). Ethidium derivatives were compared at 1 µM dye concentration and the results are summarized in Table 1: ethidium gave little, if any stabilization (+0.6°C) whereas 1, 2, 3 and 4 gave Δ_T_1/2 of 10.7, 9.7, 7.9 and 9.6°C, respectively. Judging from these Δ_T_1/2 values, all four derivatives were therefore excellent G-quadruplex stabilizers.
Table 1. G4 stabilization and telomerase inhibition by ethidium derivatives.
| Compound | Δ_T_1/2 G4 (FRET)a | G4 (gel)b | IC50 telomerasec | IC50 _Taq_d |
|---|---|---|---|---|
| (˚C) | (% retarded band) | (nM) | (nM) | |
| Ethidium | 0.6 | 3 | 183/286 | >10 000 |
| 1 | 10.7 | 21 | 18 | 1200 |
| 2 | 9.7 | 31 | 19 | 560 |
| 3 | 7.9 | 34 | 97 | 9600 |
| 4 | 9.6 | 36 | 47 | 1080 |
Absorbance titration
To confirm that these ligands interacted with G-quadruplex DNA (G4-DNA), we performed an absorbance titration of the dye by oligonucleotide 22A. The absorbance titration was performed under experimental conditions favorable to quadruplex formation (0.1 M KCl), arguing against binding to the single-stranded form of 22A. As seen in Figure 2A, the addition of increasing amounts of quadruplex DNA to a 10 µM solution of 4 leads to modification of the absorbance spectra, especially in the visible region. The absorbance maximum was shifted from 464 nm for free 4 to 494 nm for 4 in the presence of a molar excess of 22A. Such a large bathochromic shift is reminiscent of ethidium spectral properties in the presence of dsDNA. The positions of the absorbance maxima (in the visible region) of all derivatives, free or bound to the 22A quadruplex, are given in Table 2. Upon addition of a quadruplex-forming oligonucleotide, all peaks were red-shifted by 26 to 31 nm.
Figure 2.

(A) Absorbance properties of compound 4 in the presence of a quadruplex-forming oligonucleotide. The temperature of the sample was fixed at 20°C. Compound 4 (10 µM) was incubated in a 10 mM sodium cacodylate, 0.1 M KCl, pH 7.3 buffer. Increasing amounts of 22A (0.5–14 µM final strand concentration) were added. All titrations were performed in 1 cm pathlength quartz cuvettes. Unbroken line indicates reaction without 22A. (B) Fluorescence properties of compound 4 in the presence of a quadruplex-forming oligonucleotide. Fluorescence titration of 4 (400 nM concentration) by 28G (40 nM–1.8 µM). Excitation was set at 500 nm. The temperature of the sample was fixed at 20°C. Circles indicate emission spectrum of reaction without 28G. (C) Scatchard analysis of the fluorescence-binding data. The points were fitted with a line corresponding to 1:1 binding sites/oligonucleotide and an affinity of 1.15 × 10⁷ M–1.
Table 2. Spectroscopic properties of ethidium derivatives.
| Compound | λmax exc/emi (nm) | Φrel | λmax exc/emi (nm) | Φrel |
|---|---|---|---|---|
| freea | freeb | bounda | boundb | |
| Ethidium | 480/613 | 0.14 | 518/599 | ndd |
| 1 | 558/c | <<0.01 | 586/c | <0.01 |
| 2 | 477/597 | 0.06 | 508/595 | 0.25 |
| 3 | 551/c | 0.02 | 577/c | 0.03 |
| 4 | 464/603 | 0.04 | 494/592 | 0.20 |
For compound 4, similar titrations were performed using different oligonucleotides: the addition of increasing concentrations of 28G, another quadruplex-forming oligonucleotide, whose sequence is shown in Figure 1B, led to a similar change in absorbance properties (data not shown). In contrast, the addition of a single-stranded 26T oligonucleotide, which is unable to form a duplex or a quadruplex structure, did not induce any major change in 4 absorbance in the visible region. Therefore, visible absorbance measurements demonstrate that these derivatives interact with quadruplex-forming oligonucleotides (22A and 28G), but not with a single-stranded control (26T).
Fluorescence titration
Ethidium derivatives are fluorescent, and their fluorescence properties are strongly affected by G-quadruplex binding. The fluorescence emission of compound 4 was strongly enhanced in the presence of a large excess of 28G (Fig. 2B). The total fluorescence emission increased 10–12-fold at saturating amounts of 28G. This variation of fluorescence properties allowed us to determine a dissociation constant of 9 × 10⁻⁸ M for the complex with 28G (Fig. 2C). A single binding site was found per oligonucleotide. Nearly identical results (a strong increase in fluorescence quantum yield shown in Table 2, and a single binding site with _K_d = 1.2 × 10⁻⁷ M) were obtained when 28G was replaced by another quadruplex-forming oligonucleotide (22A) mimicking the G-rich strand of human telomeres.
As for the absorbance titration, the fluorescence titration was performed under experimental conditions highly favorable to quadruplex formation (0.1 M KCl), arguing against binding to the single-stranded form of 28G or 22A. To confirm that the fluorescence enhancement was not the result of binding to the single-stranded form of 22A or 28G, several control titrations were performed. As shown in Figure 3, the addition of ssDNA (26T) did not lead to an increase in fluorescence emission (Fig. 3, squares). We also tested two controls that have a reduced ability to form G-quadruplexes. 22A was treated with dimethyl sulfate (DMS) for 30 min before the experiment, in order to methylate the N7 position of guanines (resulting oligonucleotide named 22A-DMS), thus preventing the formation of hydrogen bonds involved in G-quadruplex formation. When the titration was performed with this oligonucleotide, only a modest increase in fluorescence emission was observed (Fig. 3, open circles). This effect was even more pronounced with the 21G7 control (sequence shown in Fig. 1B), where several guanines have been replaced with 7-deazaG. This modification also prevents the formation of hydrogen bonds involved in G-quadruplex formation. For this oligonucleotide, no significant fluorescence enhancement was observed (Fig. 3, crosses), suggesting that compound 4 does not interact with this oligonucleotide. However, it has been reported that the fluorescence of ethidium bound to dsDNA containing 7-deazaG is strongly quenched (33). Therefore, compounds 2 and 4 might bind to 21G7, but with a reduced fluorescence enhancement. Competition experiments (data not shown) allowed us to conclude that the affinity of 4 for 21G7 was at least 20-fold lower than for 22A or 28G.
Figure 3.

Compared titrations of compound 4 by different oligonucleotides. Compound 4 was prepared at a final concentration of 100 nM, and different oligonucleotides were tested (as indicated in the key). Excitation was set at 355 nm. The total emission (520–700) was summed, and the relative fluorescence intensity (arbitrary units) is given in comparison to free dye emission. The DNA concentration is expressed in nucleotides, as these oligonucleotides have heterogenous lengths. The temperature of the sample was fixed at 20°C.
Finally, the binding of ethidium derivatives to another type of quadruplex was also investigated by fluorescence spectroscopy. T2G4T (Fig. 1B) is able to form an intermolecular parallel quadruplex, provided that the oligonucleotide is incubated for at least 2 days at high strand concentration (>300 µM) in the presence of potassium ions. Non-denaturing gel electrophoresis confirmed that the conversion to a quadruplex species was complete (data not shown). Upon addition of such an oligonucleotide to a 100 nM solution of compound 4, a modest increase in fluorescence quantum yield was obtained (Fig. 3, diamonds). The titration experiments suggested that the affinity of 4 for this parallel quadruplex was somewhat reduced (2–3-fold), whereas competition experiments suggested an even larger decrease in affinity (10-fold lower than for 22A or 28G). In other words, although 4 binds to both types (parallel and antiparallel) of quadruplex, it prefers binding to the antiparallel intramolecular structure, and this binding is associated with a more pronounced increase in fluorescence quantum yield. The affinity for dsDNA was weaker, as shown by the titration curve obtained with a 26 bp DNA duplex (ds26; Fig. 3, triangles).
The fluorescence properties of the other ethidium analogs (1, 2 and 3) were also affected by the addition of a G-quadruplex-forming oligonucleotide, and the data are summarized in Table 2. The addition of a quadruplex-forming oligonucleotide induced an important increase in the fluorescence quantum yield of 2 and 4, and a moderate but significant increase for 3 and 1 (the latter is very weakly fluorescent).
Fluorescence properties of ethidium derivatives
The spectral properties of 2 and 4 are reminiscent of those of ethidium. A 26–31 nm shift in absorbance maxima and a large increase in the quantum yield of ethidium are observed upon binding to a nucleic acid structure (34,35). The quantum yield (and the fluorescence lifetime) of ethidium is increased upon DNA binding as a result of a protection from excited-state deprotonation by the solvent (36). Such a mechanism was demonstrated by the perfect correlation between fluorescence quantum yield and lifetime and by the effect of different solvents. The fluorescence quantum yield of ethidium is also strongly increased upon intercalation into triplex DNA (18,19). Ethidium fluorescence is increased 3–4-fold in a deuteriated aqueous solvent (36,37): the ethidium exchangeable protons are replaced by deuterium, making excited state deprotonation more difficult. A similar increase in relative quantum yield was observed for compound 4: in the presence of 99% D2O, the emission of free 4 was increased 3.5-fold, in good agreement with the data provided for ethidium itself. This might suggest that the mechanism of fluorescence enhancement is similar for these derivatives: the binding to a DNA structure shields the dye from the solvent, and therefore it increases its fluorescence quantum yield. Interestingly, for 4, binding to a parallel-stranded quadruplex leads to a lower increase in fluorescence than binding to an antiparallel intramolecular structure. This suggests that the binding pocket for 4 provided by T2G4T is more exposed to the solvent than the binding site provided by 22A or 28G.
The absorbance properties of ethidium derivatives, as well as the concommittant increase in fluorescence quantum yield upon binding, allowed us to determine whether FRET could occur from the DNA bases to the bound chromophore (not shown). The 22A oligonucleotide was chosen for this experiment. A large difference between the excitation and absorption spectra of 4 was observed below 300 nm, as shown by the wavelength dependence of the fluorescence quantum yield of 4. The nucleic acid bases, the only other species absorbing at wavelengths below 300 nm, were responsible for the observed enhanced emission at 420 nm. Only excitation energy transfer from the bases to 4 can account for the experimental results. Occurrence of FRET from the bases to 4 can be considered as good evidence for dye intercalation—or more likely, end stacking—into the quadruplex, as the 1/R6 distance dependence of excitation energy transfer and the very low quantum yield of the bases give a very short Förster critical distance between the bases and 4.
Ligand-mediated induction of G4-DNA formation revealed by non-denaturing gel electrophoresis
We investigated whether ethidium ligands were able to promote intermolecular G4-DNA formation in an electrophoresis test recently described (27): a perylene derivative (PIPER) was shown to dramatically accelerate the association of a DNA oligomer containing two repeats of the TTAGGG motif. The TR2 oligonucleotide (d-TCAGATAGTTAGGGTTAGGGTTA, 8 µM strand concentration) was incubated at 20°C in a 100 mM KCl buffer. Under these conditions, bimolecular quadruplex formation is slow (27), and little, if any, quadruplex structure is obtained in the absence of G4-ligands (Fig. 4). Adding increasing amounts of 1, 2, 3 or 4 (from 1 to 15 µM) led to the progressive appearance of a new band of slower mobility, corresponding to the formation of a bimolecular quadruplex structure (27) (Fig. 4A). In contrast, ethidium and propidium (a well known ethidium analog) gave very little retarded band (Fig. 4A, bottom gel). These observations are in good agreement with the G-quadruplex-stabilizing effects shown by FRET: the ligands that give a significant stabilization efficiently promote quadruplex formation, as revealed by gel electrophoresis. Similar results were observed with another bimolecular quadruplex, formed by the association of two strands of OX-1T (sequence shown in Fig. 1B). This sequence, which contains two GGGG repeats, associates into a bimolecular quadruplex, provided that ethidium derivatives (1, 2, 3 or 4), but not ethidium itself, were added to the mixture prior to electrophoresis (data not shown). The concentration dependence of the G4 band is shown in Figure 4B for the TR2 oligonucleotide: all four derivatives gave relatively large amounts of G4-DNA (up to 20–40%), as compared to ethidium and propidium, which, at all tested concentrations, induced <6% quadruplex formation. These results are summarized in Table 1.
Figure 4.
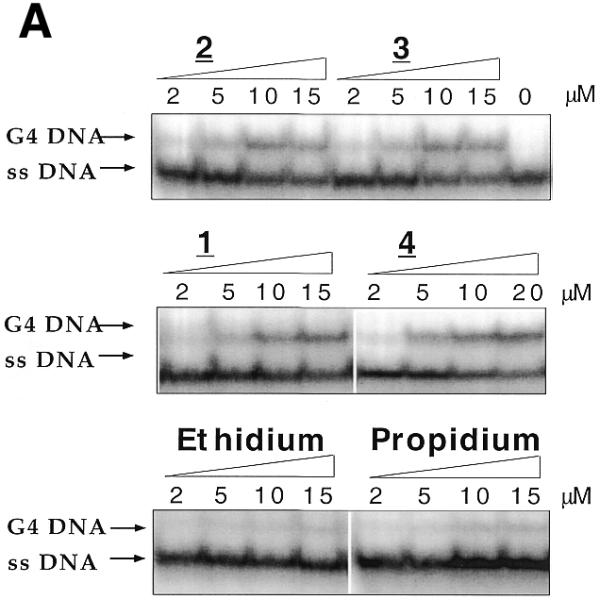

Induction of two different bimolecular G4-DNA by ethidium derivatives. (A) The TR2 oligonucleotide (d-TCAGATAGTTAGGGTTAGGGTTA, 8 µM strand concentration) was incubated at 20°C in a 10 mM Tris/1 mM EDTA buffer containing 100 mM KCl. Ethidium derivatives were added to a final concentration ranging from 0 (left lane) to 15 or 20 µM (right lane). All mixtures were loaded on a non-denaturing 12% polyacrylamide gel (0.5× TBE, 20 mM KCl) and run at 4°C for 6 h (50 V). ssDNA corresponds to the single-stranded species, G4-DNA to the quadruplex. (B) Quantification of the previous gels. Amount (%) of G4-DNA as a function of dye concentration.
Ethidium derivatives may be used as a probe for G4-DNA formation during gel electrophoresis
Ethidium bromide is a universal fluorescent probe used to reveal the presence of DNA bands in a standard agarose gel. Upon UV excitation, red fluorescent bands corresponding to the intercalated dye are observed. These bands are the results of a preferential binding to DNA, which increases the local concentration of the dye, and of an enhanced fluorescence quantum yield of DNA-bound ethidium. The fluorescent properties of the ethidium derivatives described here, and especially of 2 and 4, prompted us to determine whether these dyes could act as G4-DNA specific markers in a standard agarose gel. These two dyes were chosen because of their relatively high fluorecence quantum yield once bound to G-quadruplexes.
To test this hypothesis, two 2.5% agarose gels were prepared in parallel. In one gel, ethidium was added at 65°C to the melted agarose mixture at a final concentration of 0.4 µM, the solution was then poured into a classical gel tray and allowed to solidify at room temperature for 2 h. The second gel was prepared in the same way, except that ethidium was replaced by compound 4. Six different samples were then prepared in a 0.1 M KCl, 0.5× TBE buffer. Digested dsDNA markers (2 µg) were loaded on the left side of each gel, and were compared with 1 µg of three different quadruplex-forming short oligonucleotides (21, 22A and 28G, from left to right). Short oligonucleotides were used as it is difficult to prepare a long quadruplex of defined size. As shown in Figure 5A (left) ethidium bromide was able to reveal dsDNA, but very weakly stained G4-DNA. In contrast, compound 4 only very weakly stained dsDNA (Fig. 5A, right). Intense fluorescent bands were obtained in the right hand side of the gel, confirming that 4 could be used as a fluorescent probe for G4-DNA, using a classical UV-illuminating tray (λexc = 312 nm).
Figure 5.
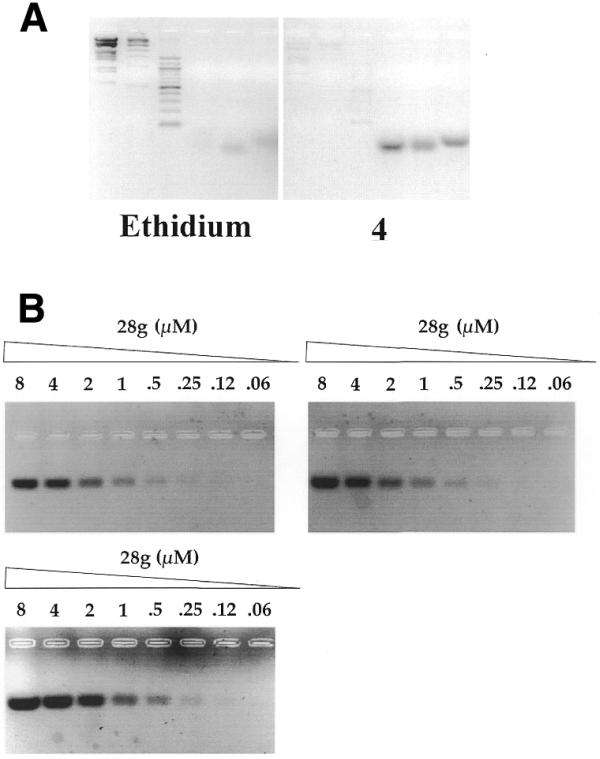
(A) Comparison of ethidium bromide and compound 4 as agarose gel fluorescent probes. Two agarose gels were prepared in parallel. Ethidium bromide (left) or compound 4 (right) (both at 0.4 µM final concentration) were added at 65°C to pre-melted 2.5% agarose, 1× TAE gels. Reading gels from left to right, samples 1–3 (duplex molecular weight markers, 1 µg) and 4–6 (intramolecular quadruplexes, 21, 22A and 28G, 1 µg each) were prepared in a 1× TAE buffer solution with 0.1 M KCl and incubated at room temperature for 1 h. Equivalent amounts (20 µl) of each sample were loaded in each gel. (B) Sensitivity assay. Two-fold stepwise dilutions of an intramolecular quadruplex solution (28G, in 0.1 M KCl, decreasing strand concentrations: 8, 4, 2, 1, 0.5, 0.25, 0.12 and 0.06 µM) were prepared, incubated at 20°C for 1 h and loaded on an agarose gel containing 0.4 µM compound 2 (upper left), 0.4 µM compound 4 (upper right) or 0.1 µM compound 2 (lower left). In each of these gels, the dye was added at 65°C to a pre-melted 2.5% agarose solution, mixed and poured in a standard agarose gel cuvette.
A second series of experiments was then performed to evaluate the sensitivity of the detection assay (Fig. 5B). Serial dilutions of a solution containing a G4-forming oligonucleotide (28G) were prepared in a buffer containing 0.1 M KCl (favorable to quadruplex formation). Aliquots (20 µl) of each solution were loaded in each case, either in an agarose gel containing 0.4 µM of compound 4 (Fig. 5B, right), 0.4 µM of compound 2 (left, upper gel) or 0.1 µM of compound 2 (left, lower gel). In all cases, 0.5 µM of G4-DNA was easily revealed by the fluorescent dye. The highest sensitivity was obtained with a gel stained with 0.1 µM of compound 2 (left, lower gel) which revealed 0.12 µM of quadruplex DNA. This point corresponds to 2.4 pmol (22 ng) of a quadruplex-forming oligonucleotide, showing that compound 2 can be used to reveal tiny amounts of quadruplexes. This sensitivity limit was obtained with a digital camera and contrast enhancement; under more classical conditions, <100 ng of quadruplex DNA could be routinely revealed.
Ethidium derivatives inhibit telomerase in vitro
Telomerase was first identified in ciliates (38,39). This enzyme is an essential factor in immortalization and tumorigenesis (40–43), and is therefore an attractive target for the design of anticancer agents (11–13,44,45), as telomerase is active in most human tumor cells and inactive in normal cells. Optimal telomerase activity requires the non-folded single-stranded form of the primer, and G-quartets have been shown to directly inhibit telomerase in vitro (46). Therefore, an agent that stabilizes these quadruplexes could interfere with telomere replication, affecting telomerase catalytic activity and processivity (47).
A scintillation proximity assay was undertaken to reveal telomerase inhibition, and the results are summarized in Table 2. This assay is derived from the classical TRAP assay initially proposed in 1994 (28). Increasing concentrations of each compound (0.01–10 µg/ml) led to a severe inhibition of telomerase activity. Ethidium was the least efficient inhibitor. The best inhibitors were compounds 1 and 2, with IC50s of 18 and 19 nM, respectively. These compounds are therefore 100-fold more efficient than most G4-based telomerase inhibitors described so far (12–14). In this series, it is interesting to note that the least-stabilizing derivative (3) was also the least-inhibitory compound.
DISCUSSION
Identification of quadruplex ligands
Different approaches have been proposed to isolate G4-specific compounds: molecular modeling/docking (7,48), a DNA polymerase stop assay (49), _T_m experiments (50) and FRET methods (this study). We have chosen to search ligands that would bind to an intramolecular G-quartet, corresponding to approximately four repeats of the human telomeric repeat (22A). A prelimary FRET screen of 100 different compounds allowed us to identify four different ethidium derivatives that stabilized G4-DNA. Spectroscopic methods (UV absorbance and fluorescence) allowed us to demonstrate that these derivatives not only interact with G4-DNA but also actively promote its formation.
Potential applications of these G4-ligands
Our G4-specific ligands might have two types of applications (i) as telomerase inhibitors and (ii) as fluorescent probes for G-quadruplexes. These derivatives have interesting properties, as outlined below.
Specificity for quadruplex DNA. Ethidium itself binds to quadruplexes with an affinity not very different from that for linear duplexes (20). In contrast, compounds 1, 2, 3 and 4 bind more strongly to quadruplex DNA than to duplex DNA. The affinity of compound 4 for dsDNA (a 22-base self-complementary oligodeoxynucleotide of mixed base content) was 9 × 10⁵ M–1 (from a fluorescence titration experiment, data not shown) as compared to ∼107 M–1 for quadruplex DNA and very little affinity for ssDNA. On the other hand, our experiments show that these molecules recognize intra-, bi- and tetra-molecular G-quadruplexes. Concerning intramolecular quadruplexes, 22A and 28G were both good substrates for recognition, showing that the difference in loop size (TTA versus TTTT) was not determinant for binding. In other words, these derivatives have a good affinity for a variety of quadruplex structures, a lower affinity for duplexes, and little, if any, affinity for ssDNA. The dialysis method recently developed by Ren and Chaires (22) should help to determine the relative affinities for a large selection of other DNA/RNA structures.
High affinity. Dissociation constants reported so far for most quadruplex ligands are in the micromolar range (_K_d = 10–6–10–5 M). On the other hand, compound 4 has a dissociation constant <10–7 M, showing that a significant step towards tight binding has been achieved. However, strong binding was only achieved for antiparallel quadruplexes. The affinity for a parallel-stranded DNA quadruplex, obtained by the association of four independent strands, such as T2G4T (Fig. 3) or T2G6T (data not shown) was reduced 2–10-fold.
Intercalative or stacking mode of binding. FRET between the DNA bases and the quadruplex ligands allowed us to demonstrate a close proximity between the G-quartets and the dye. Both intercalation and terminal end stacking would explain such FRET phenomenon, whereas interaction with G4-DNA via the grooves or the connecting loops would probably not lead to any measurable energy transfer from the bases to the ligand. Hard structural evidence, such as NMR spectroscopy, will be required to answer this question. Based on available evidence for planar aromatic molecules, stacking of the drug on the outer planes of the G-quartets might be the most likely model (51).
A fluorescence enhancement upon binding. As for ethidium itself, binding to DNA leads to a strong increase in fluorescence quantum yield for compounds 1, 2, 3 and 4 when bound to G-quadruplexes. However, this increased emission was pronounced for ethidium when dsDNA was present, whereas quadruplex DNA is required to observe such an increase with derivatives 1, 2, 3 and 4. Other fluorescent dyes for quadruplex DNA have been identified previously (7,52). However, they do not have the attractive spectroscopic properties of these ethidium derivatives. Of particular interest is the fact that compounds 2 and 4 could be used in an agarose gel to reveal quadruplex DNA. A carbocyanine dye (DODC) could act in a similar manner (7). However, this dye was ∼100-fold less sensitive, extensive washing was required after staining and its affinity for quadruplex DNA is actually lower than for triplex DNA (53). Derivative 2 can be used in a manner similar to ethidium bromide, and allowed us to reveal the presence of <100 ng of quadruplex DNA, using a standard UV-illuminator.
An efficient inhibition of telomerase. As shown in Table 2, some ethidium derivatives efficiently inhibit telomerase, with IC50 values in the 10–100 nM concentration range. Therefore, these molecules are potent telomerase inhibitors. The best inhibitors were derivatives 1 and 2, and the least-stabilizing derivative, 3, was also the least-inhibitory compound. It should be noted that these molecules also inhibit Taq polymerase, but only at higher drug concentrations (Table 2), showing that they exhibit a certain specificity for telomerase inhibition. These compounds are the best telomerase inhibitors described so far. However, due to the toxic and mutagenic properties of ethidium, the potential applications of these derivatives will probably be restricted to in vitro experiments.
Structure–activity relationships
All four derivatives exhibited a high affinity for quadruplex DNA. Within this subfamily of four derivatives, all dyes stabilized quadruplexes by between 7.9 and 10.6°C, that is, they stabilize quadruplexes roughly in a similar manner. Ethidium itself is indeed a quadruplex ligand (20), but a rather poor one (22): its stabilizing effect on G4-DNA measured by FRET is only 0.6°C at 1 µM concentration. Two commercial ethidium derivatives were also investigated: propidium iodide and hexidium. Both dyes share the presence of a longer side chain. Despite the presence of a second positive charge on propidium, very little stabilization of G4-DNA was observed (Δ_T_1/2 < 1°C), and little induction of bimolecular quadruplex was revealed on an acrylamide gel (7% at 10 µM dye concentration). Hexidium failed to exhibit any G4-binding activity (not shown). These results show that the presence of a positively charged and/or bulky substituent is not a sufficient condition to observe quadruplex recognition. Efforts are now being made to develop new derivatives with improved affinity and selectivity, based on the data presented here.
Acknowledgments
ACKNOWLEDGEMENTS
We thank T.Germe, J.B.Chaires and T.Garestier for helpful discussions, E.Renou for technical support and P.Steele for moral support. This work was supported by the INSERM, the CNRS, the MNHN, a CNRS–Aventis contract, and a CNRS-PCV grant.
References
- 1.Greider C.W. (1998) Telomerase activity, cell proliferation, and cancer. Proc. Natl Acad. Sci. USA, 95, 90–92. [DOI] [PMC free article] [PubMed] [Google Scholar]
- 2.Makarov V.L., Hirose,Y. and Langmore,J.P. (1997) Long G tails at both ends of human chromosomes suggest a C strand degradation mechanism for telomere shortening. Cell, 88, 657–666. [DOI] [PubMed] [Google Scholar]
- 3.Lingner J., Cooper,J.P. and Cech,T.R. (1995) Telomerase and DNA end replication: no longer a lagging strand problem? Science, 269, 1533–1534. [DOI] [PubMed] [Google Scholar]
- 4.Oka Y. and Thomas,C.A.,Jr (1987) The cohering telomeres of Oxytricha. Nucleic Acids Res., 15, 8877–8898. [DOI] [PMC free article] [PubMed] [Google Scholar]
- 5.Sundquist W.I. and Klug,A. (1989) Telomeric DNA dimerizes by formation of guanine tetrads between hairpin loops. Nature, 342, 825–829. [DOI] [PubMed] [Google Scholar]
- 6.Williamson J.R., Raghuraman,M.K. and Cech,T.R. (1989) Monovalent cation induced structure of telomeric DNA: the G-quartet model. Cell, 59, 871–880. [DOI] [PubMed] [Google Scholar]
- 7.Chen Q., Kuntz,I.D. and Shafer,R.H. (1996) Spectroscopic recognition of guanine dimeric hairpin quadruplexes by a carbocyanine dye. Proc. Natl Acad. Sci. USA, 93, 2635–2639. [DOI] [PMC free article] [PubMed] [Google Scholar]
- 8.Sun D., Thompson,B., Cathers,B.E., Salazar,M., Kerwin,S.M., Trent,J.O., Jenkins,T.C., Neidle,S. and Hurley,L.H. (1997) Inhibition of human telomerase by a G-quadruplex-interactive compound. J. Med. Chem., 40, 2113–2116. [DOI] [PubMed] [Google Scholar]
- 9.Wheelhouse R.T., Sun,D., Han,H., Han,F.X. and Hurley,L.H. (1998) Cationic porphyrins as telomerase inhibitors: the interaction of tetra (_N_-methyl-4-pyridyl) porphyrin with quadruplex DNA. J. Am. Chem. Soc., 120, 3261–3262. [Google Scholar]
- 10.Perry P.J., Reszka,A.P., Wood,A.A., Read,M.A., Gowan,S.M., Dosanjh,H.S., Trent,J.O., Jenkins,T.C., Kelland,L.R. and Neidle,S. (1998) Human telomerase inhibition by regioisomeric disubstituted amidoanthracene-9,10-diones. J. Med. Chem., 41, 4873–4884. [DOI] [PubMed] [Google Scholar]
- 11.Mergny J.L. and Hélène,C. (1998) G-quadruplex DNA: a target for drug design. Nature Med., 4, 1366–1367. [DOI] [PubMed] [Google Scholar]
- 12.Perry P.J. and Jenkins,T.C. (1999) Recent advances in the development of telomerase inhibitors for the treatment of cancer. Exp. Opin. Invest. Drug., 8, 1981–2008. [DOI] [PubMed] [Google Scholar]
- 13.Kerwin S.M. (2000) G-quadruplex DNA as a target for drug design. Curr. Pharm. Des., 6, 441–471. [DOI] [PubMed] [Google Scholar]
- 14.Han H.Y. and Hurley,L.H. (2000) G-quadruplex DNA: a potential target for anti-cancer drug design. Trends Pharmacol. Sci., 21, 136–142. [DOI] [PubMed] [Google Scholar]
- 15.Mergny J.L., Phan,A.T. and Lacroix,L. (1998) Following G-quartet formation by UV-spectroscopy. FEBS Lett., 435, 74–78. [DOI] [PubMed] [Google Scholar]
- 16.Mergny J.L., Duval-Valentin,G., Nguyen,C.H., Perrouault,L., Faucon,B., Rougée,M., Montenay-Garestier,T., Bisagni,E. and Hélène,C. (1992) Triple helix specific ligands. Science, 256, 1691–1694. [DOI] [PubMed] [Google Scholar]
- 17.Le Pecq J.B. and Paoletti,C. (1967) A fluorescent complex between ethidium bromide and nucleic acids. Physical–chemical characterization. J. Mol. Biol., 27, 87–106. [DOI] [PubMed] [Google Scholar]
- 18.Mergny J.L., Collier,D., Rougée,M., Montenay-Garestier,T. and Hélène,C. (1991) Intercalation of ethidium bromide in a triple-stranded oligonucleotide. Nucleic Acids Res., 19, 1521–1526. [DOI] [PMC free article] [PubMed] [Google Scholar]
- 19.Scaria P.V. and Shafer,R.H. (1991) Binding of ethidium bromide to a DNA triple helix. J. Biol. Chem., 266, 5417–5423. [PubMed] [Google Scholar]
- 20.Guo Q., Lu,M., Marky,L.A. and Kallenbach,N.R. (1992) Interaction of the dye ethidium bromide with DNA containing guanine repeats. Biochemistry, 31, 2451–2455. [DOI] [PubMed] [Google Scholar]
- 21.Shida T., Ikeda,N. and Sekiguchi,J. (1996) Drug binding to higher ordered DNA structures: ethidium bromide complexation with parallel quadruple-stranded DNA. Nucl. Nucl ., 15, 599–605. [Google Scholar]
- 22.Ren J.S. and Chaires,J.B. (1999) Sequence and structural selectivity of nucleic acid binding ligands. Biochemistry, 38, 16067–16075. [DOI] [PubMed] [Google Scholar]
- 23.Cain B.F., Atwell,G.J. and Seelye,R.N. (1969) Potential antitumour agents. X. Bisquaternary salts. J. Med. Chem., 12, 199–206. [DOI] [PubMed] [Google Scholar]
- 24.Berg S.S. (1960) Structure of isometamidium (M. and B. 4180A), 7-_m_-amidinophenyldiazamino-2-amino-10-ethyl-9-phenylphenanthridium chloride hydrochloride, the red isomer present in metamidium. Nature, 188, 1106–1107. [Google Scholar]
- 25.Mills M., Arimondo,P., Lacroix,L., Garestier,T., Hélène,C., Klump,H.H. and Mergny,J.L. (1999) Energetics of strand displacement reactions in triple helices: a spectroscopic study. J. Mol. Biol., 291, 1035–1054. [DOI] [PubMed] [Google Scholar]
- 26.Mergny J.L. (1999) Fluorescence energy transfer as a probe for tetraplex formation: the i-motif. Biochemistry, 38, 1573–1581. [DOI] [PubMed] [Google Scholar]
- 27.Han H.Y., Cliff,C.L. and Hurley,L.H. (1999) Accelerated assembly of G-quadruplex structures by a small molecule. Biochemistry, 38, 6981–6986. [DOI] [PubMed] [Google Scholar]
- 28.Kim N.W., Piatyszek,M.A., Prowse,K.R., Harley,C.B., West,M.D., Ho,P.L.C., Coviello,G.M., Wright,W.E., Weinrich,S.L. and Shay,J.W. (1994) Specific association of human telomerase activity with immortal cells and cancer. Science, 266, 2011–2015. [DOI] [PubMed] [Google Scholar]
- 29.Krupp G., Kuhne,K., Tamm,S., Klapper,W., Heidorn,K., Rott,A. and Parwaresch,R. (1997) Molecular basis of artifacts in the detection of telomerase activity and a modified primer for a more robust ‘TRAP’ assay. Nucleic Acids Res., 25, 919–921. [DOI] [PMC free article] [PubMed] [Google Scholar]
- 30.Wang Y. and Patel,D.J. (1993) Solution structure of the human telomeric repeat d[AG3(T2AG3)3] G-tetraplex. Structure, 1, 263–282. [DOI] [PubMed] [Google Scholar]
- 31.Aboul-ela F., Murchie,A.I.H. and Lilley,D.M.J. (1992) NMR study of parallel-stranded tetraplex formation by the hexadeoxynucleotide d(TG4T). Nature, 360, 280–282. [DOI] [PubMed] [Google Scholar]
- 32.Crothers D.M. (1971) Statistical thermodynamics of nucleic acids melting transitions with coupled binding equilibra. Biopolymers, 10, 2147–2160. [DOI] [PubMed] [Google Scholar]
- 33.Latimer L.J. and Lee,J.S. (1991) Ethidium bromide does not fluoresce when intercalated adjacent to 7-deazaguanine in duplex DNA. J. Biol. Chem., 266, 13849–13851. [PubMed] [Google Scholar]
- 34.Le Pecq J.B. and Paoletti,C. (1965) Etudes des réactions de déplacement entre polyribonucléotides à l’aide du bromhydrate d’éthidium (BET). Mise en évidence du déplacement du poly(A-2 I) par le poly U. C.R. Acad. Sci. Paris, 261, 838–841. [PubMed] [Google Scholar]
- 35.Waring M.J. (1965) Complex formation between ethidium bromide and nucleic acids. J. Mol. Biol., 13, 269–282. [DOI] [PubMed] [Google Scholar]
- 36.Olmsted J.,III and Kearns,D.R. (1977) Mechanism of ethidium bromide fluorescence enhancement on binding to nucleic acids. Biochemistry, 16, 3647–3654. [DOI] [PubMed] [Google Scholar]
- 37.Atherton S.J. and Beaumont,P.C. (1984) Ethidium bromide as a fluorescent probe of the accessibility of water to the interior of DNA. Photochem. Photobiol., 8, 103–113. [Google Scholar]
- 38.Greider C.W. and Blackburn,E.H. (1985) Identification of a specific telomere terminal transferase activity in Tetrahymena extracts. Cell, 43, 405–413. [DOI] [PubMed] [Google Scholar]
- 39.Greider C.W. and Blackburn,E.H. (1987) The telomere terminal transferase of Tetrahymena is a ribonucleoprotein enzyme with two kinds of primer specificity. Cell, 51, 887–898. [DOI] [PubMed] [Google Scholar]
- 40.Meyerson M., Counter,C.M., Eaton,E.N., Ellisen,L.W., Steiner,P., Caddle,S.D., Ziaugra,L., Beijersbergen,R.L., Davidoff,M.J., Liu,Q.Y., Bacchetti,S., Haber,D.A. and Weinberg,R.A. (1997) hEST2, the putative human telomerase catalytic subunit gene, is up-regulated in tumor cells and during immortalization. Cell, 90, 785–795. [DOI] [PubMed] [Google Scholar]
- 41.Counter C.M., Hahn,W.C., Wei,W.Y., Caddle,S.D., Beijersbergen,R.L., Lansdorp,P.M., Sedivy,J.M. and Weinberg,R.A. (1998) Dissociation among in vitro telomerase activity, telomere maintenance, and cellular immortalization. Proc. Natl Acad. Sci. USA, 95, 14723–14728. [DOI] [PMC free article] [PubMed] [Google Scholar]
- 42.Hahn W.C., Stewart,S.A., Brooks,M.W., York,S.G., Eaton,E., Kurachi,A., Beijersbergen,R.L., Knoll,J.H.M., Meyerson,M. and Weinberg,R.A. (1999) Inhibition of telomerase limits the growth of human cancer cells. Nature Med., 5, 1164–1170. [DOI] [PubMed] [Google Scholar]
- 43.Hahn W.C., Counter,C.M., Lundberg,A.S., Beijersbergen,R.L., Brooks,M.W. and Weinberg,R.A. (1999) Creation of human tumour cells with defined genetic elements. Nature, 400, 464–468. [DOI] [PubMed] [Google Scholar]
- 44.Mergny J.L., Mailliet,P., Lavelle,F., Riou,J.F., Laoui,A. and Hélène,C. (1999) The development of telomerase inhibitors: the G-quartet approach. Anti Cancer Drug Des., 14, 327–339. [PubMed] [Google Scholar]
- 45.Neidle S. and Kelland,L.R. (1999) Commentary. Telomerase as an anti-cancer target: current status and future prospects. Anti Cancer Drug Des., 14, 341–347. [PubMed] [Google Scholar]
- 46.Zahler A.M., Williamson,J.R., Cech,T.R. and Prescott,D.M. (1991) Inhibition of telomerase by G-quartet DNA structures. Nature, 350, 718–720. [DOI] [PubMed] [Google Scholar]
- 47.Sun D., Lopez-Guajardo,C.C., Quada,J., Hurley,L.H. and Von Hoff,D.D. (1999) Regulation of catalytic activity and processivity of human telomerase. Biochemistry, 38, 4037–4044. [DOI] [PubMed] [Google Scholar]
- 48.Shafer R.H. (1998) Stability and structure of model DNA triplexes and quadruplexes and their interactions with small ligands. In Moldave,K. (ed.), Progress in Nucleic Acid Research. Academic Press Inc., London, Vol. 59, pp 55–94. [DOI] [PubMed]
- 49.Han H.Y., Hurley,L.H. and Salazar,M. (1999) A DNA polymerase stop assay for G-quadruplex-interactive compounds. Nucleic Acids Res., 27, 537–542. [DOI] [PMC free article] [PubMed] [Google Scholar]
- 50.Han F.X.G., Wheelhouse,R.T. and Hurley,L.H. (1999) Interactions of TMPyP4 and TMPyP2 with quadruplex DNA. Structural basis for the differential effects on telomerase inhibition. J. Am. Chem. Soc., 121, 3561–3570. [Google Scholar]
- 51.Fedoroff O.Y., Salazar,M., Han,H., Chemeris,V.V., Kerwin,S.M. and Hurley,L.H. (1998) NMR-based model of a telomerase inhibiting compound bound to G-quadruplex DNA. Biochemistry, 37, 12367–12374. [DOI] [PubMed] [Google Scholar]
- 52.Arthanari H., Basu,S., Kawano,T.L. and Bolton,P.H. (1998) Fluorescent dyes specific for quadruplex DNA. Nucleic Acids Res., 26, 3724–3728. [DOI] [PMC free article] [PubMed] [Google Scholar]
- 53.Ren J. and Chaires,J.B. (2000) Preferential binding of 3,3́-diethyloxadicarbocyanine to triplex DNA. J. Am. Chem. Soc., 122, 424-425. [Google Scholar]