J1-M267 Y lineage marks climate-driven pre-historical human displacements (original) (raw)
Abstract
The present day distribution of Y chromosomes bearing the haplogroup J1 M267*G variant has been associated with different episodes of human demographic history, the main one being the diffusion of Islam since the Early Middle Ages. To better understand the modes and timing of J1 dispersals, we reconstructed the genealogical relationships among 282 M267*G chromosomes from 29 populations typed at 20 YSTRs and 6 SNPs. Phylogenetic analyses depicted a new genetic background consistent with climate-driven demographic dynamics occurring during two key phases of human pre-history: (1) the spatial expansion of hunter gatherers in response to the end of the late Pleistocene cooling phases and (2) the displacement of groups of foragers/herders following the mid-Holocene rainfall retreats across the Sahara and Arabia. Furthermore, J1 STR motifs previously used to trace Arab or Jewish ancestries were shown unsuitable as diagnostic markers for ethnicity.
Keywords: Y chromosome, haplogroup J1, human population history, Holocene
Introduction
Human Y chromosomes bearing the M267*G variant (defining haplogroup J1) are distributed over a vast area comprising Europe, South-western Asia, the Arabian peninsula, North and East Africa. Eight downstream SNPs have been identified so far along the J1 genealogy,1 none of which reaches appreciable frequencies in any population. Many authors have proposed STR-based motifs to trace the genealogies of pre-historic or ethno-religious ancestries. Examples are the Dys388*13 allele associated with early neolithic agro–pastoral cultures (King RJ and Underhill P, personal communication); the Galilee and the Dys388*17/YCAIIa/b*22–22 motifs for an Arab ancestry,2, 3 the Cohanim 6-locus motif to link the descendants of a Jewish priesthood.4 However, a wide range of times since the most recent common ancestor (TMRCAs) has been proposed for J1 and its subclades (between 36 and 10 KyBP), and different conflicting scenarios have been depicted to explain their current distribution.3, 5, 6, 7, 8, 9
Materials and methods
We surveyed the variation at 20 STR loci and at 6 SNPs in 282 J1 Y chromosomes of native unrelated donors from 29 populations. Ethnic data, genotyping protocols, quality standards, details of data analyses and haplotypes are provided as supplemental material (Supplementary Tables S1–6).
Results and discussion
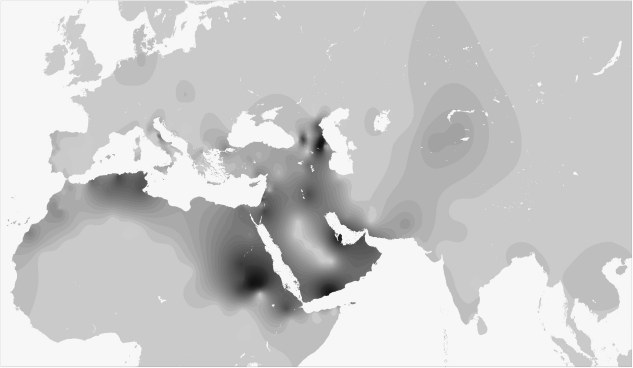
A fine-grained map of the present day distribution of J1 chromosomes is given in Figure 1. The pattern is uneven, as is typical of Y lineages with a very deep genealogy and low-size demes. Frequency peaks over 50% of the whole binary variation are present in Arabia (Yemen, Qatar), Northern Caucasus (Dagestan), Sudan and in Negev Bedouins (Supplementary Table S1). Frequency is inversely correlated to haplotype diversity (_R_2=0.387, P<0.001, Supplementary Table S6), with Near Easterners showing the highest diversity, Dagestanians and Arabic Sudanese the lowest. No major J1 sublineage was defined by genotyped SNPs (Supplementary Table S1) confirming the need for future research efforts in this direction. Nevertheless, in the Amhara from Ethiopia, we found the very first case of a M368(xM367) chromosome, which supports the insertion of the paragroup J1e1* in the latest Y haplogroup phylogeny.1
Figure 1.
Contour map showing the present day distribution of J1 and J*(xJ2) chromosomes. Gridding was carried out starting from 336 frequency points (Supplementary Table S3) with SURFIT 2.1 (http://surfit.sourceforge.net/index.html). Spatial surfaces were computed using GMT 4.3.1 (http://gmt.soest.hawaii.edu). Methodological details are available on request.
With the exception of the rare Palestinian modal haplotype,10 none of the previously described STR motifs resulted equal by descent, as they were found across ethnic groups with different cultural or geographic affiliation and in other lineages (J2, I*) than J1. Such results make their use to trace ancestries of individuals or communities (ie, Arab or Jewish) inconclusive. Calculations under the coalescent model for J1 haplotypes bearing the Cohanim motif gave time estimates that place the origin of this genealogy around 6.2 Kybp (95% CI: 4.5–8.6 Kybp), earlier than previously thought,4 and well before the origin of Judaism (David Kingdom, ∼2.0 Kybp).
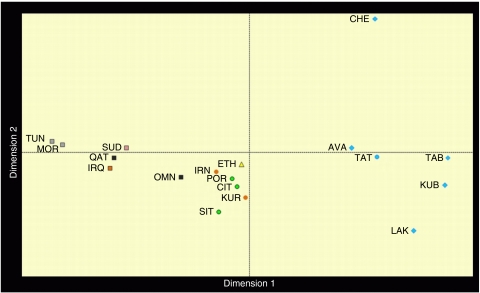
Mismatch and multivariate analyses (Table 1, Figure 2) both pointed to common features for the Y chromosomes of Arabic speakers from Maghrib, Sudan, Iraq and Qatar (the Arabic pool). They show low diversity values, narrow mismatch curves with mode at 5–6 mutational steps and proximity at one side of the multidimensional genetic space. Opposite features were observed in a heterogeneous group, including Europeans, Kurds, Iranians and Ethiopians (the Eurasian pool); they show high haplotype diversity, are characterized by ragged mismatch curves with modes in the 11–16 range and cluster at the centre of the MDS plot. Omanis show a mix of Eurasian pool-like and typical Arabic haplotypes as expected, considering the role of corridor played at different times by the Gulf of Oman in the dispersal of Asian and East African genes.7
Table 1. Descriptive and inferential statistics calculated for 20-locus haplotypes on 282 J1-M267 Y chromosomes.
| | | | | | | | Median TMRCA (95% CI) | Median N_e_ | | | | ----------------------- | --------------- | --------------------------------------------------- | ---------- | --------------- | --------------- | ----------------------- | ---------------------- | --------------------------------- | ---- | | | N | %a | Mean pairwise difference (sum of size difference) | Mode | Rb | Pc | Constant size | Population growth | Constant size+population growth | | | Metapopulation | | | | | | | | | | | Dagestan Avars | 16 | 80.0 | 11.44±6.81 | 7 | 0.032 | 0.000 | | | | | Dagestan Chechens | 12 | 61.9 | 3.78±7.21 | 1 | 0.135 | ND | | | | | Dagestan Kubachians | 12 | 85.7 | 7.71±3.94 | 8 | 0.061 | 0.023 | 11 711 (8930–15 460) | | 464 | | Dagestan Laks | 9 | 42.9 | 8.61±4.70 | 10 | 0.184 | 0.007 | | | | | Dagestan Tabasarans | 23 | 76.7 | 6.40±4.12 | 6 | 0.017 | 0.000 | | | | | Dagestan Tats | 13 | 65.0 | 9.26±7.21 | 1 | 0.026 | 0.000 | | | | | | | | | | | | | | | | | Tunisia | 18 | 30.1 | 3.93±2.83 | 1 | 0.019 | 0.002 | 6799 (4227–10 826) | | | | Morocco | 10 | 10.0 | 3.98±2.32 | 5 | 0.023 | 0.063 | | | | | | | | | | | | | | | | | Iraq | 15 | 26.7 | 6.13±2.32 | 6 | 0.014 | ND | | | | | Qatar | 20 | 58.3 | 6.53±3.88 | 5 | 0.020 | 0.023 | 7201 (4553–12 220) | 7150 (6650–9650) | 477 | | Arabic Sudanese | 26 | 74.3 | 5.51±2.46 | 5 | 0.016 | 0.021 | | | | | | | | | | | | | | | | | Oman | 20 | 29.9 | 10.38±6.18 | 11 | 0.024 | 0.000 | 12 319 (7762–19 063) | | | | Italy (central) | 20 | 2.4 | 11.21±3.58 | 11 | 0.007 | 0.334 | 13 815 (10 742–18 413) | | 2301 | | Italy (southern) | 7 | 5.3 | 10.29±3.18 | 11 | 0.023 | ND | | | | | Portugal | 23 | 3.8 | 11.34±3.94 | 14 | 0.011 | 0.006 | | | | | Ethiopia | 20 | 18.0 | 12.73±5.13 | 13 | 0.015 | 0.000 | | | | | Western Asia | 5 | 14.1 | 13.20±5.27 | 16 | 0.460 | ND | | | | | Southern Asia | 9 | 10.6 | 14.78±6.11 | 14 | 0.120 | 0.218 | | | | | Total J1-M267 | 282 | | | | | | 22 537 (6643–47 439) | | 6485 | | | | | | | | | | | | | | Clade/motif | | | | | | | | | | | Galilee | 56 | 18.4 | 4.07±2.19 | 4 | 0.018 | 0.001 | 5510 (3823–7747) | 5923 (3766–9672) | 250 | | Dys388*17/YCAII*22-22 | 85 | 30.1 | 5.02±2.38 | 4 | 0.013 | 0.000 | 6280 (4762–7914) | 6113 (2587–11 138) | 314 | | Palestinian | 4 | 1.4 | 4.00±3.69 | 17 | 0.306 | ND | | | | | Bedouin | 0 | 0.0 | | | | | | | | | Cohanim | 25 | 8.2 | 7.43±2.47 | 9 | 0.089 | ND | 6239 (4541–8647) | | 266 | | Dys388*13 | 76 | 27.0 | 9.36±4.04 | 10 | 0.004 | 0.000 | 10 113 (5780–16 236) | | 399 | | YCAIIa*19 | 30 | 10.6 | 13.17±4.65 | 10 | 0.012 | 0.000 | 10 949 (8624–14 741) | | 556 |
Figure 2.
MDS plot of pairwise _F_ST distances among 18–locus haplotypes (alleles at duplicated loci Dys385a/b and YCAIIa/b were pooled). Stress value (0.07775) denotes a statistically significant departure from random structure.13 Dots colour: light blue=Dagestan groups, black=Arabian groups, Grey=Maghrebian groups, Purple=Sudanese groups, Green=European groups, Orange=SW Asian groups, Yellow=Ethiopian groups. Dots' shape: squares=Arabic-speaking groups; circles=Indo-European-speaking groups; diamonds=North-Caucasian-speaking groups; triangle=Semitic (non-Arabic)-speaking groups (the colour reproduction of this figure is available on the full text version of the manuscript).
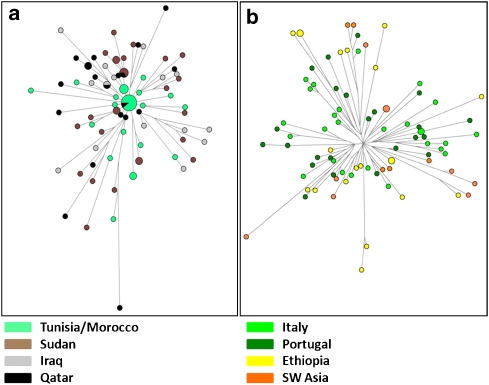
We wondered whether clustering and similarities among mismatch curves in the Arabic pool reflect shared evolutionary history, following the hypothesis of a diffusion of J1 chromosomes mediated by the spread of Islam since 650 AD.2, 3, 9 To investigate this aspect in more detail, we compared the haplotype genealogy of the Eurasian and Arabic pools by using Median-joining networks constructed as described9 (Figure 3). The genealogy of the Arabic pool shows a star-like pattern with no geographic structuring. This feature supports a demic expansion from ancestral haplotypes currently shared by Maghrebians and Arabians and subsequent migrations. The Eurasian genealogy is deeper and suggests a longer evolution under constant size. Accordingly, we assigned priors under different size models while applying a Bayesian approach14 to estimate coalescence times for samples' genealogies (Table 1). Results for Arabic populations and associated STR motifs (Galilee, Dys388*17/YCAII*22–22) excluded the timeline of the Arab expansion (1.35 KyBP), even from their lower confidence bounds, and pointed to a mid-Holocene time frame of 5.5–7.2 KyBP (median TMRCAs). This time window is related to a pre-historic phase of regionalisation in the human occupation of Sahara and Arabia, when semi-nomadic tribes, once diffused all over the Desert, retreated in water-rich refuges (ie, the Atlas range,15 the Sudanese plateau,16 Southern Arabia17) as a consequence of the rapid decline of monsoon rainfalls. In Eastern Sahara, it is associated with the rise of a dual productive economy, where specialised cattle pastoralism came to coexist with sedentary lifestyles, cereal farming and pottery production, clearly rooted in near East traditions. The genetic legacy of the mid-Holocene dispersal of foraging groups in the Sudanese Sahara, North Africa and Arabia would be tracked by Arabic J1-M267 chromosomes while the dispersal of agro–pastoralists with near eastern origins by other Y (E1b-M34 and E1b-M7818) or mitochondrial (U6b19) lineages.
Figure 3.
Network of 20-locus J1 haplotypes. (a) Arabic pool genealogy, (b) Eurasian pool genealogy. Area is proportional to frequency (the colour reproduction of this figure is available on the full text version of the manuscript).
As regards chromosomes bearing alleles Dys388*13 and YCAIIa*19, which are common in populations of the Eurasian pool and in Northern Caucasians, we, in general, obtained Late Pleistocene coalescence times – around 10.1–10.9 KyBP as average median values. These time estimates, summed to the high variation and wide distribution of these subclades, are consistent with the episodes of spatial re-expansion that occurred after the Last Glacial Maximum in the northern hemisphere, the latest being triggered by the end of the Younger Dryas event (12.9–11.6 KyBP20). The different pattern observed (namely, frequency peaks in the Caucasus and Anatolia for Dys388*13, in Ethiopia and south-western Asia with the absence of haplotypes of the Arabic pool for YCAIIa*19) does not deviate from random expectations of frequency shifts under an extended Wright–Fisher model (_P_≫0.05).
To resume, our results clearly reject the scenario put forward so far of a strict correlation between the Arab expansion in historical times and the overall pattern of distribution of J1-related chromosomes. Similarly, the causal association between STR-defined haplotypes and ethnic groups appear without any robust support, making its use inadequate for forensic or genealogical purposes. Instead, J1 variation provided the genetic background to correlate climatic changes to human demographic and socio-cultural events scarcely documented in the archaeological record – the dispersal of hunter gatherers after the termination of glacial conditions in the late Pleistocene and the desertification-driven retreat of tribes of Saharan and Arabian foragers in the transition to a food-producing economy.
Acknowledgments
We thank Davide Merlitti for his precious support in the computational design. Publication of this study was made possible by the 60% grants to GP and ST by the University of Pisa. CC is a RCUK academic fellow. The collaboration with the University of Gezira is within the framework of the activities developed by the Center of Excellence on Aging (CeSI) of Chieti, Italy, as Special Consultant of ECOSOC of the United Nations.
Footnotes
Supplementary Material
Supplementary Table S1
Supplementary Table S2
Supplementary Table S3
Supplementary Table S4
Supplementary Table S5
Supplementary Figure S1
References
- Karafet TM, Mendez FL, Meilerman MB, Underhill PA, Zegura SL, Hammer MF. New binary polymorphisms reshape and increase resolution of the human Y chromosomal haplogroup tree. Genome Res. 2008;18:830–838. doi: 10.1101/gr.7172008. [DOI] [PMC free article] [PubMed] [Google Scholar]
- Nebel A, Landau-Tasseron E, Filon D, Oppenheim A, Faerman M. Genetic evidence for the expansion of Arabian tribes into the Southern Levant and North Africa. Am J Hum Genet. 2002;70:1594–1596. doi: 10.1086/340669. [DOI] [PMC free article] [PubMed] [Google Scholar]
- Semino O, Magri C, Benuzzi G, et al. Origin, diffusion and differentiation of Y-chromosome haplogroups E and J: inferences on the neolithization of Europe and later migratory events in the Mediterranean area. Am J Hum Genet. 2004;74:1023–1034. doi: 10.1086/386295. [DOI] [PMC free article] [PubMed] [Google Scholar]
- Thomas MG, Skorecki K, Ben-Ami H, Parfitt T, Bradman N, Goldstein DB. Origins of Old Testament priests. Nature. 1998;394:138–140. doi: 10.1038/28083. [DOI] [PubMed] [Google Scholar]
- Di Giacomo F, Luca F, Popa LO, et al. Y chromosomal haplogroup J as a signature of the post-neolithic colonization of Europe. Hum Genet. 2004;115:357–371. doi: 10.1007/s00439-004-1168-9. [DOI] [PubMed] [Google Scholar]
- Arredi B, Poloni ES, Paracchini S, et al. A predominantly Neolithic origin for Y-chromosomal DNA variation in North Africa. Am J Hum Genet. 2004;75:338–345. doi: 10.1086/423147. [DOI] [PMC free article] [PubMed] [Google Scholar]
- Cadenas AM, Zhivotovsky LA, Cavalli-Sforza LL, Underhill PA, Herrera RJ. Y-chromosome diversity characterizes the Gulf of Oman. Eur J Hum Genet. 2008;16:374–386. doi: 10.1038/sj.ejhg.5201934. [DOI] [PubMed] [Google Scholar]
- Zalloua PA, Xue Y, Khalife J, et al. Y-chromosomal diversity in Lebanon is structured by recent historical events. Am J Hum Genet. 2008;82:873–882. doi: 10.1016/j.ajhg.2008.01.020. [DOI] [PMC free article] [PubMed] [Google Scholar]
- Chiaroni J, King RJ, Underhill P. Correlation of annual precipitation with human Y chromosome diversity and the emergence of Neolithic agriculture and pastoral economies in the fertile crescent. Antiquity. 2008;82:281–289. [Google Scholar]
- Nebel A, Filon D, Weiss D, et al. High-resolution Y chromosome haplotypes of Israeli and Palestinian Arabs reveal geographic substructure and substantial overlap with haplotypes of Jews. Hum Genet. 2000;107:630–641. doi: 10.1007/s004390000426. [DOI] [PubMed] [Google Scholar]
- Harpending HC. Signature of ancient population growth in a low-resolution mitochondrial DNA mismatch distribution. Hum Biol. 1994;66:591–600. [PubMed] [Google Scholar]
- Rogers A. Genetic evidence for a Pleistocene population explosion. Evolution. 1995;49:608–615. doi: 10.1111/j.1558-5646.1995.tb02297.x. [DOI] [PubMed] [Google Scholar]
- Sturrock K, Rocha J. A multidimensional scaling stress evaluation table. Field methods. 2000;12:49–60. [Google Scholar]
- Wilson IJ, Balding DJ. Genealogical inference from microsatellite data. Genetics. 1998;150:499–510. doi: 10.1093/genetics/150.1.499. [DOI] [PMC free article] [PubMed] [Google Scholar]
- Cheddadi R, Lamb HF, Guiot J, van der Kaars S. Holocene climatic change in Morocco: a quantitative reconstruction from pollen data. Clim Dyn. 1998;14:883–890. [Google Scholar]
- Kuper R, Kröpelin S. Climate-controlled Holocene occupation in the Sahara: motor of Africa's evolution. Science. 2006;313:803–807. doi: 10.1126/science.1130989. [DOI] [PubMed] [Google Scholar]
- Edens C, Wilkinson TJ. Southwest Arabia during the Holocene: recent archaeological developments. J World Prehist. 1998;12:55–119. [Google Scholar]
- Cruciani F, LaFratta R, Santolamazza P, et al. Phylogeographic analysis of haplogroup E3b (E-M215) Y chromosomes reveals multiple migratory events within and out of Africa. Am J Hum Genet. 2004;74:1014–1022. doi: 10.1086/386294. [DOI] [PMC free article] [PubMed] [Google Scholar]
- Maca-Meyer N, González AM, Pestano J, Flores C, Larruga JM, Cabrera VM. Mitochondrial DNA transit between West Asia and North Africa inferred from U6 phylogeography. BMC Genet. 2003;16:4–15. doi: 10.1186/1471-2156-4-15. [DOI] [PMC free article] [PubMed] [Google Scholar]
- Firestone RB, West A, Kennett JP, et al. Evidence for an extraterrestrial impact 12,900 years ago that contributed to the megafaunal extinction and the Younger Dryas cooling. Proc Natl Acad Sci USA. 2007;104:16016–16021. doi: 10.1073/pnas.0706977104. [DOI] [PMC free article] [PubMed] [Google Scholar]
Associated Data
This section collects any data citations, data availability statements, or supplementary materials included in this article.
Supplementary Materials
Supplementary Table S1
Supplementary Table S2
Supplementary Table S3
Supplementary Table S4
Supplementary Table S5
Supplementary Figure S1


