Hyperglycemia limits experimental aortic aneurysm progression (original) (raw)
. Author manuscript; available in PMC: 2011 Oct 1.
Published in final edited form as: J Vasc Surg. 2010 Aug 3;52(4):975–983. doi: 10.1016/j.jvs.2010.05.086
Abstract
Objective
Diabetes mellitus (DM) is associated with reduced progression of abdominal aortic aneurysm (AAA) disease. Mechanisms responsible for this negative association remain unknown. We created AAAs in hyperglycemic mice to examine the influence of serum glucose concentration on experimental aneurysm progression.
Methods
Aortic aneurysms were induced in hyperglycemic (DM) and normoglycemic models by using intra-aortic porcine pancreatic elastase (PPE) infusion in C57BL/6 mice or by systemic infusion of angiotensin II (ANG) in apolipoprotein E-deficient (ApoE−/−) mice, respectively. In an additional DM cohort, insulin therapy was initiated after aneurysm induction. Aneurysmal aortic enlargement progression was monitored with serial transabdominal ultrasound measurements. At sacrifice, AAA cellularity and proteolytic activity were evaluated by immunohistochemistry and substrate zymography, respectively. Influences of serum glucose levels on macrophage migration were examined in separate models of thioglycollate-induced murine peritonitis.
Results
At 14 days after PPE infusion, AAA enlargement in hyperglycemic mice (serum glucose ≥ 300 mg/dL) was less than that in euglycemic mice (PPE-DM: 54% ± 19% vs PPE: 84% ± 24%, P < .0001). PPE-DM mice also demonstrated reduced aortic mural macrophage infiltration (145 ± 87 vs 253 ±119 cells/cross-sectional area, P = .0325), elastolysis (% residual elastin: 20% ± 7% vs 12% ± 6%, P = .0209), and neovascularization (12 ± 8 vs 20 ± 6 vessels/high powered field, P = .0229) compared with PPE mice. Hyperglycemia limited AAA enlargement after ANG infusion in ApoE−/− mice (ANG-DM: 38% ± 12% vs ANG: 61% ± 37% at day 28). Peritoneal macrophage production was reduced in response to thioglycollate stimulation in hyperglycemic mice, with limited augmentation noted in response to vascular endothelial growth factor administration. Insulin therapy reduced serum glucose levels and was associated with AAA enlargement rates intermediate between euglycemic and hyperglycemic mice (PPE: 1.21 ± 0.14 mm vs PPE-DM: 1.00 ± 0.04 mm vs PPE-DM + insulin: 1.14 ± 0.05 mm).
Conclusions
Hyperglycemia reduces progression of experimental AAA disease; lowering of serum glucose levels with insulin treatment diminishes this protective effect. Identifying mechanisms of hyperglycemic aneurysm inhibition may accelerate development of novel clinical therapies for AAA disease.
Clinical Relevance
This report provides mechanistic insight into prior population-based clinical studies identifying a negative association between diabetes mellitus and abdominal aortic aneurysm (AAA). The inhibitory effects of hyperglycemia on aneurysm development are examined independent of other AAA risk factors. Further investigations into these or related mechanisms may accelerate the development of effective medical strategies to suppress progression of AAA disease.
Diabetes mellitus (DM) is an important contributor to the pathophysiology of many cardiovascular disorders, including abdominal aortic aneurysm (AAA) disease. Unlike other common demographic and environmental cardiovascular risk factors (eg, advanced age, male gender, and cigarette smoking), however, diabetes appears to reduce the risk for and progression of AAA disease.1-7 Many features of DM may influence the pathophysiology of AAA disease; to date, however, the mechanism(s) responsible for the negative association have yet to be investigated in an in vivo experimental system. We superimposed hyperglycemia on experimental aortic aneurysm induction to identify potential mechanisms responsible for diabetic suppression of AAA disease.
Methods
Murine modeling
All proposed modeling experiments were reviewed and approved in advance by the Administrative Panel on Laboratory Animal Care Committee at Stanford University. Animal care and experimental procedures were conducted in compliance with Stanford Laboratory Animal Care Guidelines (http://labanimals.stanford.edu/). Male mice (aged 10 to 12 weeks), either C57BL/6, or apolipoprotein E-deficient (ApoE−/−) on a C57BL/6 background, were used for all experiments (Jackson Laboratories, Bar Harbor, Me). Adequate inhaled isoflurane anesthesia was maintained for all invasive procedures. After survival procedures, mice were recovered in individual cages with unrestricted access to chow and water. All mice were maintained on normal chow diets.
Induction of DM
Hyperglycemia was induced by intraperitoneal (IP) injection of streptozotocin (STZ: 50 mg/kg; Sigma Aldrich, St. Louis, Mo) dissolved in citrate buffer for 5 consecutive days as specified by the Animal Models of Diabetic Complications Consortium protocol (http://www.amdcc.org). STZ induces necrosis and inflammation of the pancreatic islet beta cells; multiple injections of low-dose STZ produce a delayed but progressive increase in serum glucose levels in mice, resulting in insulin-dependent DM.8 Control mice received a citrate buffer injection without STZ. Mice were monitored for at least 3 weeks after STZ injection, and blood glucose levels and body weights were measured weekly. Hyperglycemia was defined by casual blood glucose levels of ≥300 mg/dL before AAA creation and at sacrifice.
Induction of AAA
Experimental AAAs9 were created in hyperglycemic and euglycemic mice by using one-time intra-aortic porcine pancreatic elastase (PPE) infusion in C57BL/6 (14-day model) or by continuous subcutaneous angiotensin II (ANG) infusion in ApoE−/− cohorts (28-day model), as previously described by our laboratory.10-12 In hyperglycemic mice, aneurysm induction began 3 weeks after completion of STZ injections and confirmation of hyperglycemia as defined above.
Two distinct but complementary murine AAA modeling systems were used to ensure, to the greatest extent possible, that experimental results were not model-specific.13 Briefly, in the PPE model, elastase (E-1250, Lot 102K7685; Sigma Aldrich) was infused directly into the aorta (0.03 mL of 15 U/mL of PPE over 5 minutes), producing either hyperglycemic (PPE-DM, n = 22) or normoglycemic AAA (PPE, n = 21) mice. In the ANG model, AAA was created by subcutaneous infusion of angiotensin II (Lot 37K5102; Sigma Aldrich) at 1000 ng/kg/min continuously over 28 days by a Alzet mini-osmotic pump (DURECT Corp, Cupertino, Calif) in ApoE−/− mice, producing either hyperglycemic (ANG-DM, n = 6) or normoglycemic AAA (ANG, n = 8) mice. In summary, four experimental AAA groups were created, distinguished by the method of aneurysm induction (PPE or ANG) and the presence or absence of diabetes (STZ injection or vehicle alone).
Sacrifice was performed by intentional sodium pentothal overdose. The two distinct experimental AAAs used (PPE and ANG) in this study have different model-specific end points; therefore, sacrifice was performed respectively at that time.9 PPE-DM and PPE mice were euthanized at post-PPE infusion day (POD) 14; select aortae were harvested for histologic analysis (n = 10 and 9, respectively) and substrate zymography (n = 12 in both groups). ANG-DM and ANG mice were euthanized at post-pump placement day (POD) 28 for histologic analysis only (n = 6 and n = 8, respectively). Before the study group-specific end point, mice losing weight rapidly or appearing lethargic or immobile were euthanized immediately, regardless of experimental progress or group assignment.
Exogenous insulin administration
To evaluate the consequences of reducing serum glucose levels, insulin therapy was instituted in a separate cohort of PPE-DM mice. Subcutaneous insulin pellets (LinShin, Toronto, Ontario, Canada) were implanted in each mouse before AAA induction according to manufacturer's protocol, releasing 0.1 U insulin/d (PPE-DM + Insulin, n = 6), to examine the influence of reduced glucose levels on aneurysm progression. After implantation, blood glucose levels were monitored weekly and compared with those in PPE (n = 6) and PPE-DM (n = 6) mice. A significant response to insulin was confirmed when serial blood glucose levels consistently measured below 200 mg/dL. All mice of this cohort were sacrificed at POD 14 for histologic analysis.
Serial in vivo aortic diameter measurement
Aortic diameter was measured in all mice by transabdominal ultrasound imaging at 40 MHz (Vevo770; Visualsonics, Toronto, Ontario, Canada), by examiners blinded to study group assignment at baseline and after AAA induction, on PODs 7 and 14 (all models) and PODs 21 and 28 for ANG only. Percent change in AAA growth rate was calculated as [100 × (current aortic diameter – baseline aortic diameter/baseline aortic diameter]. The sensitivity, accuracy, and reproducibility of similar murine AAA high-frequency ultrasound measurement protocols has been demonstrated previously.12,14,15
Thioglycollate-induced peritonitis
Intra-aortic infusion of thioglycollate induces mural inflammation and aneurysmal degradation when administrated with plasmin16; mechanisms responsible for thioglycollate-induced macrophage stimulation are likely similar to those initiated by porcine pancreatic elastase.17 We used IP thioglycollate injection (1 mL of 4% solution, Becton Dickinson, Sparks, Md)17 to induce chemical peritonitis in hyperglycemic and normoglycemic C57BL/6 mice to evaluate the effect of hyperglycemia and vascular endothelial growth factor (VEGF) on macrophage migration. Since VEGF signaling plays an integral role in aneurysm pathogenesis,12 and VEGF may promote macrophage chemotaxis and activation18,19 in addition to stimulating neovessel production, exogenous VEGF was administered to determine its influence on macrophage production in the setting of hyperglycemia. Selected mice from each group (thioglycollate with or without hyperglycemia) were simultaneously treated with recombinant mouse VEGF (VEGF164; R&D Systems, Minneapolis, Minn) every other day to evaluate hyperglycemic influences on macrophage chemotaxis in response to VEGF stimulation.
Four days after thioglycollate injection, peritoneal lavage was performed with phosphate-buffered saline (PBS), and 2.5 mL of lavage solution was collected and centrifuged to remove erythrocytes. After resuspension in 1 mL of PBS, cells were counted using a Fuchs-Rosenthal Chamber (Hausser Scientific, Horsham, Pa).
Histopathology and immunohistochemistry
At sacrifice, aortae were harvested for histologic analysis after left ventricular injection of 4% paraformaldehyde (PFA) solution in PBS. Further fixation was achieved by overnight immersion in 4% PFA at 4°C. After paraffin embedding, blocks were sectioned at 4 μm for Elastica-Masson (EM) and immunohistochemical (IHC) staining. Primary antibodies for IHC staining were either rat antimouse MAC-2 for macrophages (Cedarlane Laboratories, Burlington, Ontario, Canada) or rabbit antimouse CD31 for endothelial cells (Lab Vision, Fremont, Calif).
After primary incubation, sections were incubated with a biotinylated secondary antibody (Biocare Medical, Concord, Calif) and avidin-biotin complex (Vectastain ABC kits; Vector Laboratories, Burlingame, Calif) according to the manufacturers' protocols. Color development was performed using the DAB color development system (Dako Corporation, Carpinteria, Calif). Tissue sections were counterstained with hematoxylin. Negative control experiments were performed by replacing the primary antibody with nonspecific immunoglobulin G.
Medial elastin density was defined by the ratio of elastin/total medial-area.20,21 For mural neovascularization, cross-sections were divided into four quadrants (original magnification ×400), and CD31-positive stained neovessels, rather than individual cells, in each quadrant were counted. Mean numbers of neovessels per high-powered field (HPF) with standard deviations are reported. To quantify macrophage number, MAC-2-positive stained individual cells were counted (original magnification ×200) per cross-sectional area (CSA).
Gelatin zymography
Snap-frozen AAA samples were pooled in each cohort for gelatin zymography. After extraction from harvested aortae, total protein concentration was determined using the BCA protein assay kit (Pierce-Thermo Scientific, Rockford, Ill). A uniform amount of protein was applied to the 10% gelatin zymogram gel (Bio-Rad, Hercules, Calif), and electrophoresis was performed according to the manufacturer's protocol. Densitometric analysis of lytic bands indicative of MMP activity was performed with National Institutes of Health Image-J software.
Statistical analysis
Data are represented as mean ± standard deviation (SD). Determination of significance between two groups of continuous variables was performed using the _t_-test; adjustments for multiple comparisons were performed using one-way analysis of variance (ANOVA), followed by the Scheffe post hoc test. Significance was determined at the level of P < .05. All calculations were performed using StatView J 5.0 software (SAS Institute Inc, Cary, NC).
Results
STZ injection increases serum glucose levels, reduces body weight
Murine blood glucose levels and body weights were monitored weekly after STZ injection. Serum glucose concentration increased significantly within 2 weeks of the initial injection (370 ± 67 mg/dL STZ-treated vs 152 ± 29 mg/dL vehicle, P < .0001) and persisted until sacrifice (459 ±53 vs 148 ± 22 mg/dL, P < .0001). Body weight was lower in hyperglycemic compared with glycemic mice (23.6 ± 2.4 vs 26.7 ± 2.4 g, P < .0001) immediately before AAA induction.
Hyperglycemia reduces experimental AAA diameter
Although mean aortic diameters increased in both PPE-DM and PPE groups after elastase infusion, absolute growth was significantly less in PPE-DM mice (POD 7: 40% ± 15% vs 54% ± 15%, _P_= .0091; POD 14: 54% ± 19% vs 84% ± 24%, P < .0001). By POD 7, PPE-DM aneurysms were significantly smaller than PPE (P = .0016); this difference became more pronounced by POD 14 (P < .0001, Fig 1, A). AAA growth and diameter were also significantly reduced by hyperglycemia in the angiotensin II/ApoE −/− model (growth through POD 21: ANG-DM 29% ± 12% vs ANG 58% ± 30%, P = .0474; growth through POD 28: 38% ± 12% vs 61% ± 37%, P = .1705; and diameter at POD 14, P = .0474, and POD 21, P= .0472; Fig 1, B).
Fig 1.
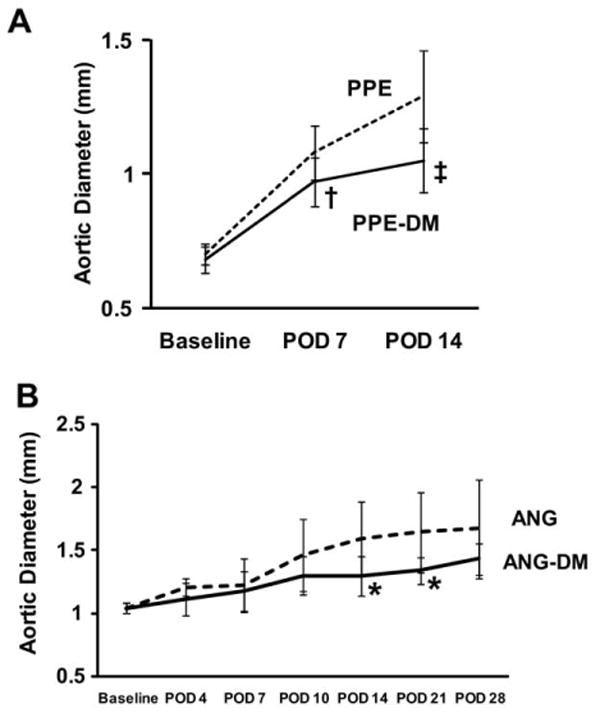
Aortic diameters in (A) PPE vs PPE-DM mice (†P = .0016, POD 7; ‡ P < .0001, POD 14) and (B) ANG vs ANG-DM mice (*_P_= .0474, POD 14; *_P_= .0472, POD 21). The range bars show the standard deviation. ANG, angiotensin II; DM, diabetes mellitus; POD, postoperative day; PPE, porcine pancreatic elastase.
Hyperglycemia attenuates AAA mural neovascularity and macrophage infiltration
Mural neovascularity was significantly reduced in PPE-DM compared with PPE mice (12 ± 8 vs 20 ± 6 vessels/HPF, P = .0229, Figs 2, A, B, C). In both the PPE-DM and PPE groups, mural neovessel density was positively correlated with aneurysm diameter (Fig 2, D). MAC-2 immunostaining demonstrated reduced medial macrophage infiltration in PPE-DM mice (145 ± 87 vs 253 ± 119 cells/cross-sectional area, _P_= .0325; Fig 3, A, B, C). Medial macrophage density was also positively correlated with aortic diameter and neovascularity in both groups (Fig 3, D, E).
Fig 2.
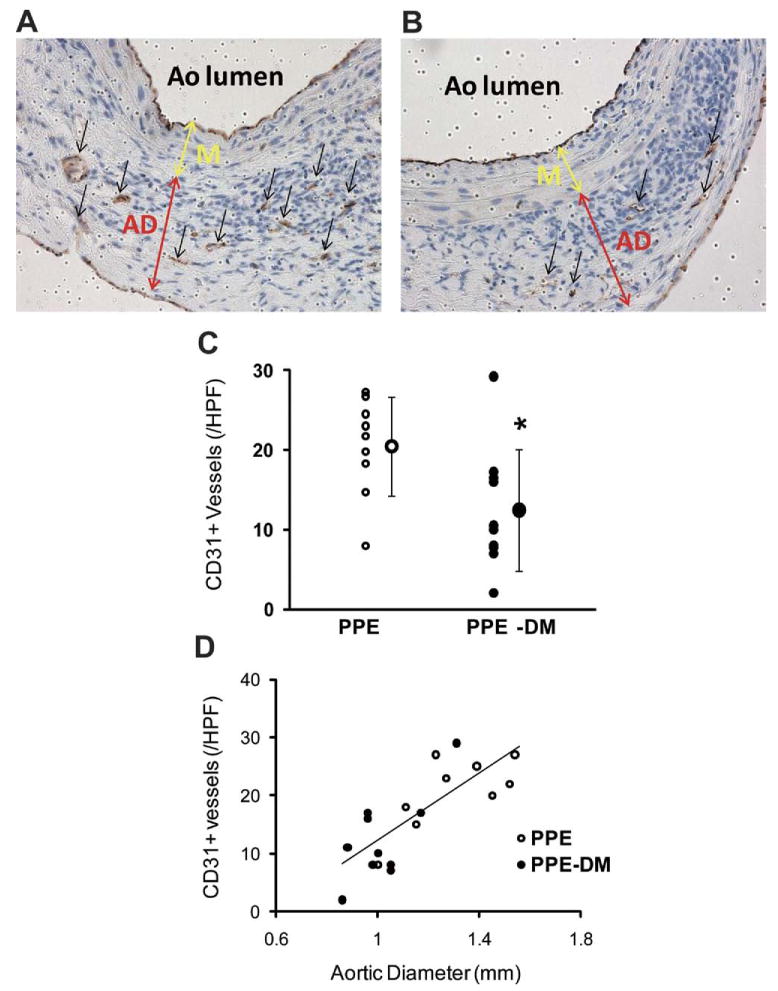
Representative images of CD31 staining in (A) PPE and (B) PPE-DM (original magnification ×400). AD, adventitia; Ao, aorta; M, media. C, Number of medial and adventitial CD31+ vessels (A and B, black arrows) per high power field (HPF). The range bars show the standard deviation. *P < .0229 vs PPE; small circles represent individual data points, large circle represents mean of cohort. D, Correlation between neovessel density and aortic diameter, γ = 29.68_X_ – 17.86; correlation coefficient, R = 0.794; P < .0001; PPE (n = 9), PPE-DM (n = 10). DM, Diabetes mellitus; PPE, porcine pancreatic elastase.
Fig 3.
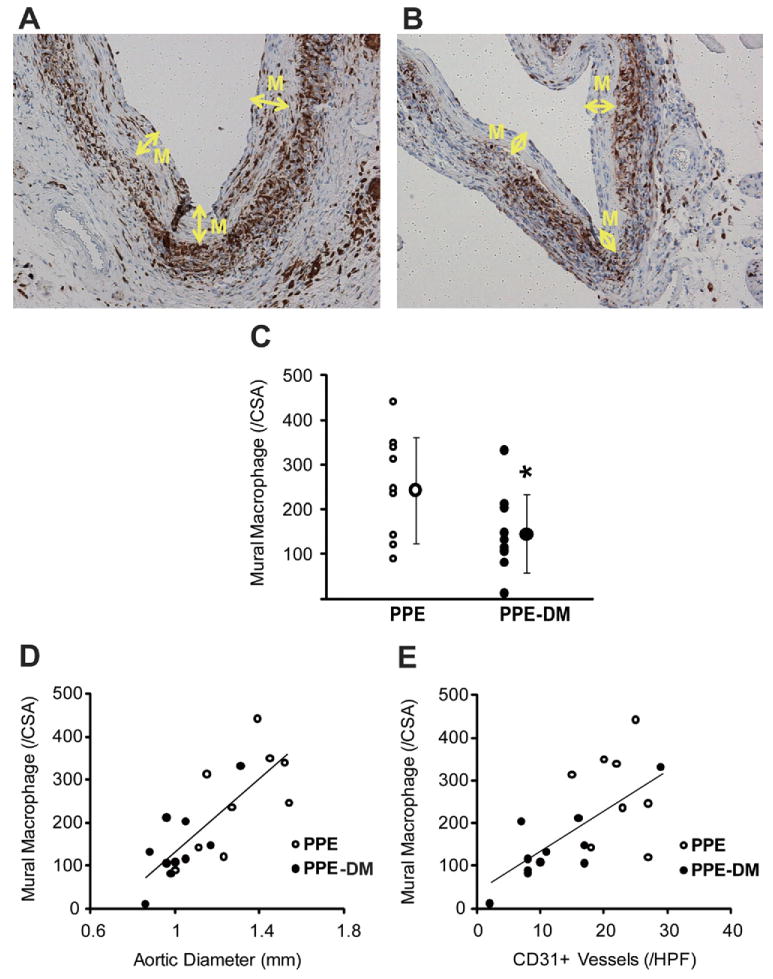
Representative images of MAC-2 staining in (A) PPE and (B) PPE-DM (original magnification ×200). M, Media. C, Number of mural MAC-2+ cells per cross-section are shown. The range bars show the standard deviation. *P = .0325 vs PPE. D, Correlation between macrophage density and aortic diameter, γ = 418.04_X_ – 284.35; correlation coefficient, R = 0 .777, P< .0001. E, Correlation between macrophage and neovessel density, γ = 9.53_X_ + 41.51; correlation coefficient R = .662; P< .01. Data for D and E are from PPE (n = 9) and PPE-DM (n = 10) mice. DM, Diabetes mellitus; PPE, porcine pancreatic elastase.
Hyperglycemia attenuates AAA MMP-9 activity, preserves medial elastin
Pro-MMP-9 activity was significantly reduced in PPE-DM compared with PPE mice (relative density: 0.63 ± 0.31 vs 1.00 ± 0.13, P = .0259, Figs 4, A and B). No significant differences in pro- or active MMP-2 activity were noted (Fig 4, C and D). EM staining revealed relative aortic medial elastin preservation in PPE-DM mice (Fig 4, E and F), quantified by an increased elastin/total medial-area ratio vs that present in PPE mice (20% ± 7% vs 12% ± 6%, P = .0209; Fig 4, G). Similar evidence of elastin preservation was present in ANG-DM vs ANG mice (data not shown).
Fig 4.
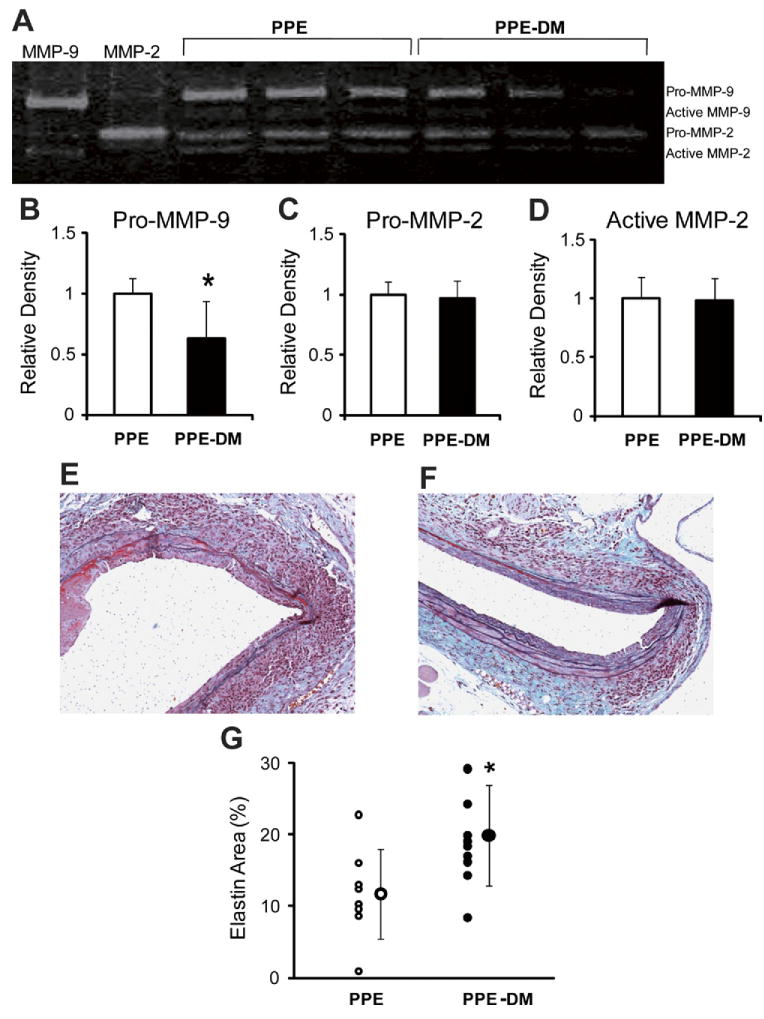
A representative image of (A) zymographic and densitometric analysis of (B) pro-MMP-9, (C) pro-MMP-2, and (D) active MMP-2. *P = .0259 vs PPE. Representative images of Elastica-Masson-stained aortic cross-sections in (E) PPE (F) and PPE-DM (original magnification ×200), and (G) the ratio of stained-elastin-area to media-area. *P = .0209 vs PPE. DM, Diabetes mellitus; MMP, matrix metalloproteinase; PPE, porcine pancreatic elastase. The range bars show the standard deviation.
Insulin therapy increases AAA diameter
Serum glucose levels declined from 465 ± 26 mg/dL preinsulin to 120 ± 69 mg/dL 2 weeks after insulin treatment (P < .0001). Despite lower serum glucose levels, body weight did not change significantly between institution of insulin therapy and sacrifice. AAA diameter in all three groups (PPE, n = 6; PPE-DM, n = 6; PPE-DM + insulin, n = 6) was inversely related to serum glucose levels in a dose-response fashion (Fig 5), with larger aneurysm enlargement in PPE-DM + insulin compared with PPE-DM mice (POD 14: 1.14 ± 0.05 vs 1.00 ± 0.04 mm, respectively; P = .0002). PPE-DM mice demonstrated reduced aortic mural neovascularization, macrophage infiltration, and elastolysis compared with the other two groups (Table).
Fig 5.
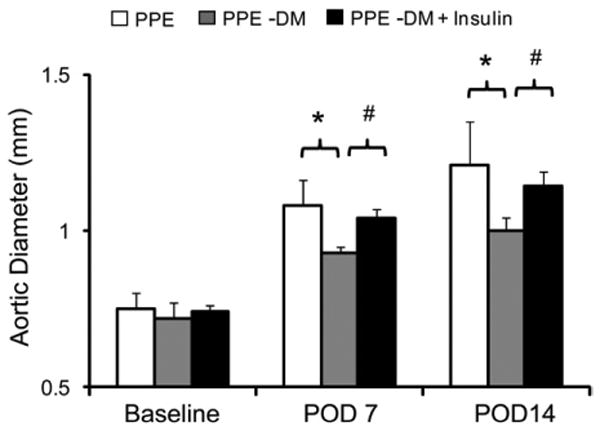
Comparison of aortic diameter at baseline and after porcine pancreatic elastase (PPE) infusion in PPE (n = 6; white bar), PPE-DM (n = 6; grey bar) and PPE-DM + insulin (n = 6; black bar) mice (POD 7 *P = .0014, #P< .0001; POD 14 *_P_= .0036, #P = .0002). The range bars show the standard deviation. DM, Diabetes mellitus; POD, postoperative day.
Table. Cellular and elastin density as a function of diabetes status and insulin therapy in the porcine pancreatic elastase (PPE) abdominal aortic aneurysm model.
| Group | CD31 + neovessels (per HPF) | Mural macrophages (per CSA) | Elastin preservation ratio (%) |
|---|---|---|---|
| PPE | 18.4 ± 2.9 | 268 ± 59 | 14.1 ± 4.7 |
| PPE-DM | 11.9 ± 1.7 | 172 ± 14 | 23.1 ± 1.6 |
| PPE-DM + insulin | 18.4 ± 3.9 | 263 ± 87 | 15.6 ± 8.6 |
VEGF does not augment macrophage production in hyperglycemic mice
Significantly fewer macrophages were present in dialysate obtained from hyperglycemic mice (n = 9) after IP thioglycollate (1.4 ± 0.3 vs 2.2 ± 0.3 × 10⁷ cells/mL in euglycemic mice; n = 9; P< .0001; Fig 6). VEGF164 administration augmented recovery of thiogly-collate-induced peritoneal macrophages in euglycemic mice (P = .0171) but did not alter dialysate macrophage density in DM mice (Fig 6).
Fig 6.
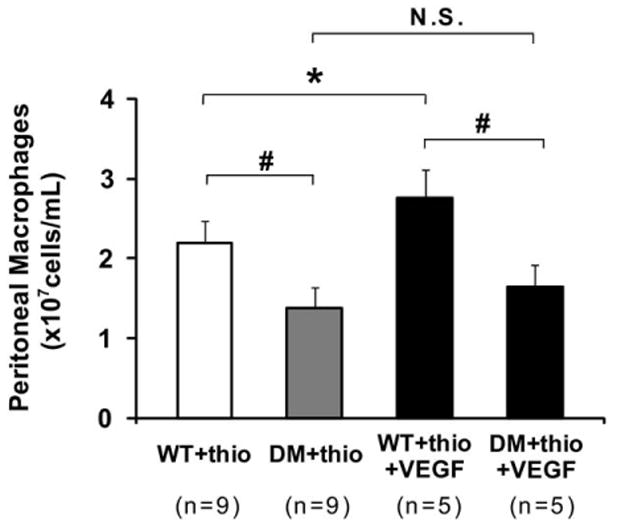
Comparison of peritoneal macrophages in lavage solution from diabetes mellitus (DM) mice and control mice with thioglycollate-induced peritonitis. *P = .0171, #P < .0001. The range bars show the standard deviation. NS, No significance; thio, thioglycollate; VEGF, vascular endothelial growth factor; WT, wild type.
Discussion
Hyperglycemia impairs aneurysm progression in two complementary, but mechanistically distinct, murine models of AAA disease. To our knowledge, these are the first experiments to identify candidate mechanisms of hyperglycemic AAA suppression in vivo. Reduced AAA diameter in hyperglycemic mice is accompanied by reduced aortic mural neovascularization, macrophage infiltration, and medial elastolysis. Insulin-mediated reductions in serum glucose levels partially negate the protective effects of hyperglycemia on aneurysm progression.
Many metabolic consequences of diabetes increase risk for adverse cardiovascular events.22,23 In the particular case of AAA disease, however, several of these consequences may paradoxically serve to limit proteolysis and aneurysm expansion. Aortic mural neovascularity plays a prominent role in aneurysm pathogenesis,24,25 and hyperglycemia reduces neoangiogenesis in wound healing26,27 and aortic tissue.28 In murine models of wound healing, hyperglycemia inhibits neovessel formation by interfering with hypoxia-inducible factor 1 (HIF-1) and HIF-related activation of the nuclear hypoxia response element (HRE), down-regulating activation of VEGF expression and the angiogenic response.26 Although circulating VEGF levels are frequently increased in diabetic individuals and mice,29 and diabetes promotes neovascularization in proliferative retinopathy,30 VEGF levels in select target organs may be depressed by diabetes secondary to impaired HIF signaling.27
VEGF-induced macrophage recruitment is a critical feature of the angiogenic response, and macrophages themselves produce VEGF as well as MMP-9.18,31 As was apparent from the results of our chemical peritonitis experiments, and consistent with prior observation,32,33 hyperglycemia impairs monocyte/macrophage production in response to exogenous VEGF administration. These results, combined with evidence that angiogenesis inhibitors attenuate experimental AAA progression,12 suggest that aortic neovessel formation and macrophage infiltration are interdependent and essential stimuli for aneurysm progression, and that both appear to be significantly inhibited in the setting of hyperglycemia.
MMP activity is essential to the progression of AAA disease.34-36 In this study, reduced aortic mural macrophage density was associated with diminished MMP-9 activity and relative elastin preservation. In addition to limiting macrophage infiltration, hyperglycemia may inhibit MMP production by activated monocytes. Glycation may modify monocyte/extracellular matrix interactions by collagen crosslinking; exposure to glutaraldehyde and high glucose concentrations produces similar reductions in MMP and interleukin-6 expression from activated monocytes in collage lattices.37 Because MMP activity is essential for endothelial cell migration and neovascularization, as well as mural macrophage infiltration,17 these candidate mechanisms may act synergistically to reduce aortic aneurysm inflammation and disease progression in diabetes.
Although effective in increasing serum glucose levels, streptozotocin-induced hyperglycemia is more analogous to type 1 (insulin-deficient) than type 2 (insulin-resistant) diabetes. Consistent with their age and risk factor status, most AAA patients have insulin-resistant diabetes as a feature of the metabolic syndrome, which may, in its aggregate effects, promote cardiovascular inflammation and AAA progression. Streptozotocin exposure also induces significant weight loss and thus may reduce systemic inflammatory responses through immune suppression (anergy). To control for these limitations, future experiments are planned to use alternative methods and models, including aneurysm induction in the db/db leptin receptor-deficient mouse38 to characterize the influence of insulin resistance on AAA disease progression. Homozygous db/db mice with genetic mutation of the leptin receptor develop hyper-glycemia associated with obesity and hyperinsulinemia, more closely approximating type 2 diabetes.
Beyond influences on mural neovascularization and macrophage infiltration and activation, additional mechanisms of diabetic AAA suppression almost certainly exist. On the basis of current evidence, alternative or complimentary mechanisms include hyperglycemic influences on the fibrinolytic system,39 receptors of advanced glycation end-products,40 and progenitor cell function.26 Examination of patterns of gene expression throughout the time course of experimental AAA progression, particularly by application of transcriptome-wide message and protein profiling techniques, will provide additional insights into alternative mechanisms of aneurysm suppression in the setting of hyperglycemia.
Conclusions
Hyperglycemia in experimental aneurysm models is associated with attenuated mural neovascularization, macrophage infiltration, and medial elastolysis, all essential features of human AAA disease. Understanding of inhibitory mechanisms associated with hyperglycemia may translate into effective new therapeutic strategies to reduce the morbidity and mortality associated with AAA disease.
Acknowledgments
This work was supported by National Institutes of Health (NIH) grants 2 RO-1 HL064338-08, 1 P50 HL083800-03, and T32-HL007708-15 (USA) and by a Research Fellowship from the Uehara Memorial Foundation (Japan).
Footnotes
Competition of interest: none.
Presented at the Twenty-fourth Annual Meeting of the Western Vascular Society, Tucson, Ariz, September 19-22, 2009.
The editors and reviewers of this article have no relevant financial relationships to disclose per the JVS policy that requires reviewers to decline review of any manuscript for which they may have a competition of interest.
Author Contributions
Conception and design: NM, MD, RD
Analysis and interpretation: NM, MD, TA, RD
Data collection: NM, MD, JY, GS, TA, ES, MS
Writing the article: NM, MD, RD
Critical revision of the article: NM, MD, JY, GS, RD
Final approval of the article: NM, MD, RD
Statistical analysis: NM, MD
Obtained funding: NM, RD
Overall responsibility: RD
References
- 1.Lederle FA, Johnson GR, Wilson SE, Chute EP, Bandyk D, Krupski WC, et al. Prevalence and associations of abdominal aortic aneurysm detected through screening. Ann Intern Med. 1997;126:441–9. doi: 10.7326/0003-4819-126-6-199703150-00004. [DOI] [PubMed] [Google Scholar]
- 2.Lederle FA, Johnson GR, Wilson SE, Chute EP, Hye RJ, Makaroun MS, et al. The aneurysm detection and management study screening program: validation cohort and final results. Aneurysm Detection and Management Veterans Affairs Cooperative Study Investigators. Arch Intern Med. 2000;160:1425–30. doi: 10.1001/archinte.160.10.1425. [DOI] [PubMed] [Google Scholar]
- 3.Brady AR, Fowkes FGR, Greenhalgh RM, Powell JT, Ruckley CV, Thompson SG. Risk factors for postoperative death following elective surgical repair of abdominal aortic aneurysm: results from the UK Small Aneurysm Trial. Br J Surg. 2000;87:742–9. doi: 10.1046/j.1365-2168.2000.01410.x. [DOI] [PubMed] [Google Scholar]
- 4.Norman PE, Jamrozik K, Lawrence-Brown MM, Le MTQ, Spencer CA, Tuohy RJ, et al. Population based randomised controlled trial on impact of screening on mortality from abdominal aortic aneurysm. BMJ. 2004;329:1259. doi: 10.1136/bmj.38272.478438.55. [DOI] [PMC free article] [PubMed] [Google Scholar]
- 5.Le MT, Jamrozik K, Davis TM, Norman PE. Negative association between infra-renal aortic diameter and glycaemia: The Health In Men Study. Eur J Vasc Endovasc Surg. 2007;33:599–604. doi: 10.1016/j.ejvs.2006.12.017. [DOI] [PubMed] [Google Scholar]
- 6.Mattes E, Davis TM, Yang D, Ridley D, Lund H, Norman PE. Prevalence of abdominal aortic aneurysms in men with diabetes. Med J Aust. 1997;166:630–3. doi: 10.5694/j.1326-5377.1997.tb123296.x. [DOI] [PubMed] [Google Scholar]
- 7.Brady AR, Thompson SG, Fowkes FGR, Greenhalgh RM, Powell JT. on behalf of the UKSATP. Abdominal aortic aneurysm expansion: risk factors and time intervals for surveillance. Circulation. 2004;110:16–21. doi: 10.1161/01.CIR.0000133279.07468.9F. [DOI] [PubMed] [Google Scholar]
- 8.Wu KK, Huan Y. Diabetic atherosclerosis mouse models. Atherosclerosis. 2007;191:241–9. doi: 10.1016/j.atherosclerosis.2006.08.030. [DOI] [PubMed] [Google Scholar]
- 9.Daugherty A, Cassis LA. Mouse models of abdominal aortic aneurysms. Arterioscler Thromb Vasc Biol. 2004;24:429–34. doi: 10.1161/01.ATV.0000118013.72016.ea. [DOI] [PubMed] [Google Scholar]
- 10.Azuma J, Asagami T, Dalman R, Tsao P. Creation of murine experimental abdominal aortic aneurysms with elastase. J Vis Exp. 2009;29 doi: 10.3791/1280. [DOI] [PMC free article] [PubMed] [Google Scholar]
- 11.Sho E, Sho M, Nanjo H, Kawamura K, Masuda H, Dalman RL. Hemodynamic regulation of CD34+ cell localization and differentiation in experimental aneurysms. Arterioscler Thromb Vasc Biol. 2004;24:1916–21. doi: 10.1161/01.ATV.0000142805.20398.74. [DOI] [PubMed] [Google Scholar]
- 12.Tedesco MM, Terashima M, Blankenberg FG, Levashova Z, Spin JM, Backer MV, et al. Analysis of in situ and ex vivo vascular endothelial growth factor receptor expression during experimental aortic aneurysm progression. Arterioscler Thromb Vasc Biol. 2009;29:1452–7. doi: 10.1161/ATVBAHA.109.187757. [DOI] [PMC free article] [PubMed] [Google Scholar]
- 13.Yoshimura K, Aoki H, Ikeda Y, Fujii K, Akiyama N, Furutani A, et al. Regression of abdominal aortic aneurysm by inhibition of c-Jun N-terminal kinase. Nat Med. 2005;11:1330–8. doi: 10.1038/nm1335. [DOI] [PubMed] [Google Scholar]
- 14.Martin-McNulty B, Vincelette J, Vergona R, Sullivan ME, Wang YX. Noninvasive measurement of abdominal aortic aneurysms in intact mice by a high-frequency ultrasound imaging system. Ultrasound Med Biol. 2005;31:745–9. doi: 10.1016/j.ultrasmedbio.2005.02.012. [DOI] [PubMed] [Google Scholar]
- 15.Barisione C, Charnigo R, Howatt D, Moorleghen J, Rateri D, Daugherty A. Rapid dilation of the abdominal aorta during infusion of angiotensin II detected by noninvasive high-frequency ultrasonography. J Vasc Surgery. 2006;44:372–6. doi: 10.1016/j.jvs.2006.04.047. [DOI] [PubMed] [Google Scholar]
- 16.Anidjar S, Salzmann JL, Gentric D, Lagneau P, Camilleri JP, Michel JB. Elastase-induced experimental aneurysms in rats. Circulation. 1990;82:973–81. doi: 10.1161/01.cir.82.3.973. [DOI] [PubMed] [Google Scholar]
- 17.Gong Y, Hart E, Shchurin A, Hoover-Plow J. Inflammatory macrophage migration requires MMP-9 activation by plasminogen in mice. J Clin Invest. 2008;118:3012–24. doi: 10.1172/JCI32750. [DOI] [PMC free article] [PubMed] [Google Scholar]
- 18.Cursiefen C, Chen L, Borges L, Jackson D, Cao J, Radziejewski C, et al. VEGF-A stimulates lymphangiogenesis and hemangiogenesis in inflammatory neovascularization via macrophage recruitment. J Clin Invest. 2004;113:1040–50. doi: 10.1172/JCI20465. [DOI] [PMC free article] [PubMed] [Google Scholar]
- 19.Moulton K, Vakili K, Zurakowski D, Soliman M, Butterfield C, Sylvin E, et al. Inhibition of plaque neovascularization reduces macrophage accumulation and progression of advanced atherosclerosis. Proc Natl Acad Sci USA. 2003;100:4736–41. doi: 10.1073/pnas.0730843100. [DOI] [PMC free article] [PubMed] [Google Scholar]
- 20.Shiraya S, Miyake T, Aoki M, Yoshikazu F, Ohgi S, Nishimura M, et al. Inhibition of development of experimental aortic abdominal aneurysm in rat model by atorvastatin through inhibition of macrophage migration. Atherosclerosis. 2009;202:34–40. doi: 10.1016/j.atherosclerosis.2008.03.020. [DOI] [PubMed] [Google Scholar]
- 21.Tsuruda T, Kato J, Hatakeyama K, Kojima K, Yano M, Yano Y, et al. Adventitial mast cells contribute to pathogenesis in the progression of abdominal aortic aneurysm. Circ Res. 2008;102:1368–77. doi: 10.1161/CIRCRESAHA.108.173682. [DOI] [PubMed] [Google Scholar]
- 22.Creager MA, Luscher TF, Cosentino F, Beckman JA. Diabetes and vascular disease: pathophysiology, clinical consequences, and medical therapy: Part I. Circulation. 2003;108:1527–32. doi: 10.1161/01.CIR.0000091257.27563.32. [DOI] [PubMed] [Google Scholar]
- 23.Ceriello A, Motz E. Is oxidative stress the pathogenic mechanism underlying insulin resistance, diabetes, and cardiovascular disease? The common soil hypothesis revisited. Arterioscler Thromb Vasc Biol. 2004;24:816–23. doi: 10.1161/01.ATV.0000122852.22604.78. [DOI] [PubMed] [Google Scholar]
- 24.Choke E, Thompson MM, Dawson J, Wilson WRW, Sayed S, Loftus IM, et al. Abdominal aortic aneurysm rupture is associated with increased medial neovascularization and overexpression of proangiogenic cytokines. Arterioscler Thromb Vasc Biol. 2006;26:2077–82. doi: 10.1161/01.ATV.0000234944.22509.f9. [DOI] [PubMed] [Google Scholar]
- 25.Holmes DR, Liao S, Parks WC, Thompson RW. Medial neovascularization in abdominal aortic aneurysms: a histopathologic marker of aneurysmal degeneration with pathophysiologic implications. J Vasc Surg. 1995;21:761–71. doi: 10.1016/s0741-5214(05)80007-2. [DOI] [PubMed] [Google Scholar]
- 26.Ceradini D, Yao D, Grogan R, Callaghan M, Edelstein D, Brownlee M, et al. Decreasing intracellular superoxide corrects defective ischemia-induced new vessel formation in diabetic mice. J Biol Chem. 2008;283:10930–8. doi: 10.1074/jbc.M707451200. [DOI] [PMC free article] [PubMed] [Google Scholar]
- 27.Thangarajah H, Yao D, Chang E, Shi Y, Jazayeri L, Vial I, et al. The molecular basis for impaired hypoxia-induced VEGF expression in diabetic tissues. Proc Natl Natl Acad Sci USA. 2009;106:13505–10. doi: 10.1073/pnas.0906670106. [DOI] [PMC free article] [PubMed] [Google Scholar]
- 28.Onuta G, Westerweel P, Zandvoort A, van Riezen M, Rozing J, Hillebrands JL, et al. Angiogenic sprouting from the aortic vascular wall is impaired in the BB rat model of autoimmune diabetes. Microvasc Res. 2008;75:420–5. doi: 10.1016/j.mvr.2007.11.006. [DOI] [PubMed] [Google Scholar]
- 29.Cha DR, Kang YS, Han SY, Jee YH, Han KH, Han JY, et al. Vascular endothelial growth factor is increased during early stage of diabetic nephropathy in type II diabetic rats. J Endocrinol. 2004;183:183–94. doi: 10.1677/joe.1.05647. [DOI] [PubMed] [Google Scholar]
- 30.Miyamoto K, Khosrof S, Bursell SE, Moromizato Y, Aiello LP, Ogura Y, et al. Vascular endothelial growth factor (VEGF)-induced retinal vascular permeability is mediated by intercellular adhesion molecule-1 (ICAM-1) Am J Pathol. 2000;156:733–9. doi: 10.1016/S0002-9440(10)65044-4. [DOI] [PMC free article] [PubMed] [Google Scholar]
- 31.Carmi Y, Voronov E, Dotan S, Lahat N, Rahat MA, Fogel M, et al. The role of macrophage-derived IL-1 in induction and maintenance of angiogenesis. J Immunol. 2009;183:4705–14. doi: 10.4049/jimmunol.0901511. [DOI] [PubMed] [Google Scholar]
- 32.Waltenberger J, Lange J, Kranz A. Vascular endothelial growth factor-A-induced chemotaxis of monocytes is attenuated in patients with diabetes mellitus: a potential predictor for the individual capacity to develop collaterals. Circulation. 2000;102:185–90. doi: 10.1161/01.cir.102.2.185. [DOI] [PubMed] [Google Scholar]
- 33.Tchaikovski V, Olieslagers S, Bohmer FD, Waltenberger J. Diabetes mellitus activates signal transduction pathways resulting in vascular endothelial growth factor resistance of human monocytes. Circulation. 2009;120:150–9. doi: 10.1161/CIRCULATIONAHA.108.817528. [DOI] [PubMed] [Google Scholar]
- 34.Longo GM, Wanfen X, Greiner TC, Yong Z, Fiotti N, Baxter BT. Matrix metalloproteinases 2 and 9 work in concert to produce aortic aneurysms. J J Clin Invest. 2002;110:625. doi: 10.1172/JCI15334. [DOI] [PMC free article] [PubMed] [Google Scholar]
- 35.Xiong W, Knispel R, MacTaggart J, Greiner T, Weiss S, Baxter BT. Membrane-type 1 matrix metalloproteinase regulates macrophage-dependent elastolytic activity and aneurysm formation in vivo. J Biol Chem. 2009;284:1765–71. doi: 10.1074/jbc.M806239200. [DOI] [PMC free article] [PubMed] [Google Scholar]
- 36.McMillan WD, Tamarina NA, Cipollone M, Johnson DA, Parker MA, Pearce WH. Size matters: the relationship between MMP-9 expression and aortic diameter. Circulation. 1997;96:2228–32. doi: 10.1161/01.cir.96.7.2228. [DOI] [PubMed] [Google Scholar]
- 37.Golledge J, Karan M, Moran CS, Muller J, Clancy P, Dear AE, et al. Reduced expansion rate of abdominal aortic aneurysms in patients with diabetes may be related to aberrant monocyte matrix interactions. Eur Heart J. 2008;29:665–72. doi: 10.1093/eurheartj/ehm557. [DOI] [PubMed] [Google Scholar]
- 38.Maruyama K, Asai J, Ii M, Thorne T, Losordo DW, D'Amore PA. Decreased macrophage number and activation lead to reduced lymphatic vessel formation and contribute to impaired diabetic wound healing. Am J Pathol. 2007;170:1178–91. doi: 10.2353/ajpath.2007.060018. [DOI] [PMC free article] [PubMed] [Google Scholar]
- 39.Festa A, D'Agostino R, Jr, Mykkanen L, Tracy RP, Zaccaro DJ, Hales CN, et al. Relative contribution of insulin and its precursors to fibrin-ogen and PAI-1 in a large population with different states of glucose tolerance: The Insulin Resistance Atherosclerosis Study (IRAS) Arterioscler Thromb Vasc Biol. 1999;19:562–8. doi: 10.1161/01.atv.19.3.562. [DOI] [PubMed] [Google Scholar]
- 40.Zhang F, Kent KC, Yamanouchi D, Zhang Y, Kato K, Tsai S, et al. Anti-receptor for advanced glycation end products therapies as novel treatment for abdominal aortic aneurysm. Ann Surg. 2009;250:416–23. doi: 10.1097/SLA.0b013e3181b41a18. [DOI] [PMC free article] [PubMed] [Google Scholar]