Overcoming bias and systematic errors in next generation sequencing data (original) (raw)
Abstract
Considerable time and effort has been spent in developing analysis and quality assessment methods to allow the use of microarrays in a clinical setting. As is the case for microarrays and other high-throughput technologies, data from new high-throughput sequencing technologies are subject to technological and biological biases and systematic errors that can impact downstream analyses. Only when these issues can be readily identified and reliably adjusted for will clinical applications of these new technologies be feasible. Although much work remains to be done in this area, we describe consistently observed biases that should be taken into account when analyzing high-throughput sequencing data. In this article, we review current knowledge about these biases, discuss their impact on analysis results, and propose solutions.
Background: clinical applications of microarrays
While microarrays were rapidly accepted in research applications, incorporating them in clinical settings has required over a decade of benchmarking, standardization and the development of appropriate analysis methods. Extensive cross-platform and cross-laboratory analyses demonstrated the importance of low-level processing choices [1-3], including data summarization, normalization, and adjustment for laboratory or 'batch' effects [4], on outcome accuracy. Some of this work was done under the auspices of the Food and Drug Administration (FDA), most notably the Microarray Quality Control (MAQC) studies, which were developed specifically in order to determine the utility of microarray technologies in a clinical setting [5,6]. Microarray-measured gene expression signatures now form the basis of several FDA-approved clinical diagnostic tests, including MammaPrint, and Pathwork's Tissue of Origin test [7,8].
With high-throughput sequencing still in its infancy, many questions remain to be addressed before any hope of achieving approval for clinical applications is warranted. Although a study on the scale of the MAQC analyses for microarrays has yet to be carried out for sequencing (although one is in the works), there is already evidence that similar technical biases are present in sequencing data, and these will need to be understood and adjusted for to enable use of these new technologies in a clinical setting. In this commentary, we present some of these known biases and discuss the current state of solutions aimed at addressing them. Looking ahead to the application of this new technology in the clinical setting, we see both hurdles and promise.
Bias and batch effects in high-throughput assays
Biases arise when an observed measurement does not reflect the quantity to be measured due to a systematic distorting effect. For a concrete example from microarrays, non-specific hybridization at microarray probes produces an observed intensity that is not an unbiased measure of the presence of the target sequence in the population being studied. Thorough investigation has revealed that the chemical composition of microarray probes influences this effect, and analysis methods have been developed to alleviate it [9].
Similarly, batch effects, whereby external factors, for example, time or technician, have a systematic influence on experimental outcomes across a condition, have been seen in many high-throughput technologies, and can cause confounding without proper study design and analysis techniques [4,10].
So far, there is evidence that these issues are present in experiments employing high-throughput sequencing data, indicating that similar precautions and methodological developments will be necessary before sequencing data can be used with confidence in the clinic.
Bias in base-call error rates
High-throughput sequencing involves the parallel sequencing of millions of DNA fragments simultaneously. Generally, these fragments are sequenced one base at a time, and, at each step or cycle, the current base is determined through fluorescent detection. For a review, see Holt and Jones [11]. Although sequencing platform chemistries differ, in all cases care must be taken to avoid introducing bias at this early stage.
Focusing on the Illumina Genome Analyzer platform, base-call errors are not randomly distributed across the cycle positions in sequenced reads [12]. Although not as extensively studied, similar biases have been observed and low-level signal correction methods have been developed for other sequencing platforms [13].
Incorrect base calls can have a deleterious impact downstream in aligning reads to the reference genome (resulting in fewer or incorrect alignments) and in variant detection (contributing to false-positive variant calls). In experiments aimed at detecting variants in genomic DNA, concern about false positives may lead researchers to employ stringent filtering criteria. Many researchers are hypothesizing that the discovery of rare variants will be a crucial next step in understanding the genetic causes of complex diseases [14], and overly strict filtering criteria may eliminate exactly the variants of most interest and impact. By improving the quality of nucleotide calls, either through better base calling or error correction, more accurate variant calls will be possible.
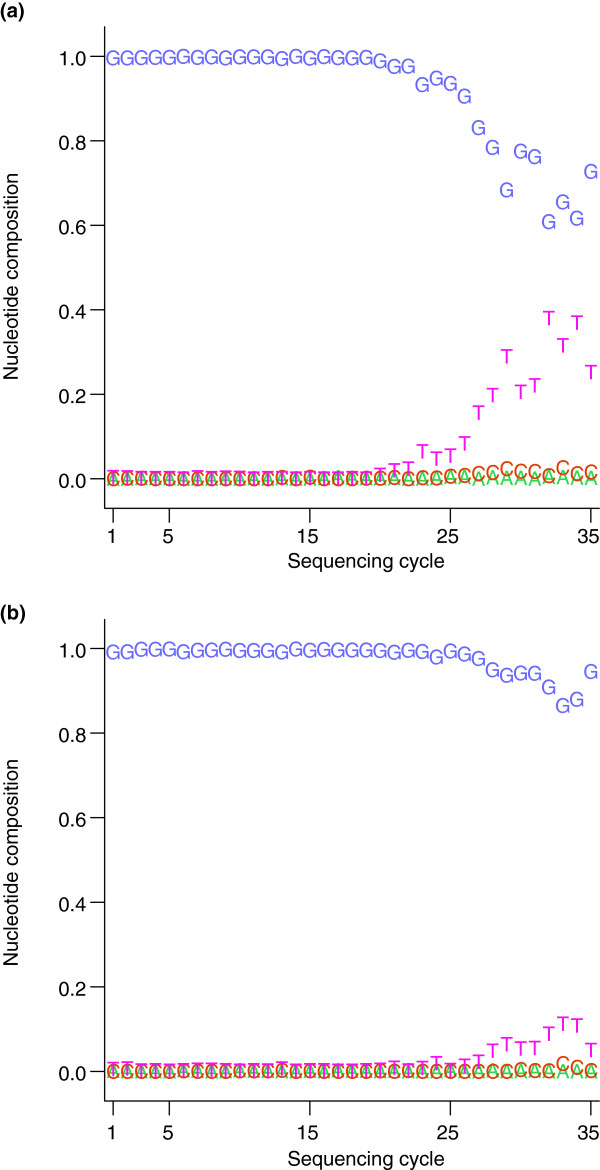
Alternative base-calling methods that reduce the cycle-related bias in error rates have been developed (Figure 1) [15,16]. Numerous error correction methods have also been developed to remove errors from reads after base calls have been made [17-20]. Since base calling requires the raw intensity files, which many laboratories never receive from sequencing centers, re-calling bases is logistically burdensome, and error correction provides a potential alternative.
Figure 1.
Effect of base-calling improvements on error bias. This figure is based on figures from Bravo and Irizarry [15]. Choosing a site that was a false-positive variant as determined by MAQ [28], the authors examined the pattern of nucleotide calls according to the read cycle the different calls occurred at. (a) Results with the default base-calling software; (b) results after application of the base-calling method of Bravo and Irizarry. The _x_-axis shows read cycle and the colored points indicate the percentage of calls at each cycle that were made for a particular nucleotide. In (a), the letter T becomes much more frequent in reads that align to the SNP site only at later sequencing cycles, indicating a technical bias in base calls at this position, while the plot in (b) shows a strong reduction in this bias. In addition, the location is no longer determined as a variant by MAQ after the improved base calling.
Coverage biases
Another long-observed phenomenon of high-throughput sequencing data is the strong, reproducible effect of local sequence content on the coverage of a genomic region by sequencing reads [12]. This phenomenon is analogous to probe effects for microarray platforms. For sequencing projects where coverage levels are compared across regions, such as RNA-Seq, chromosome immunoprecipitation-sequencing (ChIP-Seq) or copy number detection, this phenomenon can be particularly problematic.
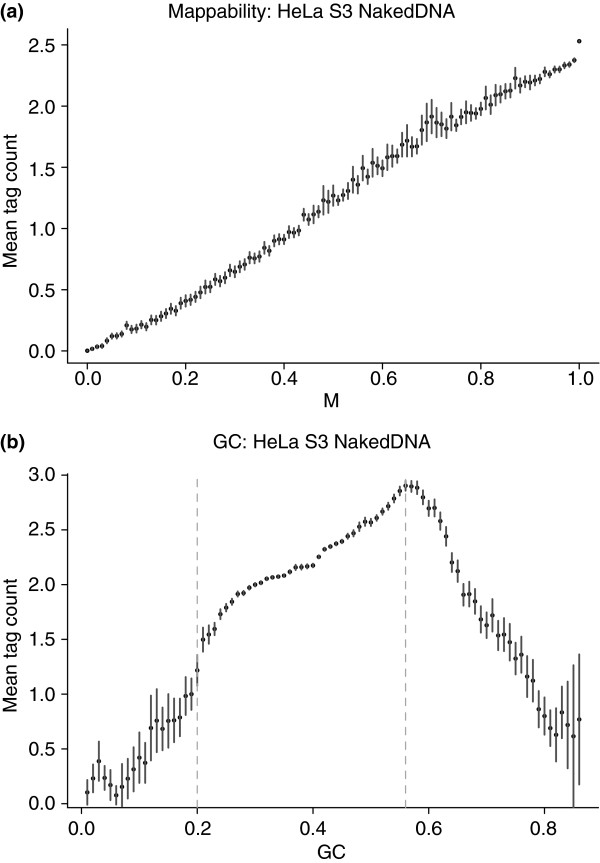
Researchers carrying out ChIP-Seq experiments have observed a systematic relationship between coverage and GC content (Figure 2) [21]. Researchers using sequencing to measure copy number have also found adjusting for GC content improves precision [22]. Adjusting signal for GC content leads to improved results in both ChIP-Seq and copy number estimation with sequencing data [21,22].
Figure 2.
Effect of mappability and GC content on coverage. (a) Mean tag counts in 50-bp bins, with error bars, from a naked DNA sample from a ChIP-Seq experiment, showing that they depend on mappability and GC content. (b) 97.4% of bins have GC percentages between 0.2% and 0.56%, as marked by the vertical dashed lines. This figure is reproduced with permission from Kuan et al. [21].
Genomic regions that are identical or highly similar to one another create ambiguity in alignment to the genome, and ambiguous reads are generally discarded. The low coverage in these regions can produce biased measurements or remove the regions from consideration in downstream analysis, potentially eliminating important signals from the data. Methods have been developed for taking this mappability property into account to adjust the observed signal in these regions [21].
Some spatial biases seem to be unique to the sample preparation protocol being used. Hansen et al. [23] have shown that random hexamer priming can lead to coverage bias in RNA-Seq analyses, and Li et al. [24] present a model for the non-uniformity of RNA-Seq read coverage. Both papers provide solutions to adjust for these biases and achieve more uniform coverage.
Batch effects
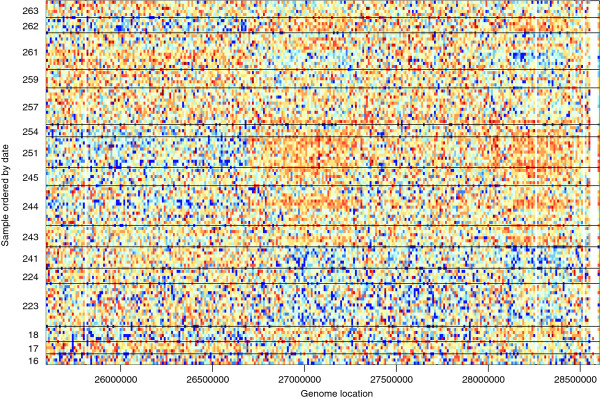
Batch effects arise when variability in the data correlates with a technical variable, such as processing date, location or technician. Such effects have been observed in many different high-throughput experiments. Leek et al. [10] investigated batch effects in genomic DNA sequencing carried out as part of the 1000 Genomes Project [25]. To investigate whether batch effects were present in a subset of this sequencing data, Leek et al. compiled a set of aligned sequencing data sets that were produced in the same location at different dates. After summarization and normalization of the data, clear spatial patterns can be seen in several of the samples, and the patterns are correlated with the technical variable of processing date (Figure 3). Patterns like these could lead to false conclusions in experiments where the sequencing coverage is related to the condition of interest, such as copy-number or peak height.
Figure 3.
Batch effect for second-generation sequencing data from the 1000 Genomes Project. This figure is similar to one from Leek et al. [10]. Each row in the heat-map is data from a different HapMap sample processed in the same facility with the same platform (see Leek et al. [10] for a description of the data), shown for a 3-Mb region on chromosome 16, with data summarized in 10-kb bins. Data from each bin were standardized across samples, with blue representing 3 standard deviations below average, and orange representing 3 standard deviations above average. The rows are ordered by date, with black lines separating different processing days. The largest batch effect can be seen on the alternating pattern of blue and orange on days 223 to 241 and days 244 to 251.
The primary way of avoiding batch effects is through careful experimental design. Randomization of all experimental variables across treatment conditions should be employed to avoid systematic effects within a condition. In order to correct for these batch effects after the fact, they need to first be detected, and then adjusted for, be it through the use of covariates in linear models, or more involved procedures such as surrogate variable analysis [26]. These methods will work best when confounding between the technical variable and the outcome of interest are avoided; thus, careful experimental design is essential.
One challenge of using sequencing technologies in clinical applications is that conclusions are likely to be drawn by comparing newly acquired data with genome profiles derived from previously collected data. Interpreting findings derived from this type of comparison is made difficult by the batch effect. Better understanding of batch-to-batch variation and development of single-sample methods such as fRMA [27] will be important steps forward in addressing this challenge.
Conclusion
Just as is the case for other high-throughput biological assays, high-throughput sequencing presents many challenges when it comes to avoiding bias and batch effects. Promising solutions to these problems are already in development, including: low-level improvements in base calling and error correction, improved per-position data quality metrics, adjustments to coverage estimates to alleviate context-specific or protocol-specific effects, and experimental designs that minimize potential confounding effects of batch. The lessons learned through the development of clinical applications of microarrays, such as the need for benchmark studies such as those conducted by the MAQC project, should help accelerate the process of incorporating high-throughput sequencing into the clinic.
Abbreviations
Bp: base pair; ChIP: chromatin immunoprecipitation; FDA: Food and Drug Administration; MAQC: Microarray Quality Control.
Competing interests
The authors declare that they have no competing interests.
Authors' contributions
RI conceived of the paper and contributed ideas. HCB performed analyses and contributed ideas. MT performed analyses, contributed ideas and drafted the manuscript. All authors read and approved the final manuscript.
Contributor Information
Margaret A Taub, Email: mtaub@jhsph.edu.
Hector Corrada Bravo, Email: hcorrada@umiacs.umd.edu.
Rafael A Irizarry, Email: ririzarr@jhsph.edu.
Acknowledgements
The authors thank Sunduz Keles for sharing figures for this manuscript. Funding for this work as provided by NIH grant HG005220.
References
- Irizarry RA, Hobbs B, Collin F, Beazer-Barclay YD, Antonellis KJ, Scherf U, Speed TP. Exploration, normalization, and summaries of high density oligonucleotide array probe level data. Biostatistics. 2003;4:249–264. doi: 10.1093/biostatistics/4.2.249. [DOI] [PubMed] [Google Scholar]
- Cope LM, Irizarry RA, Jaffee HA, Wu Z, Speed TP. A benchmark for Affymetrix GeneChip expression measures. Bioinformatics. 2004;20:323–331. doi: 10.1093/bioinformatics/btg410. [DOI] [PubMed] [Google Scholar]
- Irizarry RA, Wu Z, Jaffee HA. Comparison of Affymetrix GeneChip expression measures. Bioinformatics. 2006;22:789–794. doi: 10.1093/bioinformatics/btk046. [DOI] [PubMed] [Google Scholar]
- Irizarry RA, Warren D, Spencer F, Kim IF, Biswal S, Frank BC, Gabrielson E, Garcia JG, Geoghegan J, Germino G, Griffin C, Hilmer SC, Hoffman E, Jedlicka AE, Kawasaki E, Martinez-Murillo F, Morsberger L, Lee H, Petersen D, Quackenbush J, Scott A, Wilson M, Yang Y, Ye SQ, Yu W. Multiple-laboratory comparison of microarray platforms. Nat Methods. 2005;2:345–350. doi: 10.1038/nmeth756. [DOI] [PubMed] [Google Scholar]
- Shi L, Reid LH, Jones WD, Shippy R, Warrington JA, Baker SC, Collins PJ, de Longueville F, Kawasaki ES, Lee KY, Luo Y, Sun YA, Willey JC, Setterquist RA, Fischer GM, Tong W, Dragan YP, Dix DJ, Frueh FW, Goodsaid FM, Herman D, Jensen RV, Johnson CD, Lobenhofer EK, Puri RK, Schrf U, Thierry-Mieg J, Wang C, Wilson M, Wolber PK. et al. The MicroArray Quality Control (MAQC) project shows inter- and intraplatform reproducibility of gene expression measurements. Nat Biotechnol. 2006;24:1151–1161. doi: 10.1038/nbt1239. [DOI] [PMC free article] [PubMed] [Google Scholar]
- Shi L, Campbell G, Jones WD, Campagne F, Wen Z, Walker SJ, Su Z, Chu TM, Goodsaid FM, Pusztai L, Shaughnessy JD, Oberthuer A, Thomas RS, Paules RS, Fielden M, Barlogie B, Chen W, Du P, Fischer M, Furlanello C, Gallas BD, Ge X, Megherbi DB, Symmans WF, Wang MD, Zhang J, Bitter H, Brors B, Bushel PR, Bylesjo M. et al. The MicroArray Quality Control (MAQC)-II study of common practices for the development and validation of microarray-based predictive models. Nat Biotechnol. 2010;28:827–838. doi: 10.1038/nbt.1665. [DOI] [PMC free article] [PubMed] [Google Scholar]
- Glas AM, Floore A, Delahaye LJ, Witteveen AT, Pover RC, Bakx N, Lahti-Domenici JS, Bruinsma TJ, Warmoes MO, Bernards R, Wessels LF, Van't Veer LJ. Converting a breast cancer microarray signature into a high-throughput diagnostic test. BMC Genomics. 2006;7:278. doi: 10.1186/1471-2164-7-278. [DOI] [PMC free article] [PubMed] [Google Scholar]
- Monzon FA, Lyons-Weiler M, Buturovic LJ, Rigl CT, Henner WD, Sciulli C, Dumur CI, Medeiros F, Anderson GG. Multicenter validation of a 1,550-gene expression profile for identification of tumor tissue of origin. J Clin Oncol. 2009;27:2503–2508. doi: 10.1200/JCO.2008.17.9762. [DOI] [PubMed] [Google Scholar]
- Wu Z, Irizarry RA, Gentleman R, Martinez-Murillo F, Spencer F. A model-based background adjustment for oligonucleotide expression arrays. J Am Stat Assoc. 2004;99:909–917. doi: 10.1198/016214504000000683. [DOI] [Google Scholar]
- Leek JT, Scharpf RB, Bravo HC, Simcha D, Langmead B, Johnson WE, Geman D, Baggerly K, Irizarry RA. Tackling the widespread and critical impact of batch effects in high-throughput data. Nat Rev Genet. 2010;11:733–739. doi: 10.1038/nrg2825. [DOI] [PMC free article] [PubMed] [Google Scholar]
- Holt RA, Jones SJ. The new paradigm of flow cell sequencing. Genome Res. 2008;18:839–846. doi: 10.1101/gr.073262.107. [DOI] [PubMed] [Google Scholar]
- Dohm JC, Lottaz C, Borodina T, Himmelbauer H. Substantial biases in ultra-short read data sets from high-throughput DNA sequencing. Nucleic Acids Res. 2008;36:e105. doi: 10.1093/nar/gkn425. [DOI] [PMC free article] [PubMed] [Google Scholar]
- Wu H, Irizarry RA, Bravo HC. Intensity normalization improves color calling in SOLiD sequencing. Nat Methods. 2010;7:336–337. doi: 10.1038/nmeth0510-336. [DOI] [PMC free article] [PubMed] [Google Scholar]
- Gorlov IP, Gorlova OY, Sunyaev SR, Spitz MR, Amos CI. Shifting paradigm of association studies: value of rare single-nucleotide polymorphisms. Am J Hum Genet. 2008;82:100–112. doi: 10.1016/j.ajhg.2007.09.006. [DOI] [PMC free article] [PubMed] [Google Scholar]
- Bravo HC, Irizarry RA. Model-based quality assessment and base-calling for second-generation sequencing data. Biometrics. 2010;66:665–674. doi: 10.1111/j.1541-0420.2009.01353.x. [DOI] [PMC free article] [PubMed] [Google Scholar]
- Kao WC, Stevens K, Song YS. BayesCall: A model-based base-calling algorithm for high-throughput short-read sequencing. Genome Res. 2009;19:1884–1895. doi: 10.1101/gr.095299.109. [DOI] [PMC free article] [PubMed] [Google Scholar]
- Yang X, Dorman KS, Aluru S. Reptile: representative tiling for short read error correction. Bioinformatics. 2010;26:2526–2533. doi: 10.1093/bioinformatics/btq468. [DOI] [PubMed] [Google Scholar]
- Zhao X, Palmer LE, Bolanos R, Mircean C, Fasulo D, Wittenberg GM. EDAR: an efficient error detection and removal algorithm for next generation sequencing data. J Comput Biol. 2010;17:1431–142. doi: 10.1089/cmb.2010.0127. [DOI] [PubMed] [Google Scholar]
- Schroder J, Schroder H, Puglisi SJ, Sinha R, Schmidt B. SHREC: a short-read error correction method. Bioinformatics. 2009;25:2157–2163. doi: 10.1093/bioinformatics/btp379. [DOI] [PubMed] [Google Scholar]
- Kelley D, Schatz M, Salzberg S. Quake: quality-aware detection and correction of sequencing errors. Genome Biol. 2010;11:R116. doi: 10.1186/gb-2010-11-3-r28. [DOI] [PMC free article] [PubMed] [Google Scholar]
- Kuan PF, Pan G, Thomson JA, Stewart Ra, Keles S. Technical Report. University of Wisconsin, Department of Statistics; 2009. A statistical framework for the analysis of ChIP-Seq data. [DOI] [PMC free article] [PubMed] [Google Scholar]
- Lee W, Jiang Z, Liu J, Haverty PM, Guan Y, Stinson J, Yue P, Zhang Y, Pant KP, Bhatt D, Ha C, Johnson S, Kennemer MI, Mohan S, Nazarenko I, Watanabe C, Sparks AB, Shames DS, Gentleman R, de Sauvage FJ, Stern H, Pandita A, Ballinger DG, Drmanac R, Modrusan Z, Seshagiri S, Zhang Z. The mutation spectrum revealed by paired genome sequences from a lung cancer patient. Nature. 2010;465:473–477. doi: 10.1038/nature09004. [DOI] [PubMed] [Google Scholar]
- Hansen KD, Brenner SE, Dudoit S. Biases in Illumina transcriptome sequencing caused by random hexamer priming. Nucleic Acids Res. 2010;38:e131. doi: 10.1093/nar/gkq224. [DOI] [PMC free article] [PubMed] [Google Scholar]
- Li J, Jiang H, Wong WH. Modeling non-uniformity in short-read rates in RNA-Seq data. Genome Biol. 2010;11:R50. doi: 10.1186/gb-2010-11-5-r50. [DOI] [PMC free article] [PubMed] [Google Scholar]
- 1000 Genomes Project. http://www.1000genomes.org
- Leek JT, Storey JD. Capturing heterogeneity in gene expression studies by surrogate variable analysis. PLoS Genet. 2007;3:1724–1735. doi: 10.1371/journal.pgen.0030161. [DOI] [PMC free article] [PubMed] [Google Scholar]
- McCall MN, Bolstad BM, Irizarry RA. Frozen robust multiarray analysis (fRMA). Biostatistics. 2010;11:242–253. doi: 10.1093/biostatistics/kxp059. [DOI] [PMC free article] [PubMed] [Google Scholar]
- Li H, Ruan J, Durbin R. Mapping short DNA sequencing reads and calling variants using mapping quality scores. Genome Res. 2008;18:1851–1858. doi: 10.1101/gr.078212.108. [DOI] [PMC free article] [PubMed] [Google Scholar]


