Probing Intracellular Motor Protein Activity Using an Inducible Cargo Trafficking Assay (original) (raw)
Abstract
Although purified cytoskeletal motor proteins have been studied extensively with the use of in vitro approaches, a generic approach to selectively probe actin and microtubule-based motor protein activity inside living cells is lacking. To examine specific motor activity inside living cells, we utilized the FKBP-rapalog-FRB heterodimerization system to develop an in vivo peroxisomal trafficking assay that allows inducible recruitment of exogenous and endogenous kinesin, dynein, and myosin motors to drive specific cargo transport. We demonstrate that cargo rapidly redistributes with distinct dynamics for each respective motor, and that combined (antagonistic) actions of more complex motor combinations can also be probed. Of importance, robust cargo redistribution is readily achieved by one type of motor protein and does not require the presence of opposite-polarity motors. Simultaneous live-cell imaging of microtubules and kinesin or dynein-propelled peroxisomes, combined with high-resolution particle tracking, revealed that peroxisomes frequently pause at microtubule intersections. Titration and washout experiments furthermore revealed that motor recruitment by rapalog-induced heterodimerization is dose-dependent but irreversible. Our assay directly demonstrates that robust cargo motility does not require the presence of opposite-polarity motors, and can therefore be used to characterize the motile properties of specific types of motor proteins.
Introduction
Most intracellular transport is established by the combined activities of different types of motor proteins that move over polarized cytoskeletal tracks (1,2). Whereas kinesin and dynein motors move along microtubules to their plus-end (most kinesins) or minus-end (dynein), myosin motors use actin filaments as tracks (1,2). Both the kinesin and myosin superfamilies comprise a diverse variety of families or classes that participate in a multitude of cellular activities (3,4). In most models, microtubule and actin-based motility is involved in long- and short-range transport, respectively. However, the exact contributions of specific motors to intracellular transport are often still unclear (3).
The basic characteristics of many motor proteins, such as directionality, speed, stall forces, and step sizes, have been revealed by well-controlled in vitro motility assays using purified components. These experiments require tedious optimization of experimental conditions (i.e., purification strategies, buffer conditions, and surface chemistry) that often affect motile properties (5). Furthermore, in vitro reconstitution of specific cellular conditions, such as posttranslational modifications of motors and tracks or motor-directed regulatory mechanisms, has proved to be complicated. We could therefore increase our understanding of intracellular motor protein-based transport if it were possible to perform motor protein motility assays inside cells. However, such cellular experiments are challenging because it is difficult to control specific motor protein activities in living cells. Cellular cargos typically have different combinations of motors attached whose activities are often highly regulated. Thus, the motility of endogenous cargos frequently reports the activity of combinations of different motors, as shown in experiments that probed intracellular motility at high resolution (6–8). To probe the behavior of specific molecular motors inside cells, a well-controlled, motor-specific, in vivo trafficking assay is needed.
In this study, we present a strategy whereby, during live-cell recordings, a cell-permeable small molecule triggers the binding of the motor proteins of interest to stationary peroxisomes, which from then on report the activity of that particular motor. We demonstrate that chemically induced recruitment of exogenous and endogenous kinesin, dynein, and myosin motors is sufficient to establish specific cargo transport with distinct dynamics and directionality in nondisrupted COS7 cells. Simultaneous live-cell imaging of microtubules and kinesin or dynein-propelled peroxisomes, combined with automated particle tracking, reveal that peroxisomes frequently pause at microtubule intersections. Titration and washout experiments furthermore reveal that motor recruitment is dose-dependent but irreversible. Finally, we introduce a strategy by which the combined (antagonistic) actions of more-complex motor combinations can also be probed.
Materials and Methods
DNA constructs
The constructs used in this study were cloned in the following mammalian expression vectors: pCI-neo (Promega, Leiden, The Netherlands), pGW1-CMV (British Biotechnology, Oxford, UK), or p_ß_actin-16-pl (chicken _β_-actin promoter) (9). The original pGW1-CMV vector was modified by inserting a multiple cloning site (_Hin_dIII-AscI-_Eco_RI-BamHI-SalI-NotI-XbaI) to generate pGW2. The original p_ß_actin-16-pl vector was modified by inserting a multiple cloning site (NheI-_Hin_dIII-AscI-_Eco_RI-BamHI-SalI-SpeI-NotI-XbaI), and GFP was ligated in the _Hin_dIII and AscI sites to generate p_ß_actin-GFP. p_ß_actin-mRFP was generated by substituting the GFP-encoding part for mRFP (a gift from Dr. R. Tsien, University of California, San Diego). The p_ß_actin-PEX3-mRFP construct was made by inserting the peroxisomal membrane-targeting sequence (amino acids 1–42) of human PEX3 (Accession NM_003630) (10) in the NheI and HdIII sites in p_ß_actin-mRFP. Using this vector backbone, the PEX3 targeting sequence was fused with several other fluorescent protein variants. The pGW2-GFP-PEX26 construct was made by inserting the GFP-tagged peroxisomal membrane-targeting sequence (amino acids 245–305) of human PEX26 (11) (OpenBiosystems BC016280; a gift from Dr. V. Gelfand, Northwestern University) in the SalI and NotI sites in pGW2. mCherry-_α_-tubulin was a gift from Dr. R. Tsien (12).
FKBP- and FRB-encoding fragments were obtained with the use of an ARGENT Regulated Heterodimerization Kit (Ariad Pharmaceuticals, Cambridge, MA). pC4M-F2E contains two copies of the human FKBP12 (for FK506 binding protein) fragment (FKBP), and pC4-RHE contains a single copy of the modified human FRAP (for FKBP12-rapamycin-associated protein; also called mTOR) fragment (amino acids 2021–2113)(FRB) in which the threonine at amino acid 2098 is mutated to leucine (T2098L) to accommodate the chemical substitution that blocks AP21967 binding to wild-type FRAP. The FKBP∗-encoding fragment was obtained via the ARGENT Regulated Homodimerization Kit (Ariad Pharmaceuticals). pC4M-Fv2E contains two copies of the human FKBP12 (for FK506 binding protein) fragment with a single amino acid substitution, Phe36Val (FKBP∗), allowing homodimerization by addition of AP20187. p_ß_actin-PEX3-mRFP-FKBP was made by polymerase chain reaction (PCR) using the FKBP12 fragment in pC4M-F2E as a template and subcloning in the AscI and _Eco_RI site of the p_ß_actin-PEX3-mRFP vector. Using this vector backbone, the mRFP-encoding part was substituted for other fluorescent protein variants, such as GFP.
p_ß_actin-GFP-FRB was generated by PCR using the FRB fragment in pC4-RHE as a template. KIF5B(1-807)-GFP-FRB and KIF1A(1-489)-GFP-FRB were made with PCR from human Kif5b cDNA (NM_004521), purchased from Geneservice (IMAGE 4422906), and human KIF1A cDNAs (NM_004321) (13) and inserted into p_ß_actin-GFP-FRB. p_ß_actin-mRFP-KLC(1-175)-FRB was made by PCR from rat kinesin light chain (KLC) 1 cDNA (XM_216792) (14) and inserted into p_ß_actin-mRFP-FRB. p_ß_actin-HA-KLC(1-175)-FRB was generated by substituting the mRFP-encoding part for HA epitope tag (YPYDVPDYA). HA-BICD2(1-594)-FRB was cloned in the pCI-neo expression vector by PCR using mouse BICD2 cDNA (15) and the FRB fragment in pC4-RHE as templates. pGW2-FRB-GFP-FKBP∗-DHC(1453-4644) and pGW2-FRB-GFP-DHC were generated by PCR using full-length rat dynein heavy chain (NM_019226) cDNA (16). p_ß_actin-MyosinVb(1-1090)-GFP-FRB and p_ß_actin-myosinVI(1-1041)-GFP-FRB were made by PCR from mouse myosin Vb cDNA (NM_201600), purchased from Geneservice (IMAGE 40099275), and human myosin VI cDNAs (NM_004999), obtained from the Kazusa DNA Research Institute (KIAA0389), and inserted into p_ß_actin-GFP-FRB. p_ß_actin-HA-Melanophilin(147-240)-FRB was made by PCR from mouse melanophilin cDNA (NM_053015), purchased from Geneservice (IMAGE 5121178). pGW2-KIF17(1-547)-GFP-PEX26 was made by PCR from human Kif17 cDNA (NM_020816), purchased from Geneservice (BC065927), and inserted by PCR upstream of the GFP-PEX26 fragment in pGW2.
Cell cultures and transfection
COS-7 and MRC5 cells were cultured in Dulbecco's modified Eagle's medium/Ham's F10 medium (50/50%) containing 10% fetal calf serum and 1% penicillin/streptomycin, and 2–3 days before transfection the cells were plated on 24 mm diameter coverslips. COS-7 and MRC5 cells were transfected with Fugene6 transfection reagent (Roche) according to the manufacturer's protocol and grown for 16 h and 3 days, respectively.
Live-cell image acquisition and processing
Time-lapse, live-cell imaging was performed on a Nikon Eclipse TE2000E (Nikon, Amstelveen, The Netherlands) equipped with an incubation chamber (INUG2-ZILCS-H2; Tokai Hit, Fujinomiya, Japan) mounted on a motorized stage (Prior, Cambridge, UK). Coverslips (24 mm) were mounted in metal rings, immersed in 0.6 mL Ringer's solution (10 mM Hepes, 155 mM NaCl, 1–2 mM CaCl2, 1 mM MgCl2, 2 mM NaH2PO4, 10 mM glucose, pH 7.2) or standard medium (see Fig. 7, G–J), and maintained at 37°C (and 5% CO2). For most acquisitions, four to six cells were selected and imaged every 30 s for 30–60 min using a 40× objective (Plan Fluor, NA=1.3; Nikon) and a Coolsnap HQ camera (Photometrics, Tucson, AZ). A mercury lamp (Osram, Cappelle aan de IJssel, The Netherlands) was used for excitation. To rapidly image microtubules and peroxisomes side-by-side (see Fig. 3, G–J), two-color laser total-internal-reflection fluorescence (TIRF) microscopy using a 100× objective (Apo TIRF, NA=1.49; Nikon), 2.5× Optovar, and EMCDD camera (QuantEM, Roper Scientific, Lisses, France) was performed as described previously (17).
Figure 7.
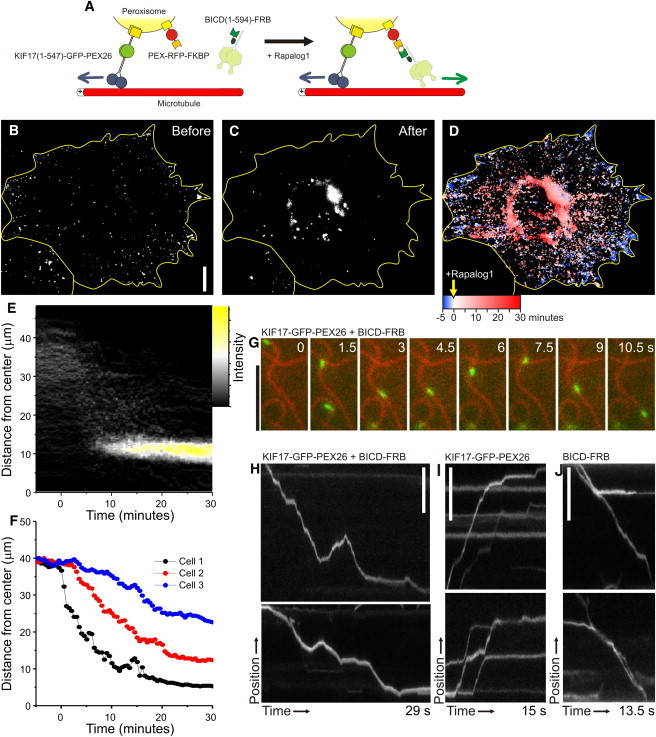
Probing the antagonistic activity of opposite polarity motor proteins using inducible intracellular motility assays. (A) Assay: a fusion construct of KIF17(1-547), GFP, and PEX26 (to allow fusion at the C-terminus of KIF17) targets peroxisomes and redistributes them throughout the cell. PEX-RFP-FKBP also targets these peroxisomes and recruits dynein through BICDN(1-594)-FRB upon addition of rapalog. (B and C) Peroxisome distribution before (B) and after (C) rapalog addition in the presence of KIF17(1-547)-GFP-PEX26 and BICDN(1-594)-FRB. (D) Overlay of sequential binarized images from the recording, color-coded by time as indicated. Blue marks the initial distribution, and red marks regions targeted upon addition of rapalog. (E) Radial kymograph for the recording in B–D, indicating the redistribution of fluorescent peroxisomes relative to the cell axis (see Fig. 2). (F) Time traces of the R90% (see Fig. 2) versus time for three different cells. (G) Frames from a time-lapse recording showing the bidirectional motility of a peroxisome (green, visualized by GFP) upon recruitment of BICD(1-594)-FRB to peroxisomes labeled with KIF17(1-547)-GFP-PEX26 and PEX3-GFP-FKBP (acquired at 10 frames per s). (H) Two kymographs of the motility of peroxisomes extracted from recordings as in G (the upper corresponds to the example in G). (I) Kymographs showing the motility of peroxisomes extracted from recordings as in G before addition of rapalog. (J) Kymographs showing the motility of peroxisomes extracted upon recruitment of BICD(1-594)-FRB to peroxisomes labeled only with PEX3-GFP-FKBP. Scale bars: 10 _μ_m (B) and 5 _μ_m (G–J).
Figure 3.
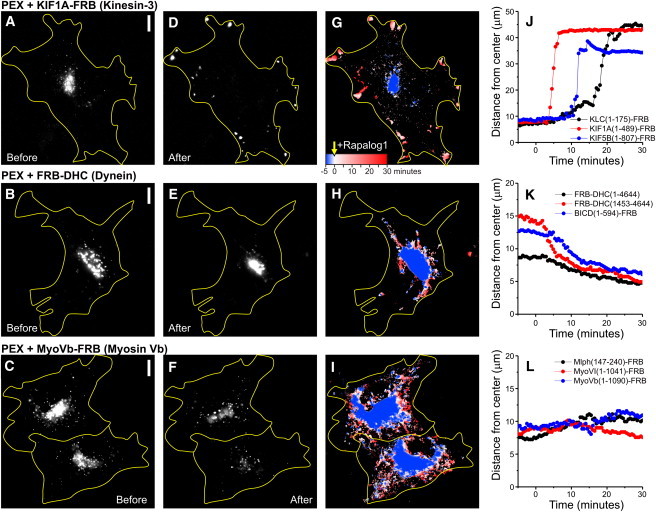
Probing specific motor protein activity using inducible intracellular motility assays. (A–F) Peroxisome distribution before (A–C) and after (D–F) rapalog addition in the presence of KIF1A (A and D), BICDN-FRB (B and E), or Myosin Vb (C and F). (G–I) Overlay of sequential binarized images from the recordings in A–F, color-coded by time as indicated in G. Blue marks the initial distribution, and red marks regions targeted upon addition of rapalog. (J_–_L) Time traces of the R90% (radius of circle enclosing 90% of total cellular PEX intensity; see Fig. 2) for the indicated constructs. Rapalog is added at 0:00 min. Scale bars: 10 _μ_m.
Rapalog (AP21967) and rapalog2 (AP20187; both from Ariad Pharmaceuticals) were dissolved to 1 mM in ethanol. To induce motility during image acquisition, 0.2 mL of culture medium or Ringer's solution (COS-7 cells) with rapalog (4 _μ_M) was added to establish a final rapalog concentration of 1 _μ_M. In experiments using rapalog2 and rapalog, 0.2 mL of 4 _μ_M rapalog2 was first added, followed by 0.2 mL of 5 _μ_M rapalog. To probe the bidirectional motility of peroxisomes driven by KIF17 and dynein (see Fig. 7, G and H), rapalog was used at a final concentration of 20 nM.
Images of live cells were processed and analyzed using MetaMorph (Molecular Devices, Downingtown, PA) or LabVIEW (National Instruments, Austin, TX) software. Before analysis, cells were masked to exclude contributions from neighboring cells to the analysis. For the color plots shown in Figs. 3, G–I, and 7 D, all images of a time-lapse recording were thresholded to yield binary images that were subsequently overlaid nontransparently, starting with the final frame (first frame on top). Each frame was colored using a time-coded gradient that ran from blue to white before and from white to red after Rapalog addition at 0:00.
To create the radial kymographs and calculate the curves of distance versus time shown in Figs. 3, J–L, and 7 F, each pixel value above threshold was inserted into a histogram of intensity I versus distance from center for each video frame, using the pixel size (161 nm) as the bin size (see Fig. 2). From such a histogram, the radius required to include a fraction p of peroxisomes could be obtained by finding the first bin Bn for which∑1nI(Bi)≥p∑1NI(Bi), where N is the total number of bins.
Figure 2.
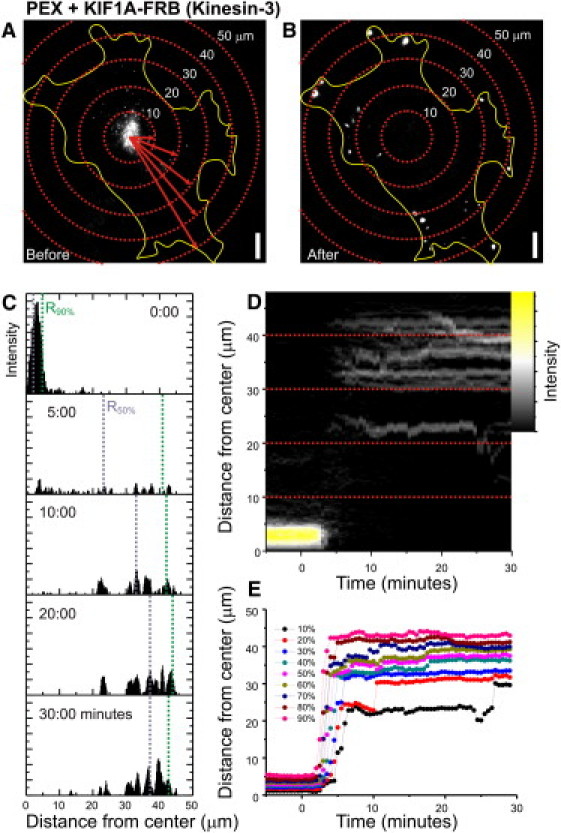
Analyzing intracellular motility assays by radial kymography. (A and B) Peroxisome distribution before (A) and after (B) rapalog addition in the presence of KIF1A, overlaid with concentric circles (centered at the cell center). (C) Each pixel value (if above threshold) is inserted into a histogram of intensity versus distance from center (shown here for five frames, with bin size set to pixel size). (D) The histograms of all frames of the time-lapse recording can be shown as a radial kymograph that directly visualizes all changes in peroxisome distribution upon motor protein recruitment. (E) These histograms can then be used to calculate the radius required to include a given fraction of peroxisomes (i.e., 10%, 20%, …, 90%).
To determine particle trajectories, the frames of a time series were filtered by convolution with a Mexican-hat-type kernel (17), and particles were identified by thresholding at 10–20 times the standard deviation of the background above background. Particle position was then measured as the center of mass of its intensity. Particles from subsequent frames were linked to the nearest existing particles if the distance between them corresponded to speeds of <5 _μ_m/s. Particles from earlier or current frames that could not be linked were identified as disappearing or new particles, respectively. Speed histograms were calculated from the distance between subsequent positions. Directional changes due to track switching were identified manually and filament position was inferred by fitting a second- or third-order polynomial to trajectory segments. One-dimensional displacement curves (see Fig. 4 B) were then obtained by projecting coordinates onto the filament fit.
Figure 4.
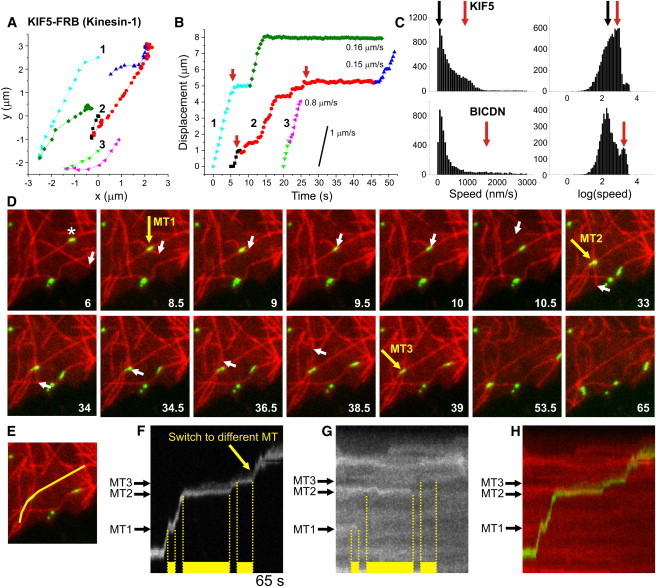
Tracing individual peroxisomes driven by specific motors. (A) Three example traces of KIF5-driven peroxisome motility. Particles often change direction by switching to a different microtubule, marked by a color change. (B) Displacement curves for the traces in A, obtained by projecting the (x,y)-coordinates onto a second- or third-order polynomial fit to the colored segments. Peroxisomes move unidirectionally over microtubules and often pause before switching to a different microtubule (marked by red arrows). (C) Histograms of instantaneous speeds for motile peroxisomes (final displacement > 1 μ_m) driven by KIF5 (top) or dynein (bottom). Instantaneous speeds were calculated (without sign) from the distance between consecutive (x,y) positions. The first peaks (at ∼100 nm/s, marked with black arrows) correspond to nonmotile episodes with positional fluctuations of ∼30 nm (Δ_t = 0.3–0.4 s). Red arrows indicate the average speed of unidirectional runs. N = 8837/5418 intervals from 533/251 trajectories for KIF5 and dynein, respectively. (D) Stills from a time-lapse recording of Kif5-driven GFP-tagged peroxisome (green) motility over microtubules (red). Yellow arrows mark three different microtubule intersections that induce pausing of the peroxisome marked with an asterisk. Motility resumes upon depolymerization of either microtubule, as evident from the white arrows that track the microtubule end. (E) Line used to generate the kymograph in panel F. (F) Kymograph showing peroxisome motility along the line shown in E. Yellow bars mark pauses induced by microtubule intersections. Unbuckling of the crossing microtubule at 9.5 s causes peroxisome deformation and apparent backward motility. (G) Kymograph of tubulin along the line shown in E reveals that the pause ending at intersections 1 and 2 coincides with depolymerization of the crossing microtubule. (H) Color merge of kymographs shown in F and G.
Results and Discussion
To probe motility driven by specific motors, we developed an in vivo peroxisomal trafficking assay in which, during live-cell recordings, a cell-permeable small molecule triggers the binding of the motor proteins of interest to stationary peroxisomes, which from then on report the activity of that particular motor (Fig. 1 A). Peroxisomes were labeled by expressing PEX-RFP-FKBP, a fusion construct of PEX3-RFP, the peroxisomal membrane-targeting signal coupled to the red fluorescent protein (RFP), and FKBP12, a domain that can be cross-linked to an FRB domain using an analog of the natural product rapamycin (AP21967, hereafter called rapalog) (18). This FRB domain was then fused to a variety of motor proteins and motor-cargo adaptors (Fig. 1, B–E) such that addition of rapalog would recruit them to peroxisomes.
Figure 1.
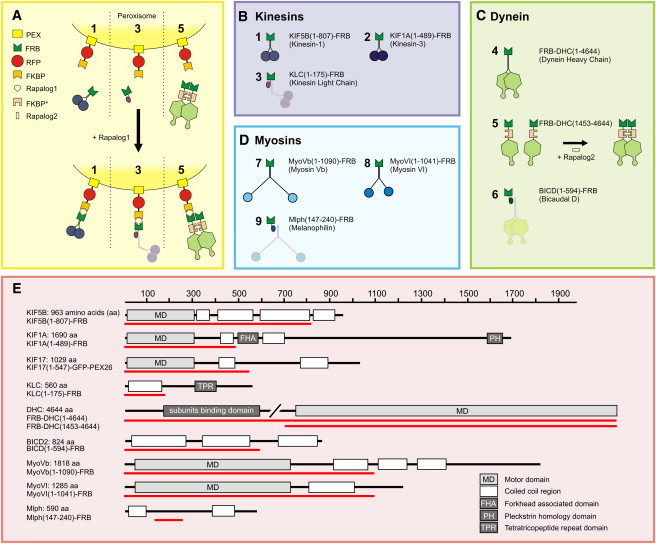
Inducible intracellular motility assays. (A–D) Assay: a fusion construct of PEX, RFP, and FKBP targets peroxisomes. Fusions of FRB with (truncated) motor constructs (1, 2, 4, 5, 7, and 8) or adaptor protein fragments (3, 6, and 9) are recruited to FKBP and consequently the peroxisomes upon addition of rapalog. A truncated dynein fused to FKBP∗ and FRB (5) is first dimerized by rapalog2. (E) Overview of the domain composition of the full-length versions of each motor protein or motor protein adaptor used in this study. The red line indicates the portion used to generate a truncated version fused to FRB.
To selectively probe motility driven by kinesin family members, we fused truncated kinesin constructs lacking their tail domains, which are known to be constitutively active without interference of regulatory pathways (19), to an FRB fragment and coexpressed them with PEX-mRFP-FKBP (Fig. 1 B). In addition, to probe the motility of endogenous kinesin-1 motor proteins, we fused the N-terminal domain of the kinesin-1 regulatory subunit KLC to FRB (Fig. 1 B) (14). In the absence of rapalog, most peroxisomes were relatively immobile and distributed near the cell center (Figs. 2 A and 3 A). Furthermore, rapalog treatment of cells expressing only PEX-RFP-FKBP did not induce motility. However, addition of the rapalog to cells coexpressing the plus-end directed motor proteins KIF5 (Kinesin-1) or KIF1A (Kinesin-3) induced a rapid redistribution of peroxisomes to the cell periphery, where most microtubules plus-ends are located (Figs. 2, A–E, and 3, A, D, G, and J, and Movie S1 in the Supporting Material). In addition, rapalog addition in the presence of KLC-FRB also induced outward motility, consistent with a selective activation of endogenous plus-end-directed kinesin-1 motors (Fig. 3 J). We quantified motility by measuring for each time point the radius required to include 90% of the total intensity (Fig. 2, A–E), which after rapalog addition increased from <10 _μ_m to ∼40 _μ_m within 1–10 min (Fig. 3 J). These results demonstrate that our assay successfully recruits specific kinesin motors to drive motility of peroxisomes.
To selectively probe cargo motility driven by minus-end-directed cytoplasmic dynein, we used three different approaches (Fig. 1 C). First, we used a full-length dynein heavy chain fused to FRB (FRB-DHC(1-4644)). This DHC construct includes binding sites for all dynein subunits and its accessory protein complex dynactin. To create a minimally processive dynein motor without these additional interactions, we adopted a strategy previously used to probe yeast dynein in vitro (20). A truncated fragment comprising the AAA ATP-ase domain and MT binding site (DHC(1453-4644)) was fused to both FRB and a homodimerization domain FKBP∗, which homodimerizes upon addition of rapalog2 (Fig. 1 C). Finally, to probe the motility of endogenous dynein motor proteins, we used the N-terminal part of the dynein/dynactin interacting protein BICD fused to FRB (21). For all of these constructs, the addition of rapalog to cells coexpressing PEX-RFP-FKBP resulted in the accumulation of peroxisomes at the center of the cell, around the centrosome where most minus-ends are located (Fig. 3, B, E, H, and K, and Movie S2). Together, these results indicate that our new trafficking assay can inducibly probe the motility of motor proteins directed to either the microtubule plus- or minus-end.
Finally, to selectively probe actin-based cargo motility, we first fused FRB to truncations of both Myosin Vb and Myosin VI, which are processive motors that move to the actin plus- (barbed) and minus- (pointed) end, respectively (22) (Fig. 1 D). Moreover, we used a truncated construct of the Myosin Va interacting protein melanophilin to recruit endogenous Myosin V motors (23). Recruitment of myosin motor proteins to peroxisomes induced their motility; however, rapid directed redistribution (such as observed with microtubule-based motors) did not occur (Fig. 3, C, F, I, and L, and Movie S3). Instead, peroxisomes wandered around by taking short runs in random directions. This is consistent with previous reports that examined the motility of intracellular quantum dots coated with purified Myosin V, and reflects the limited overall polarity of the actin filaments inside COS7 cells (24). These results show that our assay can also probe cargo transport driven by specific myosin motors inside cells.
We next used high-resolution TIRF microscopy to examine motor-driven peroxisome motility in more detail (Fig. 4). Automated particle tracking was employed to extract peroxisome trajectories and calculate instantaneous velocities (Fig. 4, A–C). These trajectories revealed that rapid unidirectional runs of ∼1 _μ_m/s peroxisomes were frequently interspersed with long pauses, especially before abrupt directional changes, which strongly reduced the average particle velocity (Fig. 4, A–C). To test whether pauses and directional changes were caused by the interaction with a second microtubule, we employed rapid side-by-side dual-color imaging to visualize both peroxisomes and microtubules labeled with PEX3-GFP-FKBP and Cherry-tubulin, respectively. The peroxisomes typically paused at microtubule intersections before continuing on either the same or crossing microtubule (Fig. 4, D–H), consistent with previous in vitro work that examined bead motility on stabilized microtubules immobilized on a coverglass surface (25). Of interest, motility often stalled until the intersection was dissolved by depolymerization of the crossing microtubule (Fig. 4, D–H).
We next tested the reversibility and dose dependence of chemically induced motor recruitment using KIF1A fused to FRB (Figs. 5 and 6). Extensive medium exchange was performed 30 min after rapalog addition. Half an hour after washout, peroxisomes were still located at the cell periphery (Fig. 5, A–C). This was not entirely unexpected, because redistribution to their original location would require additional motors. On the other hand, many peroxisomes still displayed peripheral motility, suggesting that motors had not completely detached upon washout (Fig. 5, A–C). To directly test whether rapalog washout could reverse motor recruitment, we explored heterodimerization dynamics using GFP-FRB and PEX3-RFP-FKBP (Fig. 5, D–H). Initially, GFP-FRB was diffusely distributed throughout the cytoplasm and nucleus, but rapalog addition induced rapid recruitment of GFP-FRB to the RFP-labeled peroxisomes (Fig. 5 D). Remarkably, extensive rapalog washout did not reverse or completely stop GFP recruitment, suggesting that heterodimerization is irreversible and that rapalog is unable to exit cells (Fig. 5, D–H). These results are consistent with earlier work that examined the FKBP-rapamycin-FRB interaction and found that rapamycin dissociated from the FKBP domain with a half-time of 17.5 h (26). Titration experiments revealed that lower rapalog concentrations (1 and 10 nM) still induced motility, but only after a delay of ∼20 and ∼50 min, respectively. Of interest, using 100 nM rather than 1 _μ_M seems slightly more optimal, as the times of onsets become less variable (Fig. 6, C, D, H). In the range of 10–1000 nM, the initial dispersion velocity was relatively constant at 400 nm/s. Taken together, these results suggest that a threshold number of motors is required to initiate motility, but recruitment of additional motors does not increase velocity.
Figure 5.
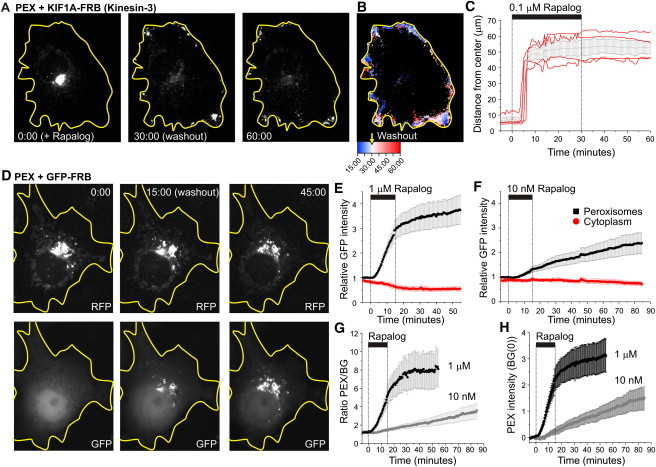
Rapalog-induced recruitment is not reversible by rapalog washout. (A) Frames from a time-lapse recording showing RFP-labeled peroxisomes in a KIF1A-FRB expressing cell. Rapalog was added at time 0:00 and washed out at time 30:00. (B) Time-coded color plot from the recording in A, in which blue and red mark distributions before (starting 15 min after Rapalog addition) and after washout, respectively. (C) Time traces of R90% for four different cells (red). The black curve shows average ± SE; 0.1 _μ_m rapalog was present from 0 to 30 min. (D) Recruitment of GFP-FRB (bottom) to RFP-FKBP labeled peroxisomes (top) using 1 mM rapalog present from 0 to 15 min. (E and F) Time trace of GFP intensity in regions with (black) and without (red) peroxisomes in the presence of 1 _μ_M (E) and 10 nM (F) rapalog. Regions with peroxisomes were identified by thresholding the RFP time series. Traces were normalized by the average GFP intensity before rapalog addition in peroxisome-containing regions. Plots show average ± SE for 5 (E) and 4 (F) cells. (G) Ratio between the average GFP intensity in regions with and without peroxisomes calculated from E and F. Ratios start just above one because free cytoplasmic GFP levels are higher in the thicker perinuclear region that contains the peroxisomes. (H) Time traces of peroxisome-bound GFP intensities relative to the initial intensity of free GFP, obtained by subtracting a normalized time trace of cytoplasmic GFP intensity from the GFP intensity in peroxisome-containing regions.
Figure 6.
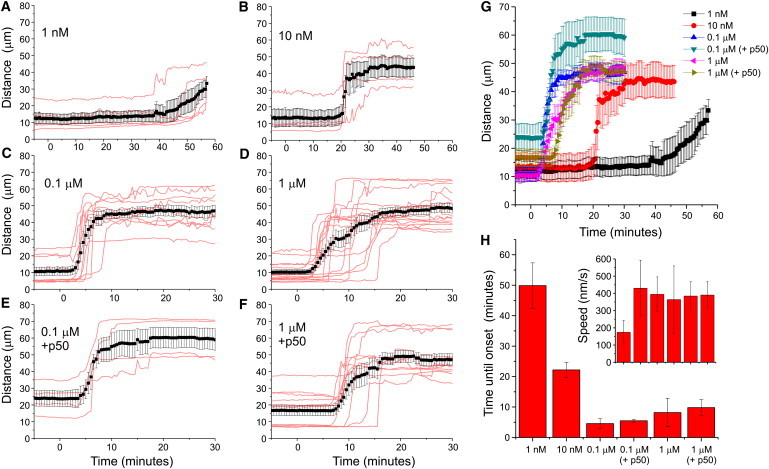
Dose dependence of rapalog-induced motor recruitment. (A–D) Time traces of R90% upon addition of 1 nM (A), 10 nM (B), 0.1 mM (C), and 1 mM rapalog to recruit KIF1A to peroxisomes. Red curves correspond to individual cells, black curves plot average ± SE. N = 5, 4, 10, and 15 cells, respectively. (E and F) Time traces of R90% upon addition of 0.1 mM (E) and 1 mM (F) rapalog to cells expressing PEX-mRFP-FKBP, KIF1A-FRB, and GFP-p50. Red curves correspond to individual cells, black curves plot average ± SE. N = 4 and 13 cells, respectively. (G) Plot of all averaged traces from A–F. (H) Average time until motility onset for the curves in A–F, defined as the first time point t at which R90%(t) exceeds R90%_average (average R90% before t = 0) with 10 _μ_m. Inset shows velocities determined from the differences between the first time points at which R90%(t) exceeds R90%_average with 5 and 10 _μ_m, respectively. Error bars show SE.
A central question concerning intracellular transport is, how do different antagonistic motor proteins present on the same cargo influence each other (1,27–29)? Investigators recently addressed this question by exploring cargo distributions on artificial microtubule bundles in F-actin-depleted Drosophila S2 cells and concluded that both plus- and minus-end motors are required to establish persistent motility, and opposing motors activate each other to initiate motility (27). In contrast, our experiments reveal robust unidirectional motility upon recruitment of a single type of motor to immobile peroxisome. Nevertheless, these peroxisomes could hypothetically still carry a small number of opposing motors that initiate motility. Therefore, to test whether opposing motors are required to initiate motility in mammalian cells with an intact cytoskeleton, we recruited KIF1A to peroxisomes in the presence of p50/dynamitin, a potent disruptor of dynein-cargo complexes (21,30), and found that KIF1A-driven peroxisome motility was unaffected by dynein disruption. These results suggest that motor activation by opposite-polarity motors is not required to trigger cargo transport in unperturbed COS7 cells.
To test how cargo motility is affected upon recruitment of an antagonistic motor, we added a new component to our peroxisome assay. We generated a fusion construct of KIF17 and the peroxisomal membrane-targeting signal of PEX26, which upon expression redistributed peroxisomes to the periphery of the cell (Fig. 7, A and B). Coexpressed PEX-RFP-FKBP targeted to the same peroxisomes, allowing inducible recruitment of dynein through BICDN(1-594)-FRB by addition of rapalog (Fig. 7 A). This resulted in a redistribution of peroxisomes to more-central regions of the cell (Fig. 7, C–F, and Movie S4). Probing motility over individual microtubules revealed that peroxisomes, which moved unidirectionally when driven by either KIF17 or dynein (Fig. 7, I and J), could move bidirectionally if both KIF17 and dynein were present (Fig. 7, G and H, and Movie S5) (31). These results demonstrate that we have established a molecular trafficking toolbox that allows visualization of the combined (antagonistic) action of different motor proteins along individual cytoskeleton filaments inside living cells.
Conclusions
In this study we developed a generic assay to probe the motility of specific motor proteins inside living cells and demonstrated that we can probe the motility of selected dynein, kinesin, and myosin motors, as well as combinations of motors. Our assay directly shows that robust cargo motility in mammalian COS7 cells does not require the presence of opposite-polarity motors, as was recently suggested for motility on artificial microtubule bundles that form upon actin disruption in Drosophila S2 cells (27). Furthermore, we show that both kinesin- and dynein-driven peroxisomes frequently pause and switch directions at microtubule intersections, thereby limiting overall velocity. Finally, titration and washout experiments revealed that motor recruitment is dose-dependent but irreversible.
Our assay has distinct advantages over earlier approaches to study specific motors inside cells (6–8,19,24,32). First of all, all fusion proteins are expressed from eukaryotic expression vectors and are synthesized by the cells themselves, eliminating the difficulty of introducing purified proteins into cells (24,32). Furthermore, cargo motility requires the addition of rapalog, providing a well-defined starting point for motor activity, as well as the crucial ability to determine whether motility is selectively mediated by the FRB-labeled motor proteins or motor-adaptors. In addition, because bright peroxisomes are used as the readout, the assay does not depend on the fortuitous high filament affinity of certain motors required to visualize them as single molecules inside cells (19).
Our approach reveals how recombinant or endogenous motors move artificial cargo over the native intracellular cytoskeleton. More work is needed to determine how this relates to the behavior of motor proteins that are recruited to endogenous cargo using the normal regulatory pathways, and are frequently assembled into well-defined, higher-order complexes. Recent biophysical work carefully examined the transport of endogenous cargo inside cells using optical tweezers to measure stall forces and infer motor copy numbers (8,31). For endosomes in Dictyostelium cells, this revealed that transport typically involves four to eight weak and detachment-prone dyneins in a tug-of-war against a single strong kinesin (31). Similar low motor copy numbers were obtained from a biochemical analysis of purified transport vesicles (28). Optical trapping experiments in Drosophila demonstrated a bimodal distribution of stall forces for kinesin-based transport of lipid droplets, consistent with the presence of multiple but few kinesin motors (8). Remarkably, travel distance did not change with motor number, suggesting the presence of higher-order regulatory mechanisms that control directional switching. In contrast, our approach likely recruits far more motors to the peroxisomes (Fig. 5 D), and these motors are probably not embedded into a endogenous regulatory complex on the cargo. Therefore, mimicking endogenous cargo transport more closely by controlling motor copy number and recruiting regulatory complexes to artificial cargo will be a major challenge for future work.
Nevertheless, we anticipate that this assay will be widely applicable to the study of molecular motors and intracellular transport, for several reasons: First, the assay enables investigators to study the motile characteristics of hard-to-purify or unstable motor proteins, and to test the effect of specific mutations or regulatory proteins on motility. Rapalog-induced dimerization has already been used to examine how dimerization of different Myosin-X constructs affects actin organization inside cells (33). Second, models of the collective motility and cooperative actions of different combinations of motors on moving cargo can be tested. Third, the influence of posttranslational modifications of motors, as well as their tracks and cytoskeleton-associated proteins (e.g., MAPs) that control the binding of specific motors to specific tracks, can be explored. For example, we recently performed a peroxisome trafficking assay on hippocampal neurons and found that kinesins preferentially target axons, whereas dynein drives transport selectively into the dendrites (34). Furthermore, although we have focused on motors involved in intracellular transport, a similar approach could be used to study mitotic sliding motors whose cargos are microtubules. For example, one could use rapalog to rapidly change the force balance between antagonistic microtubule sliding motors by fusing two halves of a bipolar motor, such as Kinesin-5 (5). In addition, one could track the motility driven by motors of known directionality to determine the overall polarity organization of microtubules and actin in various cell types. In conclusion, our in vivo trafficking assay allows for a wide spectrum of well-controlled motor protein experiments to be performed inside living cells.
Acknowledgments
We thank Ariad Pharmaceuticals for the FKBP/FRB cDNAs, rapalog (AP21967), and rapalog2 (AP20187); Kristen Verhey for the KLC1 cDNA; Richard Vallee for the DHC cDNA; Eunjoon Kim for the KIF1A cDNA; Vladimir Gelfand for the PEX26 cDNA; Ben Distel for the PEX3 cDNA; and Roger Tsien for the mCherry-_α_-tubulin and mRFP cDNA.
L.C.K. was supported by the Erasmus Medical Center (EMC fellowship) and the Netherlands Organization for Scientific Research (NWO-VENI). C.C.H. was supported by the Netherlands Organization for Scientific Research (NWO-ALW and NWO-CW), the Netherlands Organization for Health Research and Development (ZonMW-VIDI and ZonMW-TOP), the European Science Foundation, the European Molecular Biology Organization Young Investigators Program, and the Human Frontier Science Program.
Supporting Material
Document S1. Figure
Movie S1. Peroxisome motility in a COS7 cell before and after recruitment of Kinesin-3
Movie S2 Peroxisome motility in a COS7 cell before and after recruitment of Dynein
Movie S3 Peroxisome motility in a COS7 cell before and after recruitment of Myosin Vb
Movie S4 Motility of peroxisomes with attached Kinesin-2 before and after recruitment of Dynein
Movie S5 Bidirectional motility of peroxisomes with attached Kinesin-2 and Dynein
References
- 1.Vale R.D. The molecular motor toolbox for intracellular transport. Cell. 2003;112:467–480. doi: 10.1016/s0092-8674(03)00111-9. [DOI] [PubMed] [Google Scholar]
- 2.Schliwa M., Woehlke G. Molecular motors. Nature. 2003;422:759–765. doi: 10.1038/nature01601. [DOI] [PubMed] [Google Scholar]
- 3.Woolner S., Bement W.M. Unconventional myosins acting unconventionally. Trends Cell Biol. 2009;19:245–252. doi: 10.1016/j.tcb.2009.03.003. [DOI] [PMC free article] [PubMed] [Google Scholar]
- 4.Hirokawa N., Takemura R. Molecular motors in neuronal development, intracellular transport and diseases. Curr. Opin. Neurobiol. 2004;14:564–573. doi: 10.1016/j.conb.2004.08.011. [DOI] [PubMed] [Google Scholar]
- 5.Kapitein L.C., Kwok B.H., Peterman E.J. Microtubule cross-linking triggers the directional motility of kinesin-5. J. Cell Biol. 2008;182:421–428. doi: 10.1083/jcb.200801145. [DOI] [PMC free article] [PubMed] [Google Scholar]
- 6.Kural C., Kim H., Selvin P.R. Kinesin and dynein move a peroxisome in vivo: a tug-of-war or coordinated movement? Science. 2005;308:1469–1472. doi: 10.1126/science.1108408. [DOI] [PubMed] [Google Scholar]
- 7.Nan X., Sims P.A., Xie X.S. Observation of individual microtubule motor steps in living cells with endocytosed quantum dots. J. Phys. Chem. B. 2005;109:24220–24224. doi: 10.1021/jp056360w. [DOI] [PubMed] [Google Scholar]
- 8.Shubeita G.T., Tran S.L., Gross S.P. Consequences of motor copy number on the intracellular transport of kinesin-1-driven lipid droplets. Cell. 2008;135:1098–1107. doi: 10.1016/j.cell.2008.10.021. [DOI] [PMC free article] [PubMed] [Google Scholar]
- 9.Kaech S., Ludin B., Matus A. Cytoskeletal plasticity in cells expressing neuronal microtubule-associated proteins. Neuron. 1996;17:1189–1199. doi: 10.1016/s0896-6273(00)80249-4. [DOI] [PubMed] [Google Scholar]
- 10.Kammerer S., Holzinger A., Roscher A.A. Cloning and characterization of the gene encoding the human peroxisomal assembly protein Pex3p. FEBS Lett. 1998;429:53–60. doi: 10.1016/s0014-5793(98)00557-2. [DOI] [PubMed] [Google Scholar]
- 11.Halbach A., Landgraf C., Rottensteiner H. Targeting of the tail-anchored peroxisomal membrane proteins PEX26 and PEX15 occurs through C-terminal PEX19-binding sites. J. Cell Sci. 2006;119:2508–2517. doi: 10.1242/jcs.02979. [DOI] [PubMed] [Google Scholar]
- 12.Shaner N.C., Campbell R.E., Tsien R.Y. Improved monomeric red, orange and yellow fluorescent proteins derived from Discosoma sp. red fluorescent protein. Nat. Biotechnol. 2004;22:1567–1572. doi: 10.1038/nbt1037. [DOI] [PubMed] [Google Scholar]
- 13.Lee J.R., Shin H., Kim E. Characterization of the movement of the kinesin motor KIF1A in living cultured neurons. J. Biol. Chem. 2003;278:2624–2629. doi: 10.1074/jbc.M211152200. [DOI] [PubMed] [Google Scholar]
- 14.Verhey K.J., Lizotte D.L., Rapoport T.A. Light chain-dependent regulation of kinesin's interaction with microtubules. J. Cell Biol. 1998;143:1053–1066. doi: 10.1083/jcb.143.4.1053. [DOI] [PMC free article] [PubMed] [Google Scholar]
- 15.Hoogenraad C.C., Akhmanova A., Galjart N. Mammalian Golgi-associated Bicaudal-D2 functions in the dynein-dynactin pathway by interacting with these complexes. EMBO J. 2001;20:4041–4054. doi: 10.1093/emboj/20.15.4041. [DOI] [PMC free article] [PubMed] [Google Scholar]
- 16.Tai C.Y., Dujardin D.L., Vallee R.B. Role of dynein, dynactin, and CLIP-170 interactions in LIS1 kinetochore function. J. Cell Biol. 2002;156:959–968. doi: 10.1083/jcb.200109046. [DOI] [PMC free article] [PubMed] [Google Scholar]
- 17.Kapitein L.C., Janson M.E., Peterman E.J. Microtubule-driven multimerization recruits ase1p onto overlapping microtubules. Curr. Biol. 2008;18:1713–1717. doi: 10.1016/j.cub.2008.09.046. [DOI] [PubMed] [Google Scholar]
- 18.Clackson T., Yang W., Holt D.A. Redesigning an FKBP-ligand interface to generate chemical dimerizers with novel specificity. Proc. Natl. Acad. Sci. USA. 1998;95:10437–10442. doi: 10.1073/pnas.95.18.10437. [DOI] [PMC free article] [PubMed] [Google Scholar]
- 19.Cai D., Verhey K.J., Meyhöfer E. Tracking single kinesin molecules in the cytoplasm of mammalian cells. Biophys. J. 2007;92:4137–4144. doi: 10.1529/biophysj.106.100206. [DOI] [PMC free article] [PubMed] [Google Scholar]
- 20.Reck-Peterson S.L., Yildiz A., Vale R.D. Single-molecule analysis of dynein processivity and stepping behavior. Cell. 2006;126:335–348. doi: 10.1016/j.cell.2006.05.046. [DOI] [PMC free article] [PubMed] [Google Scholar]
- 21.Hoogenraad C.C., Wulf P., Akhmanova A. Bicaudal D induces selective dynein-mediated microtubule minus end-directed transport. EMBO J. 2003;22:6004–6015. doi: 10.1093/emboj/cdg592. [DOI] [PMC free article] [PubMed] [Google Scholar]
- 22.Buss F., Spudich G., Kendrick-Jones J. Myosin VI: cellular functions and motor properties. Annu. Rev. Cell Dev. Biol. 2004;20:649–676. doi: 10.1146/annurev.cellbio.20.012103.094243. [DOI] [PubMed] [Google Scholar]
- 23.Geething N.C., Spudich J.A. Identification of a minimal myosin Va binding site within an intrinsically unstructured domain of melanophilin. J. Biol. Chem. 2007;282:21518–21528. doi: 10.1074/jbc.M701932200. [DOI] [PubMed] [Google Scholar]
- 24.Nelson S.R., Ali M.Y., Warshaw D.M. Random walk of processive, quantum dot-labeled myosin Va molecules within the actin cortex of COS-7 cells. Biophys. J. 2009;97:509–518. doi: 10.1016/j.bpj.2009.04.052. [DOI] [PMC free article] [PubMed] [Google Scholar]
- 25.Ross J.L., Shuman H., Goldman Y.E. Kinesin and dynein-dynactin at intersecting microtubules: motor density affects dynein function. Biophys. J. 2008;94:3115–3125. doi: 10.1529/biophysj.107.120014. [DOI] [PMC free article] [PubMed] [Google Scholar]
- 26.Hosoi H., Dilling M.B., Houghton P.J. Rapamycin causes poorly reversible inhibition of mTOR and induces p53-independent apoptosis in human rhabdomyosarcoma cells. Cancer Res. 1999;59:886–894. [PubMed] [Google Scholar]
- 27.Ally S., Larson A.G., Gelfand V.I. Opposite-polarity motors activate one another to trigger cargo transport in live cells. J. Cell Biol. 2009;187:1071–1082. doi: 10.1083/jcb.200908075. [DOI] [PMC free article] [PubMed] [Google Scholar]
- 28.Hendricks A.G., Perlson E., Holzbaur E.L. Motor coordination via a tug-of-war mechanism drives bidirectional vesicle transport. Curr. Biol. 2010;20:697–702. doi: 10.1016/j.cub.2010.02.058. [DOI] [PMC free article] [PubMed] [Google Scholar]
- 29.Welte M.A. Bidirectional transport along microtubules. Curr. Biol. 2004;14:R525–R537. doi: 10.1016/j.cub.2004.06.045. [DOI] [PubMed] [Google Scholar]
- 30.Burkhardt J.K., Echeverri C.J., Vallee R.B. Overexpression of the dynamitin (p50) subunit of the dynactin complex disrupts dynein-dependent maintenance of membrane organelle distribution. J. Cell Biol. 1997;139:469–484. doi: 10.1083/jcb.139.2.469. [DOI] [PMC free article] [PubMed] [Google Scholar]
- 31.Soppina V., Rai A.K., Mallik R. Tug-of-war between dissimilar teams of microtubule motors regulates transport and fission of endosomes. Proc. Natl. Acad. Sci. USA. 2009;106:19381–19386. doi: 10.1073/pnas.0906524106. [DOI] [PMC free article] [PubMed] [Google Scholar]
- 32.Courty S., Luccardini C., Dahan M. Tracking individual kinesin motors in living cells using single quantum-dot imaging. Nano Lett. 2006;6:1491–1495. doi: 10.1021/nl060921t. [DOI] [PubMed] [Google Scholar]
- 33.Tokuo H., Mabuchi K., Ikebe M. The motor activity of myosin-X promotes actin fiber convergence at the cell periphery to initiate filopodia formation. J. Cell Biol. 2007;179:229–238. doi: 10.1083/jcb.200703178. [DOI] [PMC free article] [PubMed] [Google Scholar]
- 34.Kapitein L.C., Schlager M.A., Hoogenraad C.C. Mixed microtubules steer dynein-driven cargo transport into dendrites. Curr. Biol. 2010;20:290–299. doi: 10.1016/j.cub.2009.12.052. [DOI] [PubMed] [Google Scholar]
Associated Data
This section collects any data citations, data availability statements, or supplementary materials included in this article.
Supplementary Materials
Document S1. Figure
Movie S1. Peroxisome motility in a COS7 cell before and after recruitment of Kinesin-3
Movie S2 Peroxisome motility in a COS7 cell before and after recruitment of Dynein
Movie S3 Peroxisome motility in a COS7 cell before and after recruitment of Myosin Vb
Movie S4 Motility of peroxisomes with attached Kinesin-2 before and after recruitment of Dynein
Movie S5 Bidirectional motility of peroxisomes with attached Kinesin-2 and Dynein