Analysis Of Whole Genome Biomarker Expression In Blood And Brain (original) (raw)
. Author manuscript; available in PMC: 2011 Jun 5.
Published in final edited form as: Am J Med Genet B Neuropsychiatr Genet. 2010 Jun 5;153B(4):919–936. doi: 10.1002/ajmg.b.31062
Abstract
The consistency of peripheral gene expression data and the overlap with brain expression has not been evaluated in biomarker discovery, nor has it been reported in multiple tissues from the same subjects on a genome wide transcript level. The effects of processing whole blood, transformation, and passaged cell lines on gene expression profiling was studied in healthy subjects using Affymetrix arrays. Ficoll extracted peripheral blood mononuclear cells (PBMCs), Epstein-Barr virus (EBV) transformed lymphocytes, passaged lymphoblastic cell lines (LCLs), and whole blood from Tempus tubes were compared. There were 6,813 transcripts differentially expressed between different methods of blood preparation. Principal component analysis resolved two partitions involving pre- and post-transformation EBV effects.
Combining results from Affymetrix arrays, postmortem subjects' brain and PBMC profiles showed co-expression levels of summarized transcripts for 4,103 of 17,859 (22.9%) RefSeq transcripts. In a control experiment, rat hemi-brain and blood showed similar expression levels for 19% of RefSeq transcripts. After filtering transcripts that were not significantly different in abundance between human cerebellum and PBMCs from the Affymetrix exon array the correlation in mean transcript abundance was high as expected (r = 0.98). Differences in the alternative splicing index in brain and blood were found for about 90% of all transcripts examined. This study demonstrates over 4,100 brain transcripts co-expressed in blood samples can be further examined by in vitro and in vivo experimental studies of blood and cell lines from patients with psychiatric disorders.
Keywords: biomarker, gene expression, whole genome
Introduction
The peripheral biomarker discovery process in psychiatric disorders has been rejuvenated by pharmacogenomics and gene expression high throughput data. Advances in the field of biomarkers have gained momentum partially from commercially available microarray high throughput measurements of mRNA. However, the field of biomarker discovery for neuropsychiatric disorders has not yet performed basic experiments to address methodological issues as to what may constitute a biomarker. In the field of cancer pathology there are biopsied samples from tumor progression; however, in psychiatry brain biopsies from psychiatric patients are not feasible for diagnostic purposes, and access to healthy brain tissue is not possible for living control subjects. The interpretation of postmortem brain gene expression profiles are often complicated by clinical, tissue, gender, aging, and RNA quality factors (Atz et al., 2007; Erraji-Benchekroun et al., 2005; Galfalvy et al., 2003; Lipska et al., 2006; Tomita et al., 2004).
As a potential window into neural function, researchers in neuropsychiatry have focused on sampling other tissues from living subjects such as nasal biopsy (McCurdy et al., 2006; Sawa et al., 1999; Vawter et al., 1996; Wolozin et al., 1993), skin biopsy (Catts et al., 2006; Hagenfeldt et al., 1987; Mukherjee et al., 1994; Tosic et al., 2006), CSF, urine, serum and blood. Peripheral blood mononuclear cells (PBMCs) are readily available and a commonly studied source of mRNA from living participants. Many studies of complex psychiatric disorders have collected PBMCs and transformed the cells with Epstein-Barr virus (Baron et al., 2006; Hu et al., 2006; Middleton et al., 2005; Middleton et al., 2004; Philibert et al., 2007a; Philibert et al., 2007b) or have reported transcription profile results on freshly isolated PBMCs (Bowden et al., 2006; Glatt et al., 2005; Segman et al., 2005; Tsuang et al., 2005). The differences in biomarker expression due to these manipulations have not been addressed, nor have temporal, circadian or longitudinal assessments been made.
The first aim of this study was to estimate the common profile in the global transcriptome within the same subjects before and after EBV transformation. Characterization of gene expression profiles of different cell preparations in healthy controls may be useful for future experimental design and interpretation of peripheral biomarker experiments. There was a report on the effects of Epstein-Barr virus transformation on the transcription profile of PBMCs which surveyed about 4,000 genes in lymphoma (Carter et al., 2002), but not the entire transcriptome. We addressed prominent factors that are different between biomarker studies of whole blood, Ficoll extracted PBMCs, Epstein-Barr virus (EBV) transformed lymphocytes, and EBV transformed and passaged lymphoblastic cell lines (LCLs). A within subjects experimental design was followed and subjects' blood draws were performed at the same time of day (to control for circadian effects) following an overnight stay at the University of California, Irvine Medical Center and used in each of these five different preparation methods. The second aim was to estimate the overlap between blood and brain gene expression and alternative splicing of transcripts in matched human and rodent samples. The data from both aims one and two were also contrasted to determine transcripts that are co-expressed in brain and different blood preparations.
Materials and Methods
Human Subjects
Informed consent was obtained from each control subject using an approved University of California IRB protocol. All work was approved by the University of California, Irvine Human Subjects Committee. Blood samples were drawn at 7.A.M., before breakfast after an overnight stay in a UCIMC sleep research center (4 males and 4 females). The outline of the study and the demographics for each of the 8 healthy subjects are shown (Supplementary Tables 1 and 2).
We collected, extracted, and ran female subjects in one batch and male subjects in another batch on a separate day. Thus, the Tempus and downstream PBMCs and arrays were performed in separate batches for male and female.
In addition, we assessed pairs of tissues from 7 subjects (cerebellum and PBMCs). The RNA samples from each pair were compared using Affymetrix microarray platforms. The RNA samples from 6 of these subjects’ postmortem PMBCs were also compared to the 8 healthy control subjects’ PBMCs. The demographics of the seven postmortem subjects are shown (Supplementary Table 3).
Animal Subjects
Exon array data was collected for three adult Sprague Dawley rats using matched blood and brain samples. All work was approved by the UCI Institutional Animal Care and Use Committee. The animals were anesthetized with ketamine/xylazine and 3 ml blood samples were drawn by needle from the heart and stored overnight in Tempus tubes at 4°C. Rats were transcardially perfused with approximately 200 ml 1X PBS to remove remaining blood from the brain. Brains were then removed, frozen on dry ice and stored at −80°C. RNA was extracted from whole blood using a Versagene kit (Minneapolis, MN) and from the entire left hemisphere of rat brain using Trizol. Two micrograms of RNA was labeled and run on Affymetrix Rat Exon Arrays following manufacturer's standard protocol identical to the human exon array procedure. (Please refer to the supplemental material to obtain more detailed discussions of the materials and methods used in this investigation.)
Tempus Stability Tube Protocol
Blood samples were drawn into Tempus tubes (Applied Biosystems, Foster City, CA) from each healthy control subject (three Tempus tubes containing 9.0 ml total blood). Total RNA was isolated from whole blood with the Versagene RNA Purification System protocol (Gentra Systems, Minneapolis, MN). For more details regarding this protocol, see the Supplementary Methods.
ACD Tube Protocol
At the time of blood collection in Tempus tubes blood was also collected into four ACD (acid citrate dextrose) tubes (Becton Dickinson, Franklin Lakes, NJ) from each healthy control subject (total of 25–35 ml of whole blood), mixed gently, and stored for 1 hr at room temperature (n = 8). Whole blood samples were layered onto Ficoll (Amersham Biosciences, Piscataway, NJ), and PBMCs were separated by density gradient centrifugation at 2500 rpm (Eppendorf rotor A-4-62) at room temperature for 20 min. The resulting ‘buffy’ coat at the interface was added to 5 ml phosphate buffered saline (PBS) pH 7.4 (Invitrogen, Carlsbad, CA) and cell counts were taken with a standard hemocytometer. Cells were centrifuged at 1000 rpm (Eppendorf rotor A-4-62) for 10 min at room temperature. The resulting pellets were resuspended in 1 ml Trizol and stored at −80°C to be used for RNA extractions.
EBV Transformations
Freshly isolated PBMCs from each subject were transformed with the standard Coriell Institute (Camden, NJ, USA) EBV protocol using phytohemaglutinin (Invitrogen, Carlsbad, CA) (n = 14). PBMCs were expanded in RPMI-1640 media (Invitrogen, Carlsbad, CA) supplemented with 15% fetal bovine serum (heat-inactivated) (Invitrogen, Carlsbad, CA), 2 mM L-glutamine (MP Biomedicals, Solon, OH), and 25 mg of gentamicin (Invitrogen, Carlsbad, CA). Cultures were incubated at 37 °C, 5% CO2 and grown to an approximate cell density of 1×10⁶ cells /ml in 25-cm2 flasks in a volume of 10 ml. Cultures were then transferred to 75-cm2 flasks and fed media to a final volume of 50 ml. When cells reached ~ 1×10⁶ cells/ml density the cultures were split, half of the lymphocytes were frozen down for RNA extractions (original PBMC transformation RNA) and half were fed equal volume of RPMI and left to grow to ~ 1×10⁶ cells/ml density. At that time the cultures were again split, half frozen down for RNA extractions (passage one RNA) and half were fed an equal volume of RPMI media. Lymphocytes were grown to ~ 1×10⁶ cells / ml density then frozen for RNA extractions (passage two RNA).
Postmortem PBMC isolation
Postmortem blood was collected using cardiac puncture into ACD tubes from postmortem subjects no later than 24 hours post time of death (n = 7). The whole blood samples were processed the same as the samples above from living subjects. The resulting pellets were resuspended in 1 ml Trizol and stored at −80°C to be used for RNA extractions.
Trizol Extraction from PBMC and LCL Samples
RNA was extracted from frozen PBMCs (n = 7) and EBV-transformed LCLs (n = 21) using the standard Trizol isolation protocol (Invitrogen, Carlsbad, CA) as previously described (Vawter et al., 2004a). (See Supplementary Methods for further detail.) The total RNA was cleaned by passing over silica-based mini-spin columns (Qiagen RNeasy PlusMini Kit, Valencia, CA) and analyzed on a 2100 Bioanalyzer (Agilent, Palo Alto, CA) for quantification of 28S and 18S ribosomal RNA peaks and RIN numbers.
Trizol Extraction from Brain Samples
All cerebellar samples were taken from the lateral aspect of one cerebellar hemisphere and included lateral portions of the middle lobe, containing lateral parts of the superior and inferior semilunar lobules. The cerebellar samples were microdissected to remove all but a thin ribbon of underlying white matter and the predominant gray matter sample was used for RNA extractions. RNA was extracted in TRIzol reagent using the above manufacturer's protocol. Total RNA was purified using a Qiagen RNeasy Mini Kit (Qiagen, Valencia, CA, USA) and 2 µg of RNA was used for each rat exon array.
Oligonucleotide Microarrays
The Affymetrix oligonucleotide microarray chip (Human GeneChip Exon 1.0 ST) expression profiling experiments were carried out following the manufacturer’s technical protocol (Affymetrix, Santa Clara, CA). (See Supplementary Methods for more detail.) Arrays were washed, stained and scanned on the Affymetrix Fluidics Station and G7 Affymetrix high-resolution scanner using GCOS 1.3. The cel files derived from the 1.0 ST chips were analyzed with a robust multiarray condensation algorithm (RMA) (Irizarry et al., 2003). The postmortem PBMC samples were identically processed as above (n =7).
RMA expression values were subjected to a within array (subject) z-score transformation (Cheadle et al., 2003a; Cheadle et al., 2003b). The z-score transformation method (Cheadle et al., 2003a; Cheadle et al., 2003b) was previously shown to be highly robust in detecting differential gene expression in a transcript spike-in experiment. The z-score normalized data was used to evaluate whether cell preparations if normalized on a chip basis would change the results. After application of the z-score transformation, the genes that passed Bonferroni cut-off were nearly identical, > 97% overlap between z-score transformed data and RMA normalized data. The data shown in this paper focuses on the results using RMA normalized data. The quality control of each exon array was evaluated by using ExACT (Affymetrix software) for all cel files. The Affymetrix Human 1.0 ST Exon Arrays used for the eight control subjects for five preparations yielded a total of 38 arrays because a single subject’s passaged cell lines did not yield sufficient total RNA for two preparations. The same array type (Affymetrix Human 1.0 ST Exon Array) was used to compare four matched brain and PBMC pairs of samples from the same subjects. For a separate comparison of brain and lymphocytes, three postmortem donor subjects were additionally matched for brain and PBMC pairs and analyzed on the Affymetrix U133 Plus chips using previously published methods (Vawter et al., 2006b). The overlap between both platforms for the two independent brain and PBMC experiments was evaluated and reported. The same array type (Affymetrix Human 1.0 ST Exon Array) was also used to compare six PBMC samples from postmortem subjects to the eight PBMC samples from healthy controls. The gene expression results for PBMCs from living subjects and postmortem subjects were compared using the exon array.
Differential gene expression between tissues was analyzed by ANOVA with subject as a random effect and tissue type (brain vs. blood) as a fixed effect. The criteria to establish that gene expression differences were not significant for the purpose of this analysis was defined as a gene that displayed a non-significant ANOVA (P<0.05) for tissue type, a fold change within two-fold, and minimum expression above background.
Real Time Quantitative PCR
Real-time quantitative PCR (qPCR) with SybrGreen dye was used to replicate the microarray results using methods as previously described (Vawter et al., 2006a; Vawter et al., 2004a; Vawter et al., 2004b). DNA was removed from each total RNA sample extracted from Tempus tubes using TURBO DNase-Free Kit (Ambion, Austin TX) following the manufacturer’s protocol for rigorous DNase treatment. For additional detail, see the Supplementary Methods. Although each RNA sample was either DNase treated or Qiagen column purified, to further increase gene specificity one primer in each pair was ideally designed (Primer Express, ABI) to span two exons and primers were not 3’ UTR biased. The primers were tested for amplification of any residual genomic DNA contamination and primer sequences for each gene are listed in Supplementary Methods. The dissociation curves of real time PCR were monitored for primer-dimer pairings, which interfere with SybrGreen fluorescence measurements. A melting curve analysis was used for all primers on pooled cDNA, and any amplicons that showed evidence of double peaks in the qPCR dissociation curves or amplification of genomic DNA less than 35 Ct were discarded and redesigned.
Real time qPCR was conducted with an Applied Biosystems 7900 sequence detection system (ABI, Foster City, CA) according to the manufacturer's protocol for SybrGreen PCR using a 25 µl reaction volume and 5 µl of diluted cDNA template. Samples were run in duplicate and the average Ct (crossing threshold) was calculated for each sample. The delta Ct calculation was used for relative fold change and a significance level of p < 0.05 (two-tailed with unequal variance) was adopted as statistical evidence of qPCR technical validation of the microarray results. For some genes, there were no differences between the five blood preparations using microarray results and these samples were similarly tested by qPCR for no difference by t-test. For normalization of the Ct, SLC9A1, previously shown in lymphocytes to be a stable reference gene (Vawter et al., 2006b), was used in qPCR calculations and was stable between preparations. The results of all attempted qPCR validations are shown.
Alternative Splicing Analysis
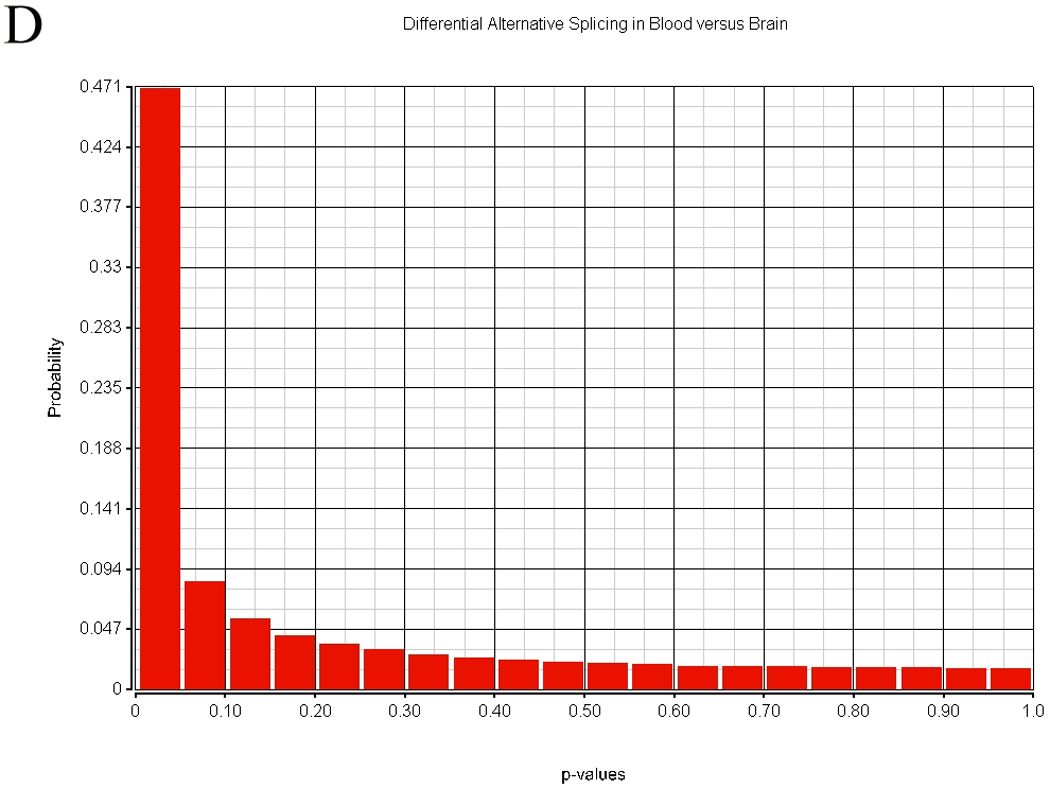
Splicing changes were detecting by computing splice indexes, which are comparisons in the signal between different regions in the gene model (Clark et al., 2002). Splice indexes were calculated using AltAnalyze, an application designed to detect tissue differences in alternative splicing events, using Affymetrix exon 1.0 ST array data. AltAnalyze calculates, organizes, filters and summarizes transcript tiling data and then calculates a splice index for Ensembl transcripts by subtracting the log2 expression of each probeset examined from the mean expression of all constitutive aligning probe sets for that array(Salomonis et al., 2009). Probesets were not filtered based on detection above background (DABG) criteria to avoid potential loss of probesets not expressed between tissues. Alternative splicing differences between tissues were defined as those with p-values less than 0.05 when comparing differences in splice index between tissues by t-test.
Quality Control
All of the quality control parameters (Supplementary Table 4) of the exon arrays for each batch (male and female) had relatively small differences in downstream PBMC RNA quality and quality control analysis receiver operator curve (exon/intron). By using the batch (gender) effect, it did not appreciably change our results as 93% of the same genes passed Bonferroni correction compared with not using the batch (gender) effect. Randomly assigning subjects to each batch irrespective of gender may be a more desirable experimental design; however, since the subjects were collected and extracted in real time within 1 hr of collection, we carried this batch effect through the experiment. The quality control values for the exon arrays all exceeded the manufacturer's recommendation of 0.8 for all exon arrays (Supplementary Table 4). The minor differences in microarray quality across batches were further assessed by reanalysis of the entire dataset with a z-transformation, which minimizes absolute signal intensity differences among chips due to hybridization signal differences while maintaining within array ordinal values. The results and conclusions of downstream statistical analysis were very similar between the z-transformed RMA data and RMA dataset. Therefore, only the RMA downstream data analysis is reported.
Results
Demographics
The quality of RNA and total white blood cell count are shown for each subject by five different preparation methods (Supplementary Table 2). In all preparations, the minimum RNA quality (RNA Integrity Number, RIN) was greater than 8.5 for all samples and the mean RIN for each preparation was greater than 9.0 which showed high quality RNA was obtained. For reference, the maximum RIN is 10.0 for the highest quality RNA which was shown for many samples, while lower numbers represent slightly degraded but acceptable RNA. One subject showed a low number of cells in passages one and two, thus this subject's data was not available for two preparations. The statistical analysis compared the five different cell preparations from the same blood draw using eight unrelated healthy controls and 38 of 40 samples.
For the postmortem comparison of cerebellum and lymphocytes, a lower overall quality of total RNA was extracted due to the postmortem interval (PMI) and agonal factor effects, which negatively influence RNA stability (Supplementary Table 3). We learned that routine transformation of postmortem PBMCs was problematic and transformation of PBMCs collected after ~20 hrs PMI is wholly unreliable as the cells are not viable (data not shown). Transformation attempts of postmortem PBMCs used the same methods in our laboratory that have resulted in successful transformations of over 800 fresh samples for genetic studies from living subjects. Thus our transformation methods work reasonably well but PBMCs were not viable when drawn after long PMIs and with current methods we could not perform the five methods of preparations reliably on postmortem samples.
Experiment #1: Transformation Induced Transcript Differences between Preparations
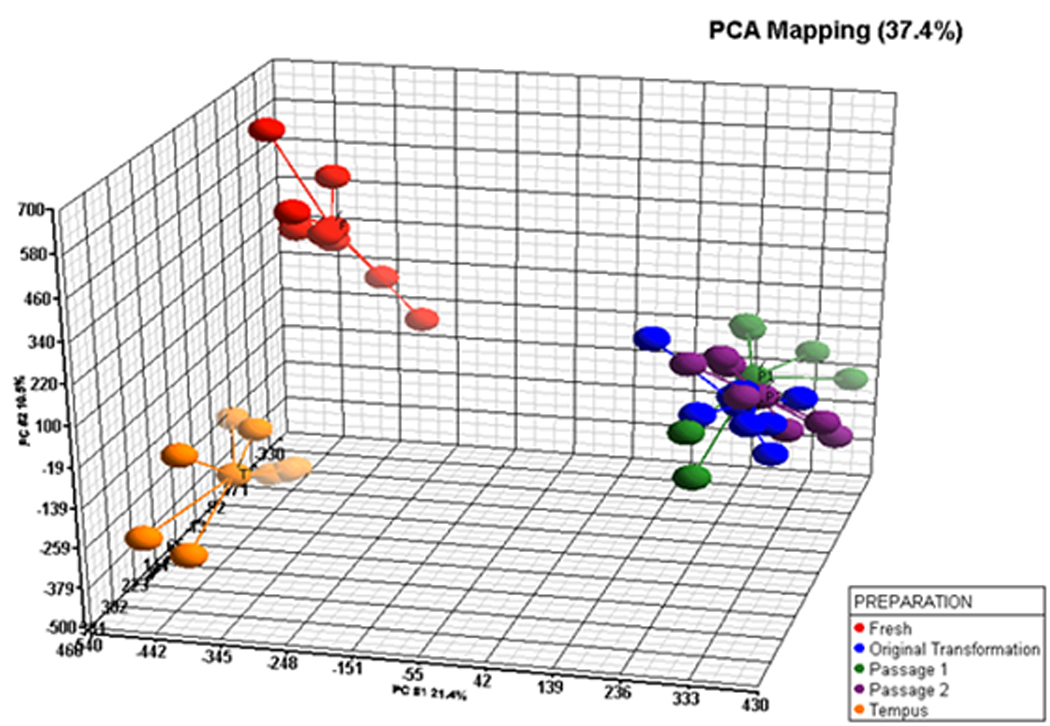
A principal component analysis (PCA) revealed no outliers within a preparation’s cluster (Figure 1). The PCA further showed that three different transformed PBMC preparation clustered together with no overlap between whole blood and Ficoll isolated PBMCs preparations. There were two chief partitions based upon EBV transformation status: partition one (pre-transformation) consisted of whole blood and Ficoll isolated PBMC preparations shown on the left side of the PCA plot (Figure 1) and partition two (post-transformation) which consisted of the initally transformed PBMC group and the two passaged LCLs (shown on the right of Figure 1). The post-transformed arrays showed high similarity on the PCA plot and some samples are superimposed on the right side of Figure 1.
Figure 1.
The ANOVA for main effect of preparations showed that 6,813 transcripts were differentially expressed between one or more preparations following Bonferroni p-value correction for testing of all transcripts. Although it could be argued that Bonferroni correction is too stringent, Bonferroni correction was used in order to identify robust, replicable gene expression differences between preparations from the same subjects due to different cell types. This corresponds to a raw uncorrected p-value < 2.79 × 10⁻⁶. Of these 6,813 transcripts there were 6,510 that showed large fold changes of a ± 1.75 fold between one or more preparations. The largest number of transcript differences in expression (4,919 RefSeq transcripts) was induced by the transformation of PBMCs compared to fresh PBMC preparation on Ficoll. Significant differences in expression of 2,060 RefSeq transcripts were found between whole blood transcriptome (Tempus tube) and Ficoll isolated PBMC preparations. This indicated that the cellular composition of PBMCs and whole blood (Tempus tube) likely caused the large difference in transcription profiling. Somewhat surprising was the observation that once cells are transformed, the passage of transformed cell lines at confluency did not induce significant differential gene expression as only two transcripts passed Bonferroni p-value correction when comparing passaged LCLs. This low number of differentially expressed transcripts suggested that the immediate transformation effects were persistent through early passage.
Genes with Stable Expression among Preparations
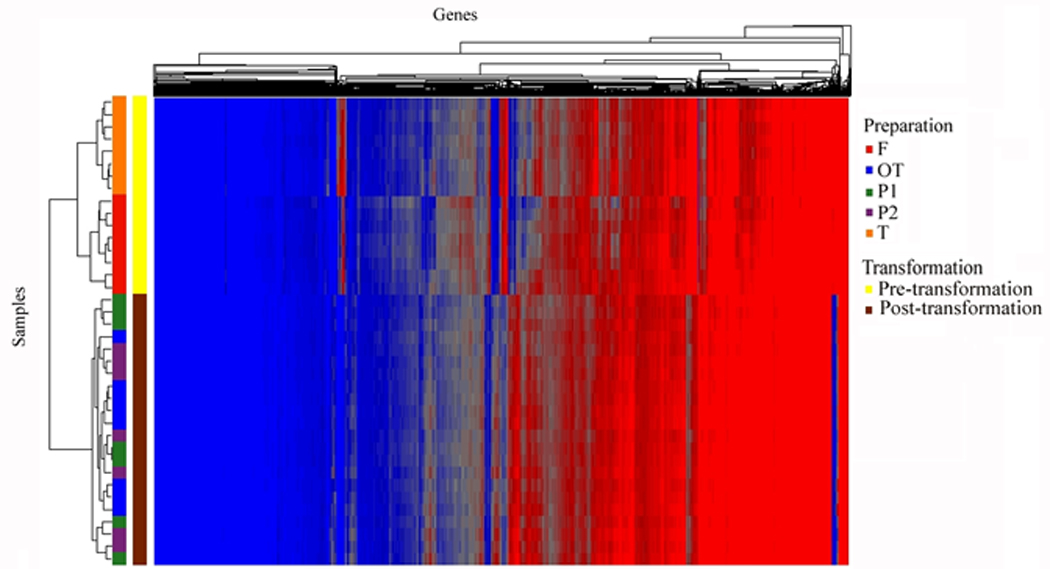
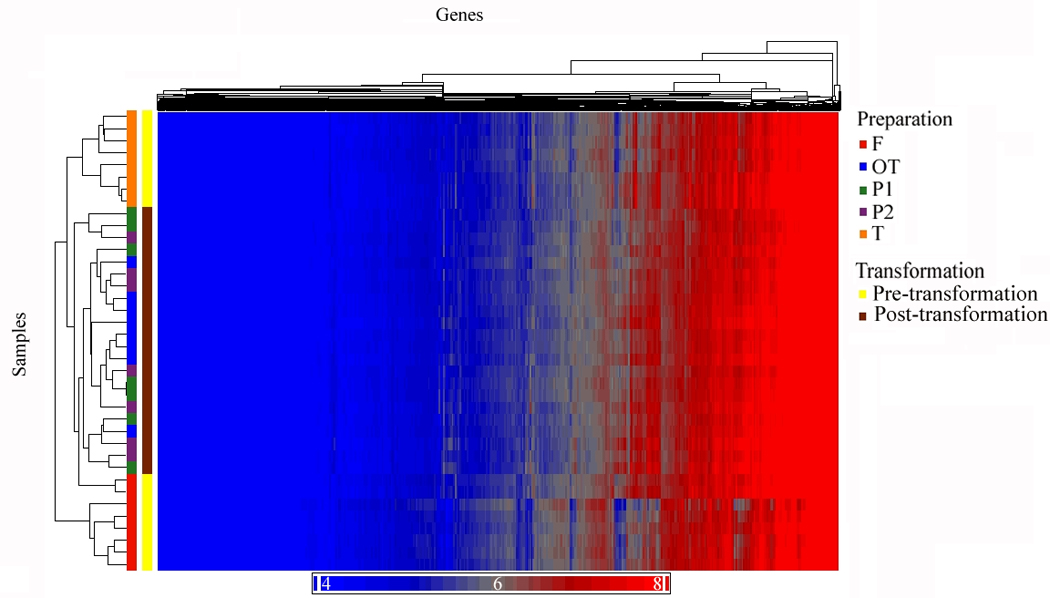
The next analysis identified genes with stable expression among all of the five preparations. A criterion for stable expression was that a transcript must not show a significant difference by ANOVA (after Bonferroni correction p-value < 0.05) for the main effect of preparation and any ten post-hoc mean comparisons of individual preparations. Further, all transcripts must show at least a minimum expression (raw expression intensity of 16) in each of the five preparations. When a single significant posthoc comparison occurred among preparations, the transcript expression was considered not stable, and was eliminated. Among the five preparations, there were 10,438 transcripts identified (that could be annotated to 8,448 unique genes) which did not show significant differences in post hoc comparisons. To determine whether genes that were not differentially expressed between preparations could be affected by an artifact due to data normalization, a different method of normalization (z-score transformation) was utilized. The results showed high agreement of 97.3% between different normalization methods. To summarize the effects of cell purification and transformation, three unsupervised hierarchical clusters were run (Figures 2A, 2B, 2C). Figure 2A shows all RefSeq transcripts (17,859), Figure 2B shows the 10,438 transcripts that were not different among preparations, and Figure 2C shows the 6,813 transcripts that were significantly different between preparation methods.
Figure 2.
As an external validity test for the effect of EBV transformation on cells, a literature search was conducted for genes that were reported to be associated with Epstein-Barr virus. Gene Cards (GeneCards URL for keyword search http://genecards.org/index.shtml) was searched for relevant genes by using the keyword Epstein-Barr virus which returned 189 gene symbols. Of these 189 gene symbols, 150 symbols matched RefSeq transcripts on the exon array annotation (Supplementary Table 5). There were 77 genes (of the 150 reported genes in the literature) that were significant following Bonferroni correction using transformation as a factor (whole blood, PBMCs) compared to post transformation (EBV transformed, passage 1, and passage 2). Individual reports (Carter et al., 2002; Nakayama et al., 2002) for the effects of EBV on gene expression represented additional sources of biological support of the validity of the current findings (Supplementary Table 6).
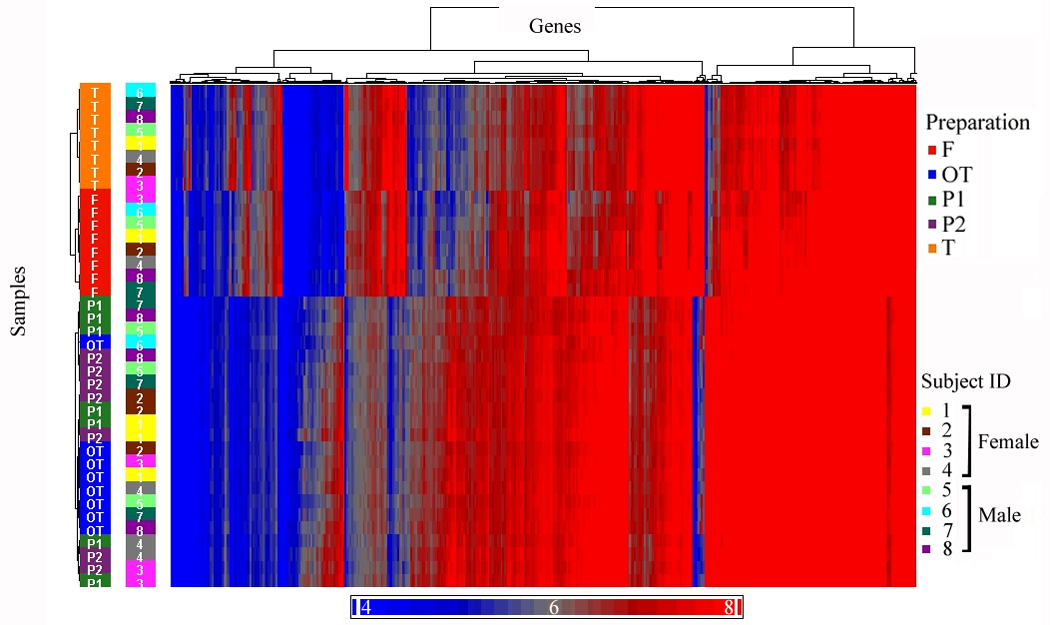
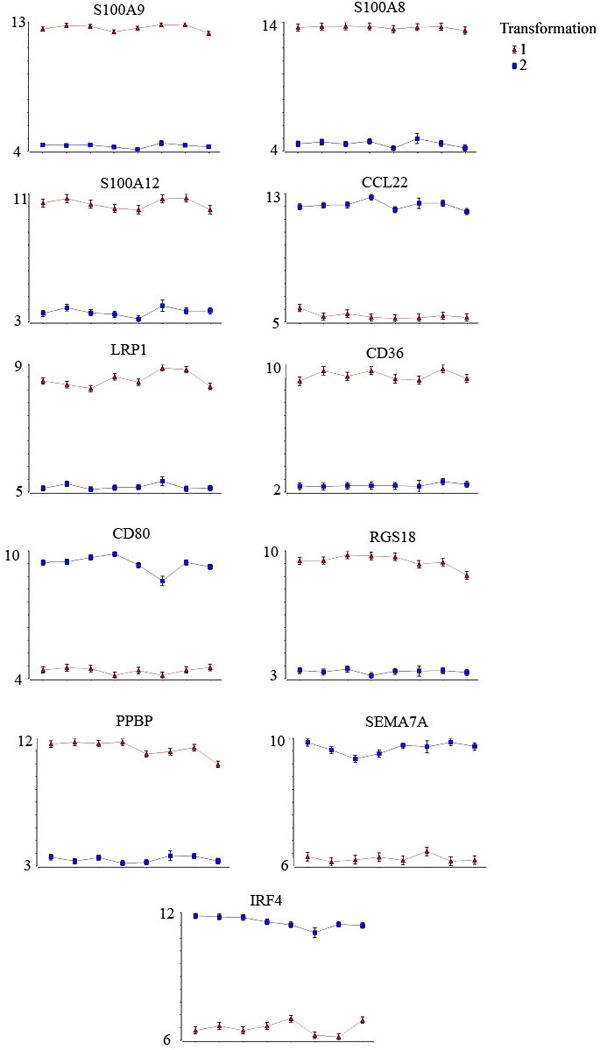
Eleven representative genes (Figure 3) displaying individual subject’s mean values pre-and post-transformation, indicate the large effect that blood purification and transformation had on expression profiles. Further, the transformation and blood purification effects were highly reproducible between subjects.
Figure 3.
Real Time Quantitative PCR Technical Validation
Ten genes that were significantly different between preparation methods and passed Bonferroni correction were selected for qPCR technical validation. The RNA from cell extracts of the five preparations were DNAse treated and primers were used only if genomic DNA did not amplify and cDNA showed positive amplification curves with one dissociation peak for melting curve analysis of the amplicon. Using these previously published stringent methods (Vawter et al., 2006a; Vawter et al., 2004a; Vawter et al., 2004b; Vawter et al., 2006c) we technically validated all 10 transcripts selected (Table 1). We have found 100% concordance between our qPCR and microarray fold change results for all attempted confirmations. All expected comparisons between preparations were significant except gene SH2D1A showed a non-significant t-test for PBMCs compared to passage 1. These ten qPCR technical validations showed the microarray results were not due to a technical artifact on the chips or data analysis and that differences persisted after normalization with a reference housekeeping gene (SLC9A1) shown to be stable (Vawter et al., 2006b).
Table 1.
Ten transcripts were selected for qPCR technical validation. The fold changes for each preparation were compared to the Ficoll prepared PBMCs, i.e. a positive fold change indicates higher expression in Ficoll prepared PBMCs, and a negative fold change indicates a decreased expression in the Ficoll prepared PBMCs. All genes tested were technically validated by qPCR, i.e. the same RNA samples were used in the microarray and qPCR experiments. There were only modest fold changes between PBMCs and whole blood (Tempus), while the major changes are seen after transformation (Transformed PBMC, Passage 1, and Passage 2). The p-value is from a paired t-test comparing the Ficoll isolated PBMCs to each group using the delta Ct method. The target Ct was normalized to the housekeeping gene SLC9A1 previously shown in lymphocytes to be highly expressed in all 5 preparations. All bolded text indicates significant differences between PBMCs and preparation method.
| Gene | Whole Blood(Tempus) | TransformedPBMC | Passage 1 | Passage 2 | ||||
|---|---|---|---|---|---|---|---|---|
| FoldChange | PValue | FoldChange | P Value | FoldChange | P Value | FoldChange | PValue | |
| PPBP | 4.0 | 6.4E-03 | 19,683 | 6.2E-06 | 10,240 | 1.4E-05 | 18,371 | 1.9E-04 |
| S100A12 | 4.3 | 6.7E-03 | 5,869 | 3.3E-05 | 3,130 | 3.4E-05 | 6,023 | 2.9E-04 |
| S100A9 | 1.8 | 6.8E-03 | 5,852 | 3.6E-08 | 5,658 | 4.6E-06 | 5,468 | 2.5E-05 |
| TGFBI | −3.3 | 4.7E-02 | 73.3 | 2.8E-04 | 107.5 | 4.7E-04 | 104.3 | 5.7E-04 |
| HCK | −1.5 | 2.2E-01 | 15.1 | 1.9E-03 | 17.8 | 1.9E-03 | 19.4 | 2.6E-03 |
| SH2D1A | 1.1 | 1.1E-01 | 3.2 | 1.8E-02 | 2.7 | 9.1E-02 | 6.7 | 1.6E-02 |
| TRAF1 | −1.8 | 8.0E-02 | −45.2 | 1.0E-04 | −44.6 | 5.4E-04 | −47.5 | 7.4E-04 |
| CD80 | −2.1 | 9.9E-02 | −743 | 1.16E-07 | −585 | 2.0E-05 | −966 | 2.0E-05 |
| IRF4 | −18.5 | 4.2E-02 | −1,670 | 1.2E-03 | −492 | 5.7E-03 | −1,070 | 6.6E-06 |
| CCL22 | −9.9 | 6.4E-04 | −3,774,508 | 3.5E-08 | −2,404,824 | 7.0E-08 | −1,504,356 | 5.1E-06 |
We observed large gene expression differences using the exon array across multiple probesets. In many genes 20 – 40 independent probesets are tiled across a single transcript and these multiple probesets instilled a confidence comparable to qPCR technical validation since the independent probesets were targeted to different exons of the transcript. Visual inspection of transcripts that passed Bonferroni correction for preparation differences showed that every probeset tiled on the array for the gene was consistently different (Supplementary Figure 1 depicts exon level information in detail across subjects by preparations to show that for individual exons, they were always different across preparations). Our qPCR validation also showed non-significant differences in gene expression between whole blood and PBMC preparations for several genes which were predicted by microarray results to be similar (HCK, SH2D1A, TRAF1, and CD80, Table 1).
Over-Representation Pathway Analysis
The effects of transformation on gene expression profiles were also examined with an over-representation analysis (Dennis et al., 2003; Hosack et al., 2003). Transcripts were selected based upon significant differences in ANOVA between transformed and non-transformed preparations (see above) and the significant genes were annotated at the DAVID database for pathway selection. The results (Supplementary Table 7 and Supplementary Figure 2) showed over-represented genes involved expected pathways such as hematopoeitic cell lineage, cytokine-cytokine receptor interaction, cell adhesion molecules, and T-cell receptor signaling pathways. In addition, a larger number of genes were found to be over-represented in cytobands at multiple genome locations, such as 1p, 1q, 2p, 2q, 7q, and 19q more than expected by chance (Table 2). For example, there were 11 transcripts dysregulated in cytoband 19q13.4 following EBV transformation (FPR1, LILRA5, LILRA1, LILRB2, LILRA2, LILRA3, LILRA4, LILRB3, LILRB1, LAIR1, LILRA6). The genome wide distribution graphs (Supplementary Figures 3, 4) showed these regional hotspots of gene dysregulation following EBV infection also corresponded to sites of reported EBV integration (Gao et al., 2006). However, without extensive sequencing of each hotspot we cannot say that the over-representation of gene dysregulation occurs due to cis – effects of viral integration.
Table 2.
Transcripts differentially expressed as a result of EBV infection. Two preparations were compared; Ficoll-extracted lymphocytes and lymphoblastic cell lines, and the genes that were over-represented for 4 different cytogenetic bands are shown.
| Cytoband | Count | % | Corrected P-value | Differentially Expressed GenesIn Cytoband |
|---|---|---|---|---|
| 19q13.4 | 11 | 1.34% | 1.31E-04 | FPR1, LILRA5, LILRA1,LILRB2, LILRA2, LILRA3,LILRA4, LILRB3, LILRB1,LAIR1, LILRA6 |
| 2p12 | 6 | 0.73% | 3.82E-04 | IGKC, CD8A, CD8B, IGKV1-5,EIF2AK3, IGKV1D-13 |
| 7q34 | 6 | 0.73% | 2.20E-02 | TRBV5-4, TRBV21-1, TRBC1,TRBV19, TRBV4-1, TRBV3-1 |
| 1p31 | 4 | 0.49% | 3.32E-02 | MSH4, ACADM, RABGGTB,AK5 |
| 1q23 | 4 | 0.49% | 3.90E-02 | FCGR2A, NDUFS2, FCER1G,FCGR3A |
| 1p31.1 | 4 | 0.49% | 3.90E-02 | IFI44, DNAJB4, CTH, IFI44L |
| 2q35 | 5 | 0.61% | 5.46E-02 | CTDSP1, DSU, SLC11A1,IL8RB, IL8RA |
Experiment #2: Transcript Expression between Brain and Lymphocytes Matched from Same Subjects Using Affymetrix U133 Plus 2.0 and Affymetrix Human Exon 1.0 ST Arrays
We compared PBMCs and brain tissues obtained from the same postmortem subjects in two experiments. In the first experiment, cerebellum tissue (n = 3) and Ficoll isolated PBMCs (n = 3) matched from the same subjects were extracted for RNA, labeled, and hybridized to individual Affymetrix U133 Plus 2.0 microarrays. The gene expression of PBMCs was compared to the same postmortem subjects’ cerebellar cortex. The criteria for similar expression in PBMC and cerebellum were that the t-test for mean difference was not significant (p < 0.05), mean expression in each tissue was greater than 16, and the mean difference between tissues was less than 0.5. Bonferroni correction may be too stringent for this experiment due to the small sample size and multiple confounds that have been shown to influence postmortem brain gene expression (i.e., PMI, agonal factors, pH).The results showed that 5,306 unique genes were expressed in both cerebellum and PBMCs at moderate to high signal levels (excluded any probe sets with signal intensity less than 16) for matched subjects’ tissues on the Affymetrix U133 Plus 2.0 microarray.
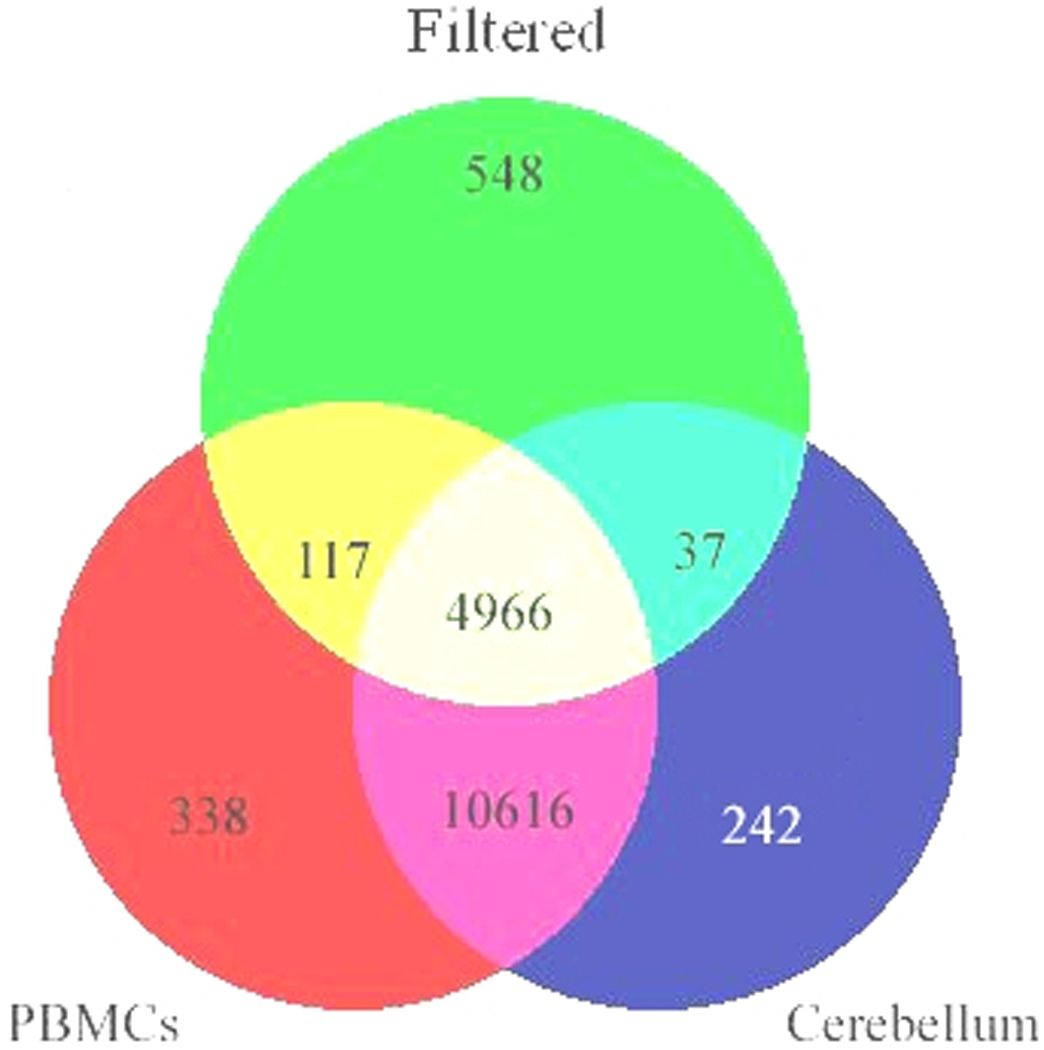
To assess the reliability of our findings, we profiled mRNA from an additional four pairs of matched brain (cerebellum) and Ficoll-extracted PBMC samples on Affymetrix Human Exon 1.0 ST arrays. On the exon array, the data was condensed into the 17,859 well-described RefSeq transcripts, and the same criteria used for the U133 Plus 2.0 chip data comparisons (above) were used. There were no differences between matched cerebellum and PBMCs from the same subjects for 4,966 unique genes (see Figure 4 and Supplementary Table 6). This result is in agreement with the U133 Plus 2.0 results. After combining the genes from both Affymetrix experiments there were 4,103 unique genes expressed in both cerebellum and PBMCs at similar expression levels. This overlap of gene expression between tissues showed a high concordance in two independent experiments, run on different platforms, labeling protocols, and independent subjects of brain and blood gene expression.
Figure 4.
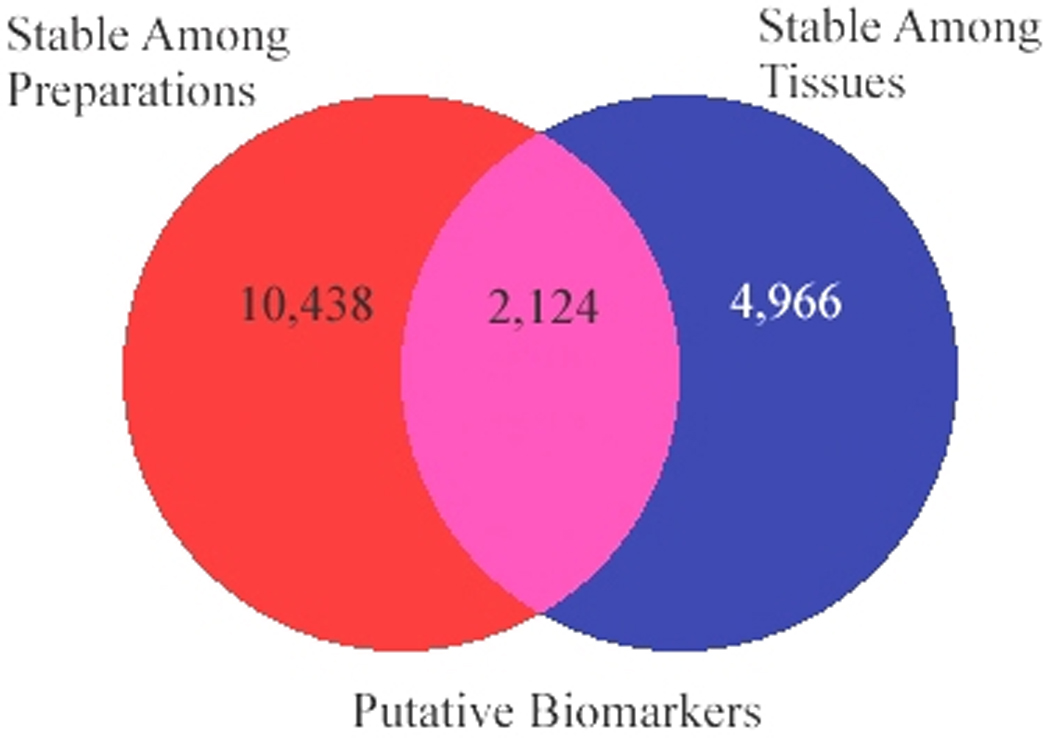
Stable Expression of Putative Biomarkers – Intersection of Two Datasets
The intersection of the two main experiments reported above (Experiments 1 and 2, Figure 5) showed 2,124 genes that were stably expressed among all five preparations and were also present in similar concentrations in both postmortem cerebellum and PBMC pairs derived by independent experiments. This list of putative biomarkers (Supplementary Table 8) was formed by the intersection of the results from both experiments (8,448 genes that were not differentially expressed in five preparations of samples) and (cerebellum and PBMCs paired samples from the same subjects where 4,103 genes overlapping from the Affymetrix exon array and U133 Plus 2.0 array are expressed at similar levels).
Figure 5.
Expression Correlation in PBMC and Brain Pairs
The similarity of expression of proposed biomarkers was next examined by correlations of PBMC and brain expressed transcripts from the same pairs. The simple Pearson correlations of brain-lymphocyte (r = 0.64; n = 17,859 transcripts) were performed on the entire transcript dataset from the Affymetrix exon array unfiltered for expression differences or signal intensity (Supplementary Figure 5A). Transcripts that were not significantly different in abundance between cerebellum and PBMCs from the Affymetrix exon array (after Bonferroni correction) showed correlation in mean transcript abundance much higher as expected (r = 0.981, n = 6,570 genes, Supplementary Figure 5B).
We queried the 4,103 co-expressed transcripts in the cerebellum and PBMC pairs from both Affymetrix platforms with a candidate gene list developed from the literature (Genetic Association Database) (Becker et al., 2004). After consulting this database of psychiatric disorders for a list of candidate genes and ranking the relevant candidate genes based upon the number of literature references, we selected the top 200 cited candidate genes to determine whether these transcripts were highly expressed in cerebellum and PBMCs from the same pairs. Of these 200 candidate genes there were 252 relevant transcripts annotated on the exon array chip. We queried whether these 252 candidate psychiatric transcripts were expressed in both cerebellum and PBMC pairs from the same subjects (4,103 genes) and found 61 (24%). Examples of these genes are NPY, PSEN1, DTNBP1, CHRNA7, and MECP2, which are implicated in various neuropsychiatric disorders (Supplementary Figure 6) and represent potential biomarkers.
Gene expression in PBMCs obtained from Postmortem versus Living Subjects
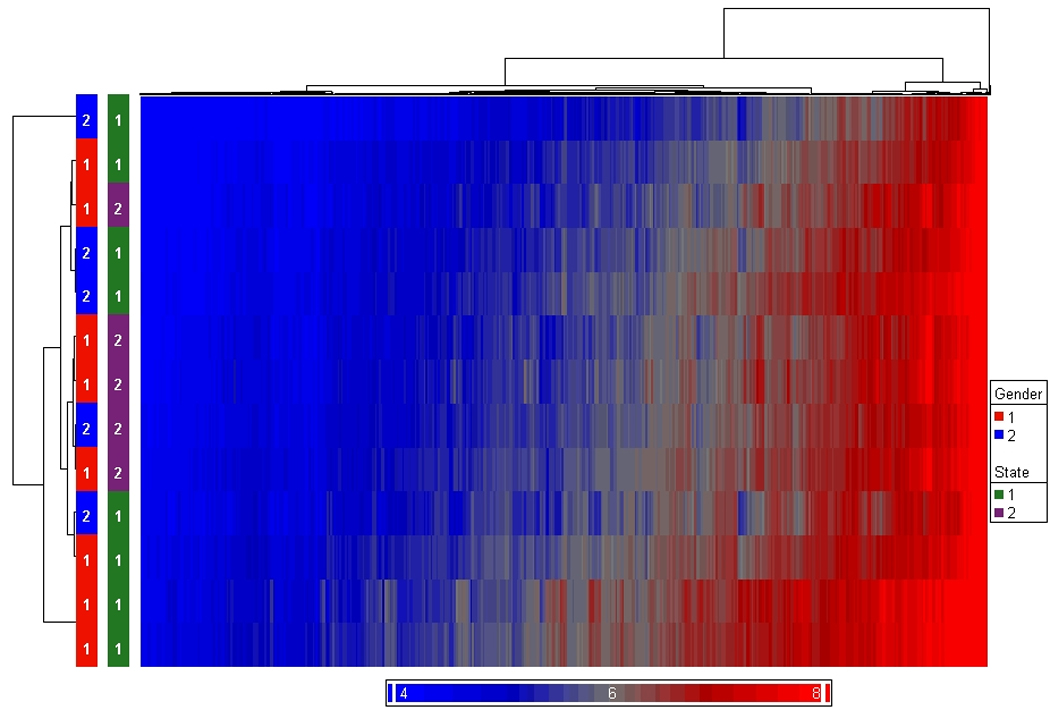
We also ran a comparison between postmortem-obtained PBMCs and living subject PBMCs on the Affymetrix exon array platform (Supplementary Tables 2, 3). Ficoll isolated PBMCs (n = 8) and postmortem PBMCs (n = 6) were extracted for RNA, labeled, and hybridized to individual Affymetrix Exon 1.0 Arrays (Supplementary Table 4). There was no attempt to match postmortem and living subjects by gender, RIN, or age as the purpose of this preliminary analysis was to determine the upper estimate of genes that were similarly expressed between cell collection conditions. Thus better matching might ensure a smaller number of genes actually pass the similarity threshold. The criteria for similar expression between postmortem and living gene expression profiles was that the uncorrected t-test for group mean differences were not significant (p < 0.05), the mean expression in each PBMC group was greater than 16, and the mean difference between PBMC collection groups was less than ± 1.4 fold. The results showed the upper estimate that 14,251 unique transcripts were expressed in approximately equal levels in both groups of PBMCs, postmortem and living subjects, at moderate to high signal levels. An unsupervised clustering showed distinct clusters of these two PBMC preparations reflecting their collection origins (Figure 6). The similarity of expression of these two groups of PBMCs performed on the filtered transcript dataset from the Affymetrix exon array was r = 0.977 (n = 14,251 transcripts). However, postmortem PBMCs were an unreliable source for EBV transformation due to low cell viability; despite the cell viability differences, the preliminary comparisons show that gene expression profiles were consistent for a large set of transcripts. With better matching and a larger N, there might actually be fewer genes that are similar between postmortem and living PBMCs.
Figure 6.
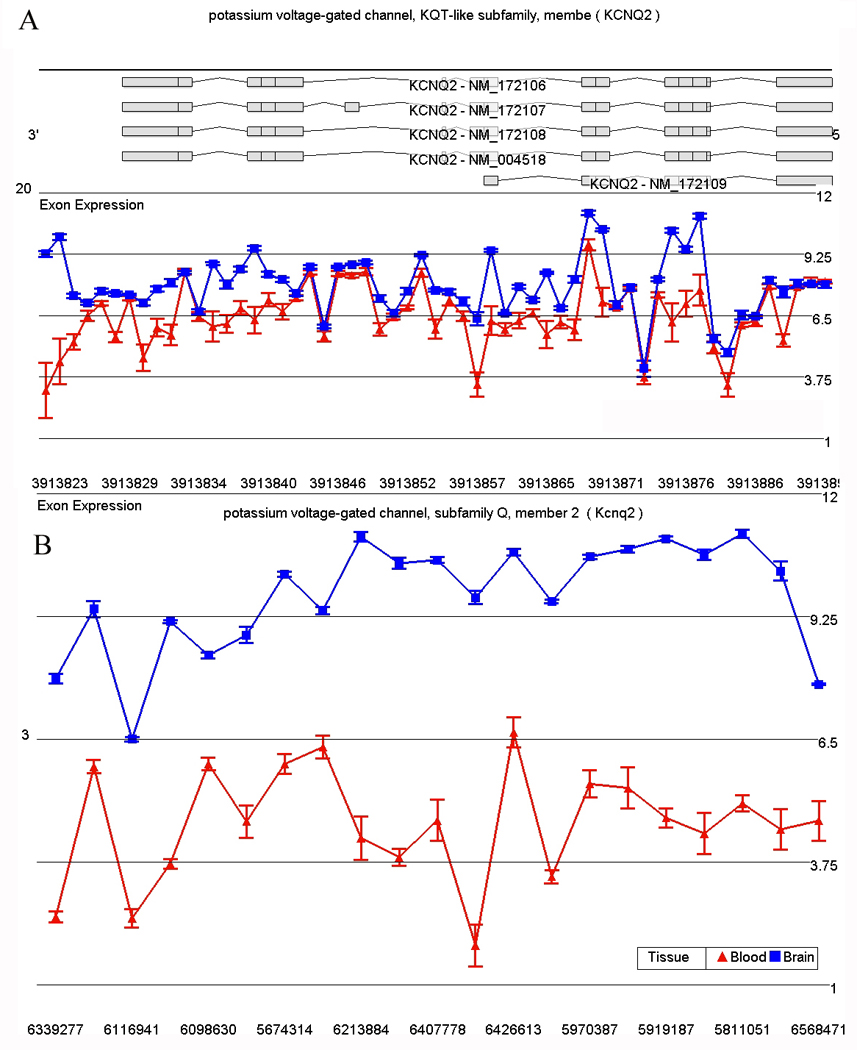
Exon Array Comparison of Rat Brain and Blood
We examined the effect of tissue type (blood and brain) on gene expression in rat and as expected found a significant effect of tissue on gene expression. There are 8,766 RefSeq annotated transcripts on the rat exon array and 6,106 transcripts were differentially expressed (p < 0.05) between blood and brain. The percentage of differentially expressed transcripts in brain and blood (69.7% rat) was comparable to the percentage of differentially expressed transcripts in humans (72.4%). After removing transcripts with more than a 2-fold difference between tissue type, and below background mean expression in either brain or blood, there were 1,680 transcripts moderately to highly expressed at comparable levels in both rat tissues. This percentage (19%) of co-expressed transcripts is similar to the 22.9% (4,103 / 17, 859) coexpression in the human array experimental data. The human data may have a larger noise associated with postmortem artifact, and thus not detect differences between tissue types as accurately as in the rat model results. Thus, the human experimental data represents an upper limit of 22.9% to the estimate of the number of transcripts that are comparably expressed between brain and blood. There was a significant difference in brain versus blood or lymphocyte expression of 1875 genes in both species (see Figure 7 for a representative gene).
Figure 7.
As an example of biomarker expression that might be useful for monitoring the effects of antipsychotic drug administration, the correlation between blood and saline-perfused brain gene expression was calculated for 44 of the 69 genes found to be influenced by olanzapine treatment (Fatemi et al., 2006) that were represented on the Rat Exon Array. For these 44 genes, the average absolute value of the correlation between blood and brain expression was 0.64. For example, a representative potential biomarker of an antipsychotic regulated gene is RGS19 (regulator of G-Protein signaling 19, Figure 8). RGS19 expression was altered by antipsychotic treatment (Fatemi et al., 2006) and has highly correlated blood and brain expression (r = 0.92) in the rat exon array. A total of 14 of the 44 genes had positive blood-brain correlations above 0.85 (Table 3). There were 21 genes overlapping from the list of 1,353 genes with comparable blood and brain gene expression and 8 of these 21 genes were from the list of 14 highly correlated genes, demonstrating that high correlations between blood and brain gene expression are common even when gene expression levels are significantly different. It is possible that genes with higher blood:brain expression correlations will be more amenable to use in biomarker research.
Figure 8.
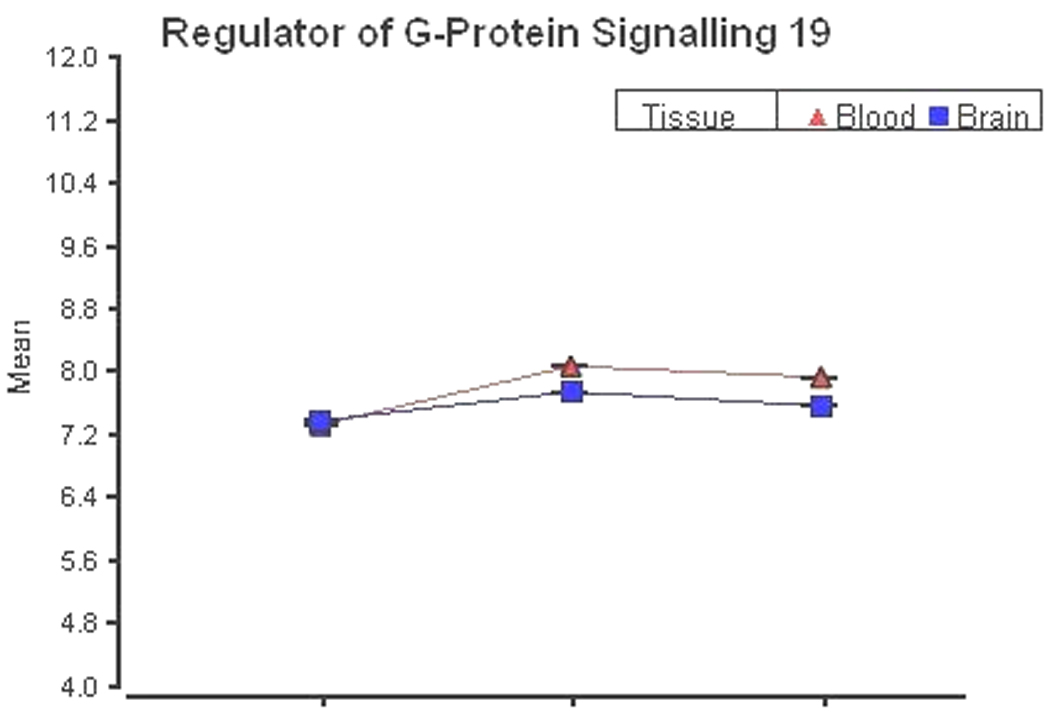
Table 3.
Candidate biomarkers of antipsychotic response showing expression change following antipsychotic treatment in rat frontal cortex (Fatemi et al., 2006). Genes listed were up- or down-regulated by olanzapine and showed positive blood and brain gene expression correlation > 0.85 in rats on Affymetrix Rat Exon Arrays.
| Transcript ID | Gene Name | GeneSymbol | PearsonCorrelation |
|---|---|---|---|
| 7058966 | insulin 2 | Ins2 | 0.84 |
| 7185567 | chymotrypsinogen B1 | Ctrb1 | 0.84 |
| 7038787 | fibroblast growth factor 3 | Fgf3 | 0.86 |
| 7122882 | dentin sialophosphoprotein | Dspp | 0.86 |
| 7226331 | angiopoietin-like 2 | Angptl2 | 0.87 |
| 7300596 | thyroid stimulating hormone receptor | Tshr | 0.87 |
| 7311776 | timeless homolog (Drosophila) | Timeless | 0.88 |
| 7222772 | carbohydrate sulfotransferase 3 | Chst3 | 0.9 |
| 7354825 | aldehyde oxidase 1 | Aox1 | 0.9 |
| 7027131 | solute carrier family 22 (extraneuronalmonoamine transporter), member 3 | Slc22a3 | 0.92 |
| 7031596 | D site of albumin promoter (albumin D-box)binding protein | Dbp | 0.92 |
| 7249028 | regulator of G-protein signaling 19 | Rgs19 | 0.94 |
| 7382913 | cysteinyl leukotriene receptor 1 | Cysltr1 | 0.94 |
| 7174110 | synaptotagmin IV | Syt4 | 0.997 |
| 7115455 | activating transcription factor 3 | Atf3 | 0.998 |
| 7149313 | protocadherin 21 | Pcdh21 | 0.999 |
Using an expression value of 7.0 as a cutoff for moderate expression, we found 13% percent of probesets to be moderately expressed in blood but not brain in the human, and 18% percent of probesets to be moderately expressed in blood but not brain in the rat, where confounding blood in brain tissue was controlled for. Thus, we do not think blood contamination of human brain tissue influenced our results significantly.
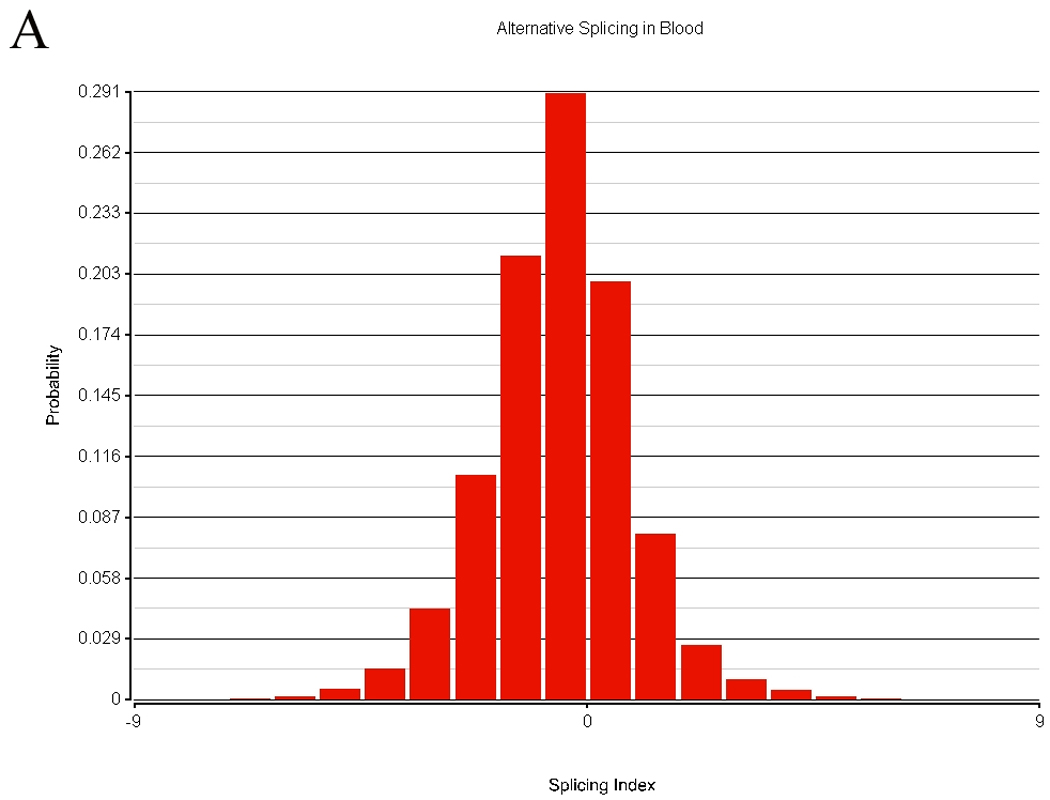
Alternative Splicing in Blood versus Brain
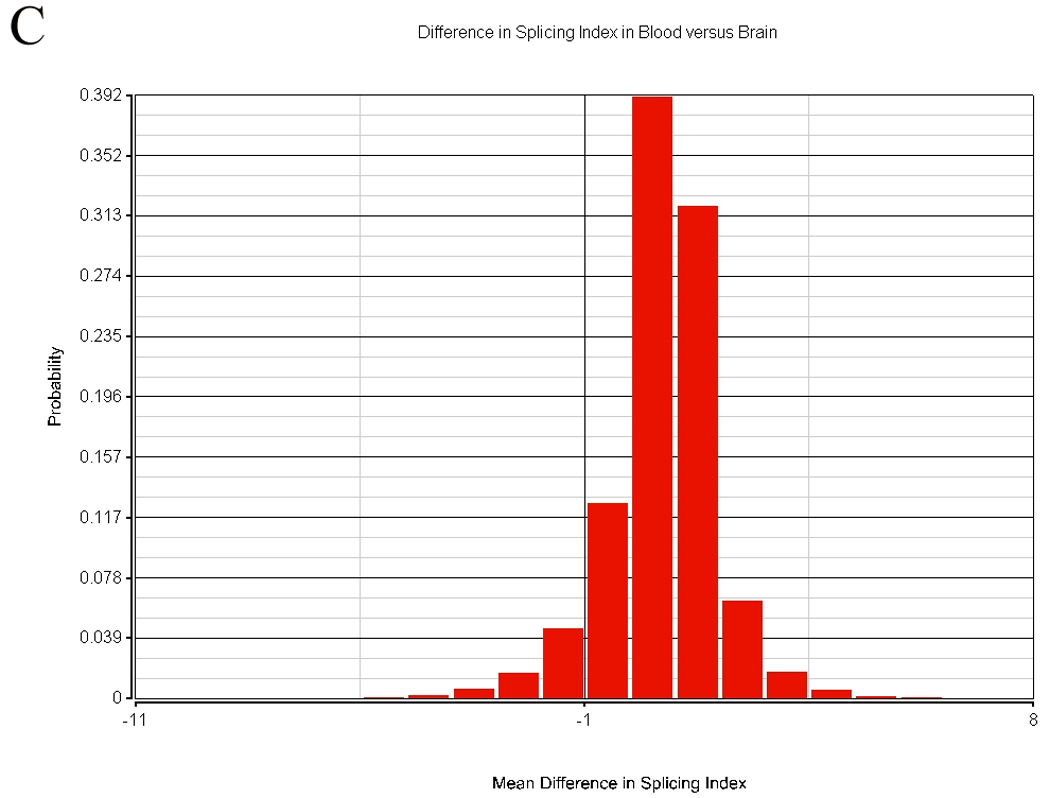
There are two or more types of measurements possible when using the exon array. The transcript can be summarized by using the central tendency of all probesets expression that is often in the range of 20 – 40 probesets for each transcript. This data has been presented in the cerebellum-PBMC comparison. A second method is to assess alternative splicing. The results of transcript similarity calculated by each method are shown in Table 4. A total of 324,000 probesets representing 14,294 genes were analyzed in terms of expression and alternative splicing in the human. Alternative splicing analyses were performed with AltAnalyze described in the methods. There were 152,004 alternatively spliced probesets (118,091 passing FDR step-up correction) between tissues based on comparison of splice indices by t-test, while there were 197,848 probeset expression differences (175,862 passing FDR step-up correction) between tissues. Approximately half of the probesets examined displayed no significant differences in alternative splicing between tissues. The distribution of alternative splicing indices in blood and brain are shown in Figure 9.
Table 4.
Transcript expression and alternative splicing in human and rat blood and brain were compared using species specific exon array results. The number of differentially expressed or spliced probesets or genes are listed. There was an increased number of differentially expressed and alternatively spliced probesets and transcripts between blood versus brain in the human compared to the rat. Due to differences in how probesets were realigned to form transcripts in Partek versus AltAnalyze, the number of total human or rat transcripts was not identical across analyses. Alternative splicing analyses detected a higher percentage of transcripts with differences in blood and brain than direct comparison of probesets or transcripts.
| SummarizedTranscripts | ProbesetExpression | AlternativeSplicing ofProbesets | AlternativeSplicing ofGenes | Overlap of Genes withDifferential Expression ofSummarized Transcriptsand Alternative Splicing inBlood and Brain | |
|---|---|---|---|---|---|
| Human/Rat | Human/Rat | Human/Rat | Human/Rat | Human/Rat | |
| Total | 17,859/8,766(100%/100%) | 324,000/108,879(100%/100%) | 324,000/108,879(100%/100%) | 14,053/6,640(100%/100%) | 12,826/4,074(100%/100%) |
| Differentialexpression orsplicing (p <0.05) in bloodand braincomparison | 13,756/2,255(77%/26%) | 197,848/59,790(61%/55%) | 152,004/42,634(47%/39%) | 12,608/4,451(90%/67%) | 7,719/1,604(56%/36%) |
| No differentialexpression orsplicing (p >0.05) in bloodand braincomparison | 4,103/6,511(23%/74%) | 126,152/49,089(39%/45%) | 171,996/66,243(53%/61%) | 1,445/2,189(10%/33%) | 399/1,014(10%/16%) |
Figure 9.
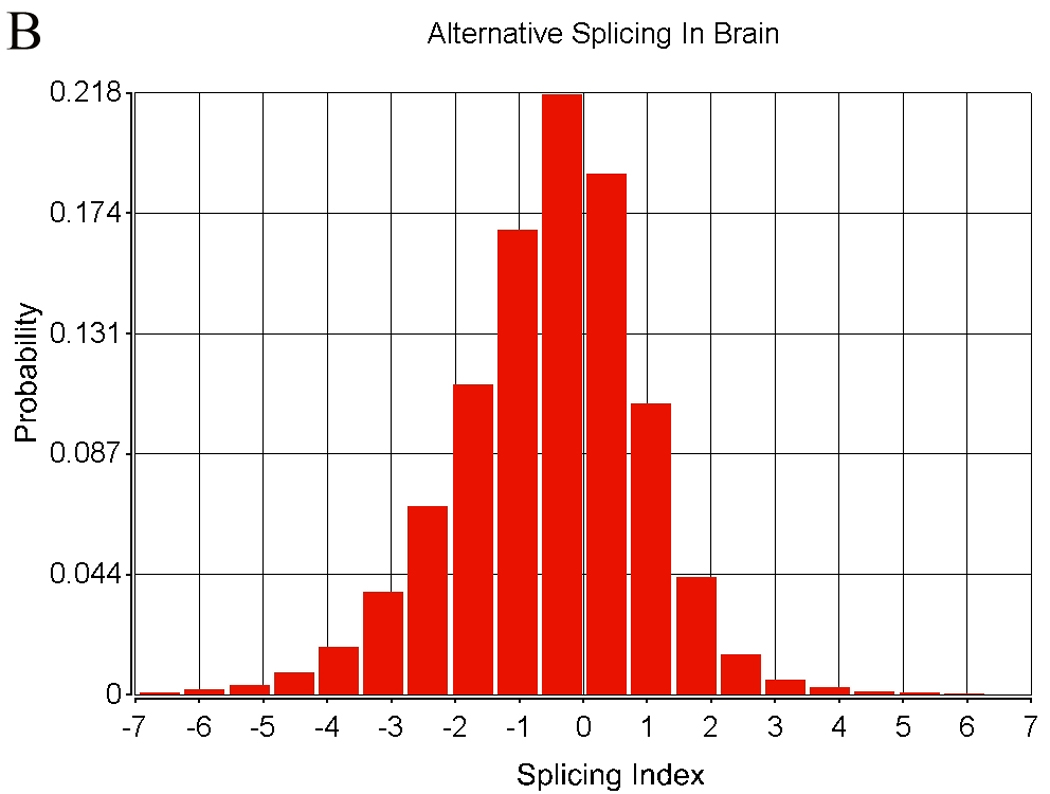
Rat brain was obtained with a short post mortem interval, and following sacrifice was immediately harvested and blood obtained at the time for exon array analysis. A total of 108,979 probesets representing 6,640 genes were analyzed in terms of expression and alternative splicing in the rat. There were 42,634 alternatively spliced probesets (24,210 probesets with p-values passing FDR step-up correction) between tissues based on comparison of splice indices by t-test, while there were 59,790 expression differences (49,816 probesets with p-values passing FDR step-up correction) between tissues. More than half of the probesets examined displayed no significant differences in alternative splicing between tissues.
Examination of alternative splicing differences on the gene level revealed a total of 12,608 differentially alternatively spliced genes in human blood versus brain. There was a total of 4,451 differentially alternatively spliced genes in rat blood versus brain. Of these 4,451 differentially alternatively spliced rat genes, 3,063 were also alternatively spliced in human, showing a high degree of overlap in alternative splicing between species. Approximately 70% of the genes alternatively spliced between rat blood and brain were also alternatively spliced between human blood and brain. There was overlap of transcript expression and alternative splicing between tissues for a large number of transcripts, as well as a moderate degree of overlap between genes displaying differential expression and differentially alternatively spliced genes in blood and brain (56% in humans, 36% in rats) (see Table 4), suggesting the utility of blood-based biomarkers for selected transcripts. There was an increased number of differentially expressed and alternatively spliced probesets and transcripts between blood versus brain in the human compared to the rat. Alternative splicing analyses detected a higher percentage of transcripts with differences in blood and brain than direct comparison of probesets or transcripts. This suggests detection of alternative spliced transcripts between tissues may be a more sensitive method for assessing between tissue differences than comparison of averaged transcript or individual probeset expression differences.
Discussion
Differences in Biomarkers between Preparations
The first aim of this study was to examine the effects of PBMC purification of whole blood and EBV transformation on gene expression in peripheral blood collected from the same subjects. Large differences in gene expression occur following transformation of PBMCs that persist in the early passage of LCLs and appear stable. This strong effect following transformation of PBMCs on gene expression profiles was expected from prior studies. The inverse of this finding is that a large number of transcripts (62 %) appear to be expressed in equivalent levels across all preparations (). For external validity, over one-half of the genes reported to be associated with EBV were significantly changed after transformation. The qPCR results provided technical validation of the microarray results for 100% of the transcripts tested.
EBV Effects
Genes that were dysregulated among healthy individuals following EBV transformation exhibited low inter-subject variability and did not appear to be randomly distributed across the genome. This may be due to multiple factors, including transformation insertion site uniformity, downstream responses of cell populations to EBV infection, enrichment of a particular cell phenotype, or averaging across multiple clonal cell lines within an individual. These reasons cannot be differentiated without studying individual clonal cell lines from each subject and resequencing multiple genes to locate insertion sites. Prior reports demonstrate the impact of EBV transformation in malignant cells compared to non-malignant cells; however, we did not locate a report comparing in the same healthy individuals the effects of EBV transformed PBMCs to non-transformed PBMCs on a genome wide basis. The effects of a viral infection such as EBV on potential 'biomarkers' need to be evaluated since a majority of adults (90%) present with latent EBV infections, for a review (Rickinson and Moss 1997). The variability of EBV infection in prior studies of psychiatric disorders is unknown (Gladkevich et al., 2004; Iwamoto et al., 2004; Nemanov et al., 1999; Schena et al., 1996; Segman et al., 2005; Takemoto et al., 2005; Wang et al., 2005; Whitney et al., 2003) except in cases where lymphoblastic cell lines were used. Thus, to compare studies of PBMC, whole blood, and LCLs the present data show that at least one-half of the transcriptome will be significantly altered and could account for lack of replication in biomarker study comparisons.
The effects of EBV transformation on gene expression implicate specific areas in the genome that induce or repress gene expression more often than chance, such as chromosomes 19q13.4, 2p12, 7q34, 1p31, 1q23, and 2q35. Previous studies (Takakuwa et al., 2005; Wuu et al., 1996) implicated several chromosomal regions as sites for integration for the Epstein Barr virus genome. The Raji cell line showed several EBV integration sites (1p, 1q, 2q, 3p, 3q, 4q, 5q, 6q, 7p, 7q, 9q, 11p, 14q and 15q) through a FISH analysis with 64% of the total signals found at 4q, 2q, 1q and 7q (Gao et al., 2006). Chromosomes 1, 2, 4, and 5 frequently carried the EBV genome while chromosomes X and Y had no viral integration in 12 immortalized LCLs (Lestou et al., 1993). These studies support multiple over represented chromosomal regions also found in the present study on chromosomes 2p12, 7q34, 1p31-31.1, and 1q23 (Supplementary Figures 3, 4). It has been suggested that changes in copy number of genomic DNA might be expected to follow multiple passages of LCLs following EBV integration, as reported on chromosome 1p36.33 (Jeon et al., 2007). We confined our experiment to early passages although later passages might show changes in copy number.
Cell Purification
Beyond the direct effects of EBV on PBMCs, there are effects of cell type enrichment following purification and isolation of PBMCs and LCLs compared to whole blood. The differences in cell populations in whole blood, PBMCs and LCLs affect the gene expression profile comparisons. Specific changes occurring between whole blood (Tempus tubes) and Ficoll isolated PBMCs are not due to transformation, and likely represent changes in cell populations during the isolation and purification of PBMCs. The PBMCs are isolated and frozen within 2 hr of blood draw and the majority is viable during the entire process as monitored with Trypan blue exclusion of cell counts. This result agrees with prior reports that RNA populations fluctuate within hours following blood draw (Rainen et al., 2002; Thach et al., 2003). The transcriptome of whole blood drawn into Tempus tubes is immediately stabilized due to the proprietary reagents in Tempus tubes (Shou et al., 2005). PBMCs and whole blood profiles while similar in the principal component analysis have distinct profiles, and the question is raised as to which preparation might show the most relevance for biomarkers (Feezor et al., 2004). The logical answer to this question is determined by the requirements of each research project, whether it is feasible to quickly isolate and sustain PBMCs for in vitro purposes such as drug stimulation or long term culturing. On the other hand, Tempus whole blood collection preserves the transcriptome profile at the moment of blood draw, and does not require PBMC isolation. However whole blood in Tempus tubes is not viable for drug stimulation or culturing studies. Ideally, both Tempus tube collection and standard PBMC isolation would offer the greatest range of experimental options.
Postmortem Brain and PBMCs
The second part of this study compared the complete profile of gene expression in the circulating blood to brain expression using the same subjects. Three separate experiments were conducted to estimate the limit of coexpression of blood and brain transcripts. This estimate was based upon summarized transcript measures in human and rat studies. The results suggest whole blood and brain show coexpression of about 19% – 22% of the transcriptome. This estimate will be subject to revision as specific brain regions and blood cell components are assayed and compared. The hypothesis that gene expression in the blood is a probe of brain transcriptome was tested by simple overlap between expression profiles. If this hypothesis is proven to be true after more extensive testing, then it is tempting to speculate that gene expression peripheral biomarkers especially relevant to immune system transcripts could monitor disruption of brain function in some psychiatric disorders. The psychiatric conditions might be detected through analysis of transcripts differentially expressed in the blood alone. Transcripts in blood will provide information about the state of the circulating cells and reflect about 20% of transcripts expressed in brain tissues. Blood cells can be used in vitro for experimental studies of brain expressed transcripts in both health and disease.
A major finding of this study was the high correlation (0.98) of gene expression between the matched pairs of PBMCs and cerebellum in a subset (22%) of the total transcriptome (4,103 genes of 17,859 genes). A similar proportion (24%) of frequently cited candidate genes in psychiatric disorders (Becker et al., 2004) shows expression in both PBMCs and cerebellum. Expression of many psychiatric candidate genes in PBMCs agrees with published single gene reports such as DISC1 (Maeda et al., 2006; Sachs et al., 2005), GRM3 splice variants (Sartorius et al., 2006), NPY, PPP3CC (Liu et al., 2007), ATF4 and ATF5 (Kakiuchi et al., 2007), PDLIM5 (Kato et al., 2005; Numata et al., 2007), HTR2A (Fukuda et al., 2006; Padin et al., 2006), D3 receptor (Padin et al., 2006), D4 receptor (Boneberg et al., 2006), MECP2 (Balmer et al., 2002; Jarrar et al., 2003) and CHRNA7. The relevance of our findings of blood and brain transcript similarity for 19% – 22% of transcripts establishes that future studies with brain tissue and PBMCs or LCLs gene expression will contain gene expression patterns that are in common with brain expression. The present results support the feasibility to probe genes related to neural function in the peripheral blood transcriptome as other researchers have reported gene expression differences in neuropsychiatric disorders in PBMC studies (Bowden et al., 2006; Gladkevich et al., 2004; Hu et al., 2006; Numata et al., 2007; Philibert et al., 2007a; Segman et al., 2005; Takemoto et al., 2005; Tsuang et al., 2005). Further experimentation will be required to determine if co-regulation of altered blood and brain expression is found in specific disorders.
In the biomarker discovery process, it is anticipated that brain relevant genes would be expressed only in brain; therefore, a gene that is restricted to brain expression would be excluded as a biomarker because on theoretical grounds, it could not be expressed peripherally. Further, some false positives in our biomarker data exist, e.g. moderately expressed levels of a biomarker in both blood and brain could reflect a gene that is a contaminant in brain due to residual contamination with blood. We tested for these false positives by comparing matched blood and brain samples that have been perfused via the aorta with saline prior to conducting gene expression analysis. The findings from the animal study suggest that contamination of human brain tissue by blood did not influence the results significantly.
Postmortem and Living PBMCs
The preliminary results show that postmortem PBMCs are not useful for transformation studies (data not shown); however, postmortem PBMCs were similar to the gene expression profile of PBMCs collected from living subjects. We compared a list of frequently cited candidate genes in psychiatric disorders (Becker et al., 2004) and found that in the top 400 cited candidate genes, a reasonable proportion (53 %) show gene expression in both living and postmortem collected PBMCs.
Alternative Splicing
In the human and rat exon arrays there were approximately equal percentages of transcripts that showed differential alternative splicing between brain and blood. This differential alternative splicing was found for one-half of the probesets represented on each species’ array indicating that the alternative splicing index between blood and brain remained non-significant for one-half of the probesets. Of the 4,033 genes alternatively spliced in rat brain versus blood, approximately 70% of these were also shown to be alternatively spliced in human brain versus blood. Based upon the blood alternative splicing index, it may be a useful predictor of brain alternatively spliced transcripts for approximately half of the genes in the human transcriptome.
Conclusions
The impact of various preparation methods and viral infections will need to be detailed in future discovery experiments aimed at using peripheral gene expression as reliable biomarkers of psychiatric disorders. It will be important to further determine if the peripheral transcriptome shown in this study also is found in other brain regions. Peripheral biomarkers might reflect viral and bacterial infections, adaptations due to molecular signaling, and cellular interchange (extravasion) between the blood-brain compartments. The peripheral gene expression profile might be indirectly associated with a neural disease signature, or participate in a common pathway alteration, or be part of the complex psychoneuroimmune feedback circuitries. The small number of summarized transcripts estimated at 19 – 22% that are expressed at similar levels in both brain and peripheral blood could represent a pool of genes useful as biomarkers, while the larger pool of transcripts that showed differential alternative splicing indices are also of interest. The alternative splicing index appeared to be significant in 90% of the transcriptome which is consistent with recent report. Peripheral blood cells can be used for in vitro and in vivo experiments of brain relevant transcripts, and the differences and similarities in the two tissues' transcriptome will be of interest for experiments involving epigenetic, genetic, and environmental measures.
Supplementary Material
Supp Figure s1a
Supp Table s1-s8
Supp Table s5
Supp Table s8
Supplementary Data
Supp Figure s1b
Supp Figure s1c
Supp Figure s1d
Supp Figure s2
Supp Figure s3
Supp Figure s4
Supp Figure s5
Supp Figure s6
Acknowledgements
We acknowledge Jacque Berndt and the investigators and medical examiners at the Orange County Coroner’s Office for procurement of brain tissue. We also appreciate the contributions of Dr. Preston Cartagena, Kathleen Burke and Claudia in processing blood and brain samples. F. Warren Lovell, M.D, performed a neuropathological evaluation of the postmortem brains. We thank Nathan Salomonis for technical assistance with AltAnalyze. The procurement of brain samples was supported by the NIMH Conte Center Grant P50 MH60398 and the Pritzker Family Philanthropic Fund. This investigation was supported by Public Health Service research grant M01 RR00827 from the National Center for Research Resource, Biomarker research grant MH 024370 from the National Institute of Mental Health (MPV), and the William Lion Penzner Foundation (Department of Psychiatry).
Footnotes
Conflict of Interest Statement: No authors on this paper have a conflict of interest to declare.
Contributor Information
Brandi Rollins, Department of Psychiatry and Human Behavior, School of Medicine, University of California, Irvine, 92697-4260 USA.
Maureen V. Martin, Department of Psychiatry and Human Behavior, School of Medicine, University of California, Irvine, 92697-4260 USA.
Ling Morgan, Department of Psychiatry and Human Behavior, School of Medicine, University of California, Irvine, 92697-4260 USA.
Marquis P. Vawter, Department of Psychiatry and Human Behavior, School of Medicine, University of California, Irvine, 92697-4260 USA
References
- Atz M, Walsh D, Cartagena P, Li J, Evans S, Choudary P, Overman K, Stein R, Tomita H, Potkin S, et al. Methodological considerations for gene expression profiling of human brain. J Neurosci Methods. 2007;163(2):295–309. doi: 10.1016/j.jneumeth.2007.03.022. [DOI] [PMC free article] [PubMed] [Google Scholar]
- Baron CA, Liu SY, Hicks C, Gregg JP. Utilization of lymphoblastoid cell lines as a system for the molecular modeling of autism. J Autism Dev Disord. 2006;36(8):973–982. doi: 10.1007/s10803-006-0134-x. [DOI] [PubMed] [Google Scholar]
- Becker KG, Barnes KC, Bright TJ, Wang SA. The genetic association database. Nat Genet. 2004;36(5):431–432. doi: 10.1038/ng0504-431. [DOI] [PubMed] [Google Scholar]
- Boneberg EM, von Seydlitz E, Propster K, Watzl H, Rockstroh B, Illges H. D3 dopamine receptor mRNA is elevated in T cells of schizophrenic patients whereas D4 dopamine receptor mRNA is reduced in CD4+ -T cells. J Neuroimmunol. 2006;173(1–2):180–187. doi: 10.1016/j.jneuroim.2005.11.018. [DOI] [PubMed] [Google Scholar]
- Bowden NA, Weidenhofer J, Scott RJ, Schall U, Todd J, Michie PT, Tooney PA. Preliminary investigation of gene expression profiles in peripheral blood lymphocytes in schizophrenia. Schizophr Res. 2006;82(2–3):175–183. doi: 10.1016/j.schres.2005.11.012. [DOI] [PubMed] [Google Scholar]
- Carter KL, Cahir-McFarland E, Kieff E. Epstein-barr virus-induced changes in B-lymphocyte gene expression. J Virol. 2002;76(20):10427–10436. doi: 10.1128/JVI.76.20.10427-10436.2002. [DOI] [PMC free article] [PubMed] [Google Scholar]
- Catts VS, Catts SV, McGrath JJ, Feron F, McLean D, Coulson EJ, Lutze-Mann LH. Apoptosis and schizophrenia: a pilot study based on dermal fibroblast cell lines. Schizophr Res. 2006;84(1):20–28. doi: 10.1016/j.schres.2006.03.016. [DOI] [PubMed] [Google Scholar]
- Cheadle C, Cho-Chung YS, Becker KG, Vawter MP. Application of z-score transformation to Affymetrix data. Appl Bioinformatics. 2003a;2(4):209–217. [PubMed] [Google Scholar]
- Cheadle C, Vawter MP, Freed WJ, Becker KG. Analysis of microarray data using Z score transformation. J Mol Diagn. 2003b;5(2):73–81. doi: 10.1016/S1525-1578(10)60455-2. [DOI] [PMC free article] [PubMed] [Google Scholar]
- Clark TA, Sugnet CW, Ares M., Jr Genomewide analysis of mRNA processing in yeast using splicing-specific microarrays. Science. 2002;296(5569):907–910. doi: 10.1126/science.1069415. [DOI] [PubMed] [Google Scholar]
- Dennis G, Sherman B, Hosack D, Yang J, Gao W, Lane H, Lempicki R. DAVID: Database for Annotation, Visualization, and Integrated Discovery. Genome Biology. 2003;4(3) [PubMed] [Google Scholar]
- Erraji-Benchekroun L, Underwood MD, Arango V, Galfalvy H, Pavlidis P, Smyrniotopoulos P, Mann JJ, Sibille E. Molecular aging in human prefrontal cortex is selective and continuous throughout adult life. Biol Psychiatry. 2005;57(5):549–558. doi: 10.1016/j.biopsych.2004.10.034. [DOI] [PubMed] [Google Scholar]
- Fatemi SH, Reutiman TJ, Folsom TD, Bell C, Nos L, Fried P, Pearce DA, Singh S, Siderovski DP, Willard FS, et al. Chronic olanzapine treatment causes differential expression of genes in frontal cortex of rats as revealed by DNA microarray technique. Neuropsychopharmacology. 2006;31(9):1888–1899. doi: 10.1038/sj.npp.1301002. [DOI] [PubMed] [Google Scholar]
- Feezor RJ, Baker HV, Mindrinos M, Hayden D, Tannahill CL, Brownstein BH, Fay A, MacMillan S, Laramie J, Xiao W, et al. Whole blood and leukocyte RNA isolation for gene expression analyses. Physiol Genomics. 2004;19(3):247–254. doi: 10.1152/physiolgenomics.00020.2004. [DOI] [PubMed] [Google Scholar]
- Fukuda Y, Koga M, Arai M, Noguchi E, Ohtsuki T, Horiuchi Y, Ishiguro H, Niizato K, Iritani S, Itokawa M, et al. Monoallelic and unequal allelic expression of the HTR2A gene in human brain and peripheral lymphocytes. Biol Psychiatry. 2006;60(12):1331–1335. doi: 10.1016/j.biopsych.2006.06.024. [DOI] [PubMed] [Google Scholar]
- Galfalvy HC, Erraji-Benchekroun L, Smyrniotopoulos P, Pavlidis P, Ellis SP, Mann JJ, Sibille E, Arango V. Sex genes for genomic analysis in human brain: internal controls for comparison of probe level data extraction. BMC Bioinformatics. 2003;4:37. doi: 10.1186/1471-2105-4-37. [DOI] [PMC free article] [PubMed] [Google Scholar]
- Gao J, Luo X, Tang K, Li X, Li G. Epstein-Barr virus integrates frequently into chromosome 4q, 2q, 1q and 7q of Burkitt's lymphoma cell line (Raji) J Virol Methods. 2006;136(1–2):193–199. doi: 10.1016/j.jviromet.2006.05.013. [DOI] [PubMed] [Google Scholar]
- Gladkevich A, Kauffman H, Korf J. Lymphocytes as a neural probe: potential for studying psychiatric disorders. Progress in Neuro-Psychopharmacology and Biological Psychiatry. 2004;28:559–576. doi: 10.1016/j.pnpbp.2004.01.009. [DOI] [PubMed] [Google Scholar]
- Glatt SJ, Everall IP, Kremen WS, Corbeil J, Sasik R, Khanlou N, Han M, Liew CC, Tsuang MT. Comparative gene expression analysis of blood and brain provides concurrent validation of SELENBP1 up-regulation in schizophrenia. Proc Natl Acad Sci U S A. 2005;102(43):15533–15538. doi: 10.1073/pnas.0507666102. [DOI] [PMC free article] [PubMed] [Google Scholar]
- Hagenfeldt L, Venizelos N, Bjerkenstedt L, Wiesel FA. Decreased tyrosine transport in fibroblasts from schizophrenic patients. Life Sci. 1987;41(25):2749–2757. doi: 10.1016/0024-3205(87)90468-1. [DOI] [PubMed] [Google Scholar]
- Hosack DA, Dennis G, Jr, Sherman BT, Lane HC, Lempicki RA. Identifying biological themes within lists of genes with EASE. Genome Biol. 2003;4(10):R70. doi: 10.1186/gb-2003-4-10-r70. [DOI] [PMC free article] [PubMed] [Google Scholar]
- Hu VW, Frank BC, Heine S, Lee NH, Quackenbush J. Gene expression profiling of lymphoblastoid cell lines from monozygotic twins discordant in severity of autism reveals differential regulation of neurologically relevant genes. BMC Genomics. 2006;7:118. doi: 10.1186/1471-2164-7-118. [DOI] [PMC free article] [PubMed] [Google Scholar]
- Irizarry RA, Hobbs B, Collin F, Beazer-Barclay YD, Antonellis KJ, Scherf U, Speed TP. Exploration, normalization, and summaries of high density oligonucleotide array probe level data. Biostatistics. 2003;4(2):249–264. doi: 10.1093/biostatistics/4.2.249. [DOI] [PubMed] [Google Scholar]
- Iwamoto K, Kakiuchi C, Bundo M, Ikeda K, Kato T. Molecular characterization of bipolar disorder by comparing gene expression profiles of postmortem brains of major mental disorders. Mol Psychiatry. 2004;9(4):406–416. doi: 10.1038/sj.mp.4001437. [DOI] [PubMed] [Google Scholar]
- Jeon JP, Shim SM, Nam HY, Baik SY, Kim JW, Han BG. Copy number increase of 1p36.33 and mitochondrial genome amplification in Epstein-Barr virus-transformed lymphoblastoid cell lines. Cancer Genet Cytogenet. 2007;173(2):122–130. doi: 10.1016/j.cancergencyto.2006.10.010. [DOI] [PubMed] [Google Scholar]
- Kakiuchi C, Ishiwata M, Nanko S, Kunugi H, Minabe Y, Nakamura K, Mori N, Fujii K, Yamada K, Yoshikawa T, et al. Association analysis of ATF4 and ATF5, genes for interacting-proteins of DISC1, in bipolar disorder. Neurosci Lett. 2007;417(3):316–321. doi: 10.1016/j.neulet.2007.02.054. [DOI] [PubMed] [Google Scholar]
- Kato T, Iwayama Y, Kakiuchi C, Iwamoto K, Yamada K, Minabe Y, Nakamura K, Mori N, Fujii K, Nanko S, et al. Gene expression and association analyses of LIM (PDLIM5) in bipolar disorder and schizophrenia. Mol Psychiatry. 2005;10(11):1045–1055. doi: 10.1038/sj.mp.4001719. [DOI] [PubMed] [Google Scholar]
- Lestou VS, De Braekeleer M, Strehl S, Ott G, Gadner H, Ambros PF. Non-random integration of Epstein-Barr virus in lymphoblastoid cell lines. Genes Chromosomes Cancer. 1993;8(1):38–48. doi: 10.1002/gcc.2870080108. [DOI] [PubMed] [Google Scholar]
- Lipska BK, Deep-Soboslay A, Weickert CS, Hyde TM, Martin CE, Herman MM, Kleinman JE. Critical factors in gene expression in postmortem human brain: Focus on studies in schizophrenia. Biol Psychiatry. 2006;60(6):650–658. doi: 10.1016/j.biopsych.2006.06.019. [DOI] [PubMed] [Google Scholar]
- Liu YL, Fann CS, Liu CM, Chang CC, Yang WC, Hung SI, Yu SL, Hwang TJ, Hsieh MH, Liu CC, et al. More evidence supports the association of PPP3CC with schizophrenia. Mol Psychiatry. 2007;12(10):966–974. doi: 10.1038/sj.mp.4001977. [DOI] [PubMed] [Google Scholar]
- Maeda K, Nwulia E, Chang J, Balkissoon R, Ishizuka K, Chen H, Zandi P, McInnis MG, Sawa A. Differential expression of disrupted-in-schizophrenia (DISC1) in bipolar disorder. Biol Psychiatry. 2006;60(9):929–935. doi: 10.1016/j.biopsych.2006.03.032. [DOI] [PubMed] [Google Scholar]
- McCurdy RD, Feron F, Perry C, Chant DC, McLean D, Matigian N, Hayward NK, McGrath JJ, Mackay-Sim A. Cell cycle alterations in biopsied olfactory neuroepithelium in schizophrenia and bipolar I disorder using cell culture and gene expression analyses. Schizophr Res. 2006;82(2–3):163–173. doi: 10.1016/j.schres.2005.10.012. [DOI] [PubMed] [Google Scholar]
- Middleton FA, Pato CN, Gentile KL, McGann L, Brown AM, Trauzzi M, Diab H, Morley CP, Medeiros H, Macedo A, et al. Gene expression analysis of peripheral blood leukocytes from discordant sib-pairs with schizophrenia and bipolar disorder reveals points of convergence between genetic and functional genomic approaches. Am J Med Genet B Neuropsychiatr Genet. 2005;136B(1):12–25. doi: 10.1002/ajmg.b.30171. [DOI] [PubMed] [Google Scholar]
- Middleton FA, Pato MT, Gentile KL, Morley CP, Zhao X, Eisener AF, Brown A, Petryshen TL, Kirby AN, Medeiros H, et al. Genomewide linkage analysis of bipolar disorder by use of a high-density single-nucleotide-polymorphism (SNP) genotyping assay: a comparison with microsatellite marker assays and finding of significant linkage to chromosome 6q22. Am J Hum Genet. 2004;74(5):886–897. doi: 10.1086/420775. [DOI] [PMC free article] [PubMed] [Google Scholar]
- Mukherjee S, Mahadik SP, Schnur DB, Laev H, Reddy R. Abnormal growth of cultured skin fibroblasts associated with poor premorbid history in schizophrenic patients. Schizophr Res. 1994;13(3):233–237. doi: 10.1016/0920-9964(94)90047-7. [DOI] [PubMed] [Google Scholar]
- Nakayama T, Fujisawa R, Izawa D, Hieshima K, Takada K, Yoshie O. Human B cells immortalized with Epstein-Barr virus upregulate CCR6 and CCR10 and downregulate CXCR4 and CXCR5. J Virol. 2002;76(6):3072–3077. doi: 10.1128/JVI.76.6.3072-3077.2002. [DOI] [PMC free article] [PubMed] [Google Scholar]
- Nemanov L, Ebstein RP, Belmaker RH, Osher Y, Agam G. Effect of bipolar disorder on lymphocyte inositol monophosphatase mRNA levels. Int J Neuropsychopharmacol. 1999;2(1):25–29. doi: 10.1017/S1461145799001315. [DOI] [PubMed] [Google Scholar]
- Numata S, Ueno S, Iga J, Yamauchi K, Hongwei S, Hashimoto R, Takeda M, Kunugi H, Itakura M, Ohmori T. Gene expression in the peripheral leukocytes and association analysis of PDLIM5 gene in schizophrenia. Neurosci Lett. 2007;415(1):28–33. doi: 10.1016/j.neulet.2007.01.018. [DOI] [PubMed] [Google Scholar]
- Padin JF, Rodriguez MA, Dominguez E, Dopeso-Reyes IG, Buceta M, Cano E, Sotelo E, Brea J, Caruncho HJ, Isabel Cadavid M, et al. Parallel regulation by olanzapine of the patterns of expression of 5-HT2A and D3 receptors in rat central nervous system and blood cells. Neuropharmacology. 2006;51(4):923–932. doi: 10.1016/j.neuropharm.2006.06.005. [DOI] [PubMed] [Google Scholar]
- Philibert RA, Crowe R, Ryu GY, Yoon JG, Secrest D, Sandhu H, Madan A. Transcriptional profiling of lymphoblast lines from subjects with panic disorder. Am J Med Genet B Neuropsychiatr Genet. 2007a;144(5):674–682. doi: 10.1002/ajmg.b.30502. [DOI] [PubMed] [Google Scholar]
- Philibert RA, Ryu GY, Yoon JG, Sandhu H, Hollenbeck N, Gunter T, Barkhurst A, Adams W, Madan A. Transcriptional profiling of subjects from the Iowa adoption studies. Am J Med Genet B Neuropsychiatr Genet. 2007b;144B(5):683–690. doi: 10.1002/ajmg.b.30512. [DOI] [PubMed] [Google Scholar]
- Rainen L, Oelmueller U, Jurgensen S, Wyrich R, Ballas C, Schram J, Herdman C, Bankaitis-Davis D, Nicholls N, Trollinger D, et al. Stabilization of mRNA expression in whole blood samples. Clin Chem. 2002;48(11):1883–1890. [PubMed] [Google Scholar]
- Rickinson AB, Moss DJ. Human cytotoxic T lymphocyte responses to Epstein-Barr virus infection. Annu Rev Immunol. 1997;15:405–431. doi: 10.1146/annurev.immunol.15.1.405. [DOI] [PubMed] [Google Scholar]
- Sachs NA, Sawa A, Holmes SE, Ross CA, DeLisi LE, Margolis RL. A frameshift mutation in Disrupted in Schizophrenia 1 in an American family with schizophrenia and schizoaffective disorder. Mol Psychiatry. 2005;10(8):758–764. doi: 10.1038/sj.mp.4001667. [DOI] [PubMed] [Google Scholar]
- Salomonis N, Nelson B, Vranizan K, Pico AR, Hanspers K, Kuchinsky A, Ta L, Mercola M, Conklin BR. Alternative splicing in the differentiation of human embryonic stem cells into cardiac precursors. PLoS Computational Biology. 2009 doi: 10.1371/journal.pcbi.1000553. (in press) [DOI] [PMC free article] [PubMed] [Google Scholar]
- Sartorius LJ, Nagappan G, Lipska BK, Lu B, Sei Y, Ren-Patterson R, Li Z, Weinberger DR, Harrison PJ. Alternative splicing of human metabotropic glutamate receptor 3. J Neurochem. 2006;96(4):1139–1148. doi: 10.1111/j.1471-4159.2005.03609.x. [DOI] [PubMed] [Google Scholar]
- Sawa A, Wiegand GW, Cooper J, Margolis RL, Sharp AH, Lawler JF, Jr, Greenamyre JT, Snyder SH, Ross CA. Increased apoptosis of Huntington disease lymphoblasts associated with repeat length-dependent mitochondrial depolarization. Nat Med. 1999;5(10):1194–1198. doi: 10.1038/13518. [DOI] [PubMed] [Google Scholar]
- Schena M, Shalon D, Heller R, Chai A, Brown PO, Davis RW. Parallel human genome analysis: microarray-based expression monitoring of 1000 genes. Proc Natl Acad Sci U S A. 1996;93(20):10614–10619. doi: 10.1073/pnas.93.20.10614. [DOI] [PMC free article] [PubMed] [Google Scholar]
- Segman RH, Shefi N, Goltser-Dubner T, Friedman N, Kaminski N, Shalev AY. Peripheral blood mononuclear cell gene expression profiles identify emergent post-traumatic stress disorder among trauma survivors. Mol Psychiatry. 2005;10(5):500–513. doi: 10.1038/sj.mp.4001636. 425. [DOI] [PubMed] [Google Scholar]
- Shou J, Dotson C, Qian HR, Tao W, Lin C, Lawrence F, N'Cho M, Kulkarni NH, Bull CM, Gelbert LM, et al. Optimized blood cell profiling method for genomic biomarker discovery using high-density microarray. Biomarkers. 2005;10(4):310–320. doi: 10.1080/13547500500218583. [DOI] [PubMed] [Google Scholar]
- Takakuwa T, Luo WJ, Ham MF, Wada N, Aozasa K. Identification of Epstein-Barr virus integrated sites in lymphoblastoid cell line (IB4) Virus Res. 2005;108(1–2):133–138. doi: 10.1016/j.virusres.2004.08.021. [DOI] [PubMed] [Google Scholar]
- Takemoto M, Kira R, Kusuhara K, Torisu H, Sakai Y, Hara T. Gene expression profiles in peripheral blood mononuclear cells from patients with subacute sclerosing panencephalitis using oligonucleotide microarrays. J Neurovirol. 2005;11(3):299–305. doi: 10.1080/13550280590953825. [DOI] [PubMed] [Google Scholar]
- Thach DC, Lin B, Walter E, Kruzelock R, Rowley RK, Tibbetts C, Stenger DA. Assessment of two methods for handling blood in collection tubes with RNA stabilizing agent for surveillance of gene expression profiles with high density microarrays. J Immunol Methods. 2003;283(1–2):269–279. doi: 10.1016/j.jim.2003.10.004. [DOI] [PubMed] [Google Scholar]
- Tomita H, Vawter MP, Walsh DM, Evans SJ, Choudary PV, Li J, Overman KM, Atz ME, Myers RM, Jones EG, et al. Effect of agonal and postmortem factors on gene expression profile: quality control in microarray analyses of postmortem human brain. Biol Psychiatry. 2004;55(4):346–352. doi: 10.1016/j.biopsych.2003.10.013. [DOI] [PMC free article] [PubMed] [Google Scholar]
- Tosic M, Ott J, Barral S, Bovet P, Deppen P, Gheorghita F, Matthey ML, Parnas J, Preisig M, Saraga M, et al. Schizophrenia and oxidative stress: glutamate cysteine ligase modifier as a susceptibility gene. Am J Hum Genet. 2006;79(3):586–592. doi: 10.1086/507566. [DOI] [PMC free article] [PubMed] [Google Scholar]
- Tsuang MT, Nossova N, Yager T, Tsuang MM, Guo SC, Shyu KG, Glatt SJ, Liew CC. Assessing the validity of blood-based gene expression profiles for the classification of schizophrenia and bipolar disorder: a preliminary report. Am J Med Genet B Neuropsychiatr Genet. 2005;133(1):1–5. doi: 10.1002/ajmg.b.30161. [DOI] [PubMed] [Google Scholar]
- Vawter M, Atz M, Rollins B, Cooper-Casey K, Shao L, Byerly W. Genome scans and gene expression microarrays converge to identify gene regulatory loci relevant in schizophrenia. Human Genetics. 2006a;119:558–570. doi: 10.1007/s00439-006-0172-7. [DOI] [PMC free article] [PubMed] [Google Scholar]
- Vawter MP, Atz ME, Rollins BL, Cooper-Casey KM, Shao L, Byerley WF. Genome scans and gene expression microarrays converge to identify gene regulatory loci relevant in schizophrenia. Hum Genet. 2006b;119(5):558–570. doi: 10.1007/s00439-006-0172-7. [DOI] [PMC free article] [PubMed] [Google Scholar]
- Vawter MP, Basaric-Keys J, Li Y, Lester DS, Lebovics RS, Lesch KP, Kulaga H, Freed WJ, Sunderland T, Wolozin B. Human olfactory neuroepithelial cells: tyrosine phosphorylation and process extension are increased by the combination of IL-1beta, IL-6, NGF, and bFGF. Exp Neurol. 1996;142(1):179–194. doi: 10.1006/exnr.1996.0189. [DOI] [PubMed] [Google Scholar]
- Vawter MP, Evans S, Choudary P, Tomita H, Meador-Woodruff J, Molnar M, Li J, Lopez JF, Myers R, Cox D, et al. Gender-specific gene expression in post-mortem human brain: localization to sex chromosomes. Neuropsychopharmacology. 2004a;29(2):373–384. doi: 10.1038/sj.npp.1300337. [DOI] [PMC free article] [PubMed] [Google Scholar]
- Vawter MP, Shannon Weickert C, Ferran E, Matsumoto M, Overman K, Hyde TM, Weinberger DR, Bunney WE, Kleinman JE. Gene expression of metabolic enzymes and a protease inhibitor in the prefrontal cortex are decreased in schizophrenia. Neurochem Res. 2004b;29(6):1245–1255. doi: 10.1023/b:nere.0000023611.99452.47. [DOI] [PubMed] [Google Scholar]
- Vawter MP, Tomita H, Meng F, Bolstad B, Li J, Evans S, Choudary P, Atz M, Shao L, Neal C, et al. Mitochondrial-related gene expression changes are sensitive to agonal-pH state: implications for brain disorders. Mol Psychiatry. 2006c;11(7):615, 663–679. doi: 10.1038/sj.mp.4001830. [DOI] [PMC free article] [PubMed] [Google Scholar]
- Wang Z, Neuburg D, Li C, Su L, Kim JY, Chen JC, Christiani DC. Global gene expression profiling in whole-blood samples from individuals exposed to metal fumes. Environ Health Perspect. 2005;113(2):233–241. doi: 10.1289/txg.7273. [DOI] [PMC free article] [PubMed] [Google Scholar]
- Whitney AR, Diehn M, Popper SJ, Alizadeh AA, Boldrick JC, Relman DA, Brown PO. Individuality and variation in gene expression patterns in human blood. Proc Natl Acad Sci U S A. 2003;100(4):1896–1901. doi: 10.1073/pnas.252784499. [DOI] [PMC free article] [PubMed] [Google Scholar]
- Wolozin B, Lesch P, Lebovics R, Sunderland T. A.E. Bennett Research Award 1993. Olfactory neuroblasts from Alzheimer donors: studies on APP processing and cell regulation. Biol Psychiatry. 1993;34(12):824–838. doi: 10.1016/0006-3223(93)90051-e. [DOI] [PubMed] [Google Scholar]
- Wuu KD, Chen YJ, Wuu SW. Frequency and distribution of chromosomal integration sites of the Epstein-Barr virus genome. J Formos Med Assoc. 1996;95(12):911–916. [PubMed] [Google Scholar]
Associated Data
This section collects any data citations, data availability statements, or supplementary materials included in this article.
Supplementary Materials
Supp Figure s1a
Supp Table s1-s8
Supp Table s5
Supp Table s8
Supplementary Data
Supp Figure s1b
Supp Figure s1c
Supp Figure s1d
Supp Figure s2
Supp Figure s3
Supp Figure s4
Supp Figure s5
Supp Figure s6