Single-Tube Genotyping without Oligonucleotide Probes (original) (raw)
Abstract
We report the development of a self-contained (homogeneous), single-tube assay for the genotyping of single-nucleotide polymorphisms (SNPs), which does not rely on fluorescent oligonucleotide probes. The method, which we call _T_m-shift genotyping, combines allele-specific PCR with the discrimination between amplification products by their melting temperatures (_T_m). Two distinct forward primers, each of which contains a 3′-terminal base that corresponds to one of the two SNP allelic variants, are combined with a common reverse primer in a single-tube reaction. A GC-tail is attached to one of the forward allele-specific primers to increase the _T_m of the amplification product from the corresponding allele. PCR amplification, _T_m analysis, and allele determination of genomic template DNA are carried out on a fluorescence-detecting thermocycler with a dye that fluoresces when bound to dsDNA. We demonstrate the accuracy and reliability of _T_m-shift genotyping on 100 samples typed for two SNPs, and recommend it both as a simple and inexpensive diagnostic tool for genotyping medically relevant SNPs and as a high-throughput SNP genotyping method for gene mapping.
Sickle cell anemia, human hemachromatosis, and other pathologies are predominantly caused by, or closely associated with, specific single-nucleotide polymorphisms (SNPs). For clinical diagnosis of those pathologies, an optimal genotyping method would allow the allele determination of such polymorphisms as rapidly and economically as possible. In addition, there is an increasing need for automated, high-throughput means of SNP genotyping for purposes of gene mapping (Risch and Merikangas 1996). Recently, several new, homogeneous, single-tube genotyping methods have been developed that rely on fluorescent oligonucleotide probes (Lee et al. 1993; Bernard et al. 1998; Chen et al. 1998; Kostrikis et al. 1998). However, such modified oligonucleotides can be expensive and their use difficult to optimize. Here we describe a simple and inexpensive method of SNP genotyping that does not require fluorescent oligonucleotide probes and that is easy to optimize.
Our method combines allele-specific PCR (Newton et al. 1989; Sommer et al. 1989; Wu et al. 1989) and the capacity to distinguish between PCR amplification products by their melting temperatures (_T_m) (Ririe et al. 1997) (Fig. 1). Both amplification and _T_m analysis are performed on the same fluorescence-detecting thermocycler (Higuchi et al. 1993). Allele-specific PCR is dependent on the nondetected allele having a mismatch at or near the 3′ nucleotide of the primer. This reduces the efficiency of the amplification process significantly. Such allele discrimination is enhanced significantly by the Stoffel fragment of Taq DNA polymerase (Tada et al. 1993). Our single-tube assay uses two distinct forward primers, each of which contains a 3′-terminal base that corresponds to one of the two SNP allelic variants, a reverse primer that amplifies both alleles, and a fluorescent dye that can detect dsDNA product. Homozygous genomic DNA will be amplified predominantly by the primer with a matching base at the 3′ terminus, whereas heterozygous genomic DNA will be amplified by both primers.
Figure 1.

The principle of _T_m-shift genotyping. In a multiplex reaction with two allele-specific primers and a common reverse primer, genomic DNA will be amplified by either one, or both, of the forward primers depending on which SNP alleles are present. Samples homozygous for one of the alleles will be amplified with the GC-tail primer and result in a melting curve that peaks in the high end of the temperature scale. Samples homozygous for the other allele will be amplified with the short allele-specific primer and give a melting curve with a peak at a lower temperature. Heterozygous samples will be amplified with both forward primers, and the melting curves will have two peaks.
To discriminate between the amplification products, a 5′ GC-tail of 26 bases is attached to one of the allele-specific primers, and the reverse primer is positioned to keep the amplification product relatively small. Because the temperature at which primer–template duplexes dissociate depends largely on product length and GC content, the PCR product has a distinct _T_m, depending on which of the two primers is responsible for the amplification (Sheffield et al. 1989). Following PCR amplification, the reaction is slowly heated in 1°C steps to 95°C and the loss of fluorescence emitted by SYBR Green I, the fluorescence of which is enhanced when there is double-stranded DNA (dsDNA) for it to bind, is recorded for each step. Analysis of the resulting melting profiles allows a determination of which alleles have been amplified and, hence, of the corresponding genotype of the genomic template.
We demonstrate here the efficiency and reliability of our assay, which we call _T_m-shift genotyping, on two SNPs. One is a polymorphism in exon 6 of the human paraoxonase/arylesterase (PON) gene. This polymorphism is expressed as an Arg → Gln substitution at amino acid position 192 and affects levels of plasma paraoxonase activity (Adkins et al. 1993; Humbert et al. 1993). It has been associated with coronary artery disease and with vulnerability to toxic nerve agents such as the sarin used in the Tokyo subway poisoning of March of 1995 (Serrato and Marian 1995; Yamasaki et al. 1997). The other SNP (B71) is responsible for an amino acid substitution at position 71 (exon 4, Ile/Thr) of human apolipoprotein B, a gene involved in lipid metabolism and associated with coronary heart disease (Humphries and Talmud 1995). For this study 100 individual samples were genotyped for each SNP.
RESULTS
Assay Optimization
The key to optimizing this assay is to minimize nonspecific amplification, that is, both nonhomologous allele amplification when a primer amplifies template DNA despite a 3′-terminal mismatch, and the generation of the template-independent artifact, primer–dimer (Chou et al. 1992). Primer–dimer usually arises only after a large number of cycles, particularly if a PCR hot start (Chou et al. 1992) is used. An effective hot start is provided here by the use of dUTP and uracil-_n_-glycosylase (UNG) in the PCRs. Although intended as a means of controlling carryover contamination from DNA amplified previously, the use of dUTP and UNG means that nonspecific primer extensions containing dU are cleaved up until the UNG is heat inactivated (Persing and Cimino 1993). If the amount of genomic DNA used is large enough, the contribution of primer–dimer to the final PCR product should not be significant. For typing the PON locus, 40 ng of genomic DNA was sufficiently large, as was 20 ng for the B71 locus. A third source of nonspecific amplification can be genomic sequences that are very closely related to the intended target sequence. Allele-specific PCR conditions usually preclude this type of nonspecific amplification.
Allele specificity can be most affected by choice of polymerase, salt concentration, and annealing temperature during PCR. A truncated form of Taq DNA polymerase, Stoffel DNA polymerase (Lawyer et al. 1993), was used here. Stoffel fragment has been shown to enhance discrimination of 3′ primer–template mismatches (Tada et al. 1993). Taq polymerase does not discriminate well mismatches of T with G, C, or T (Kwok et al. 1990). Both the PON and B71 locus typed here require the discrimination of T:G mismatches. Stoffel polymerase is most active with minimal KCl (10 mm), although its allele selectivity can be enhanced by increasing the KCl in the range of 20–50 mm (S.Y. Chang, pers. comm.). Both PON and B71 alleles were adequately discriminated with 40 mm KCl. There is a tradeoff between allele selectivity and the ability to efficiently amplify longer PCR products. We recommend having PCR products as short as is practical. The allele-specific primers used were selected to have a _T_m of ∼60°C, as estimated by a nearest-neighbor calculation (Wetmur 1991). The reverse primer was selected to have a _T_m of >65°C. A fairly broad range of anneal-extend temperatures (55°C–60°C for PON, 58°C–62°C for B71) were found to be both allele discriminatory and provide adequate amplification efficiency; 60°C was used for both the PON and B71 locus. The number of cycles used, 37 for PON and 40 for B71, reflected somewhat the larger amount of genomic DNA used for PON; however, 40 cycles would work for both loci.
Allele specificity could be readily assessed by monitoring PCRs containing only one of the two allele-specific primers in real time (Kyger et al. 1998), starting with homozygous template. The amplification of the nonmatching template is usually delayed. A _C_t (cycles needed to surpass a threshold of fluorescence) delay of about four cycles was seen for the B71 locus and was adequate to allow typing. For the PON locus, a _C_t delay above 10 cycles was observed. Kinetic PCR analysis on no-template samples can also be used to assess the contribution of primer–dimer. For rapid optimization of anneal/extend temperature, a temperature-gradient block thermocycler, the Robocycler (Stratagene), was used. Because real-time fluorescence monitoring is not available on this thermocycler, gel analysis of the PCR products after a fixed number of cycles, determined at 60°C on the fluorescence-monitoring thermocycler, was used.
SNP Genotyping
We first tested the _T_m-shift genotyping assay for both the PON and the B71 SNPs on a few samples of known genotype. The three genotypes for each locus yielded clearly distinct melting profiles (Fig. 2). Melting curves for homozygous PON loci showed a marked change (decrease) in fluorescence either between 78°C and 85°C, with a clear maximum rate of change at 82°C or 83°C, or between 69°C and 76°C, with a maximum rate of change at 72°C or 73°C. Gel analysis showed that in the former case the template DNA had been amplified with the GC-tailed primer, and in the latter case with the short allele-specific primer. Heterozygous samples resulted in clear peaks in both temperature ranges corresponding to amplification by both primers. As expected, the GC-tailed primer was specific to the wild-type A allele (Gln/Gln at position 192), whereas the short primer was specific to the variant B allele (Arg/Arg at position 192). Melting curves for B71 were characterized by marked fluorescence change either between 82°C and 89°C, with a peak at 85°C or 86°C, or between 74°C and 81°C, with a peak at 78°C or 79°C. The former corresponded to amplification with the GC-tail primer, and a homozygous wild-type A (Thr/Thr at position 71), whereas the latter corresponded to amplification with the short allele-specific primer, and a homozygous variant type B (Ile/Ile at position 71). Heterozygous samples again yielded peaks in both temperature ranges.
Figure 2.
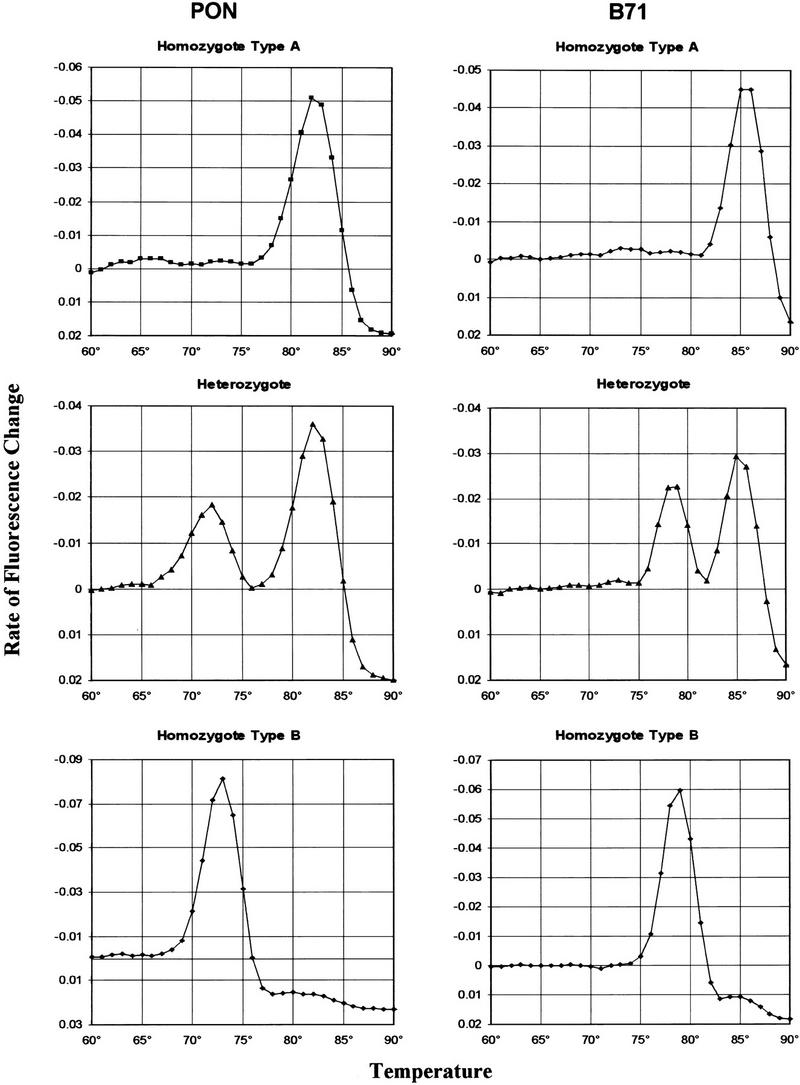
Melting profiles. Three samples, one of each genotype, for the PON and the B71 single-nucleotide polymorphisms. Genotyping and interpretation of melting curves as described in the text. The three genotypes are easily distinguished by visual inspection of the graphs.
Next, 100 samples were genotyped for each SNP locus on the basis of melting profiles. To determine the specificity of the melting profiles, we plotted each sample on a scatter graph as a function of their peak area in the two relevant temperature ranges (as detailed below). It is clear from visual inspection that all samples fall within one of three clusters (Fig. 3). The graphs demonstrate that the assay generates three unambiguous and distinct types, each corresponding to a particular genotype.
Figure 3.
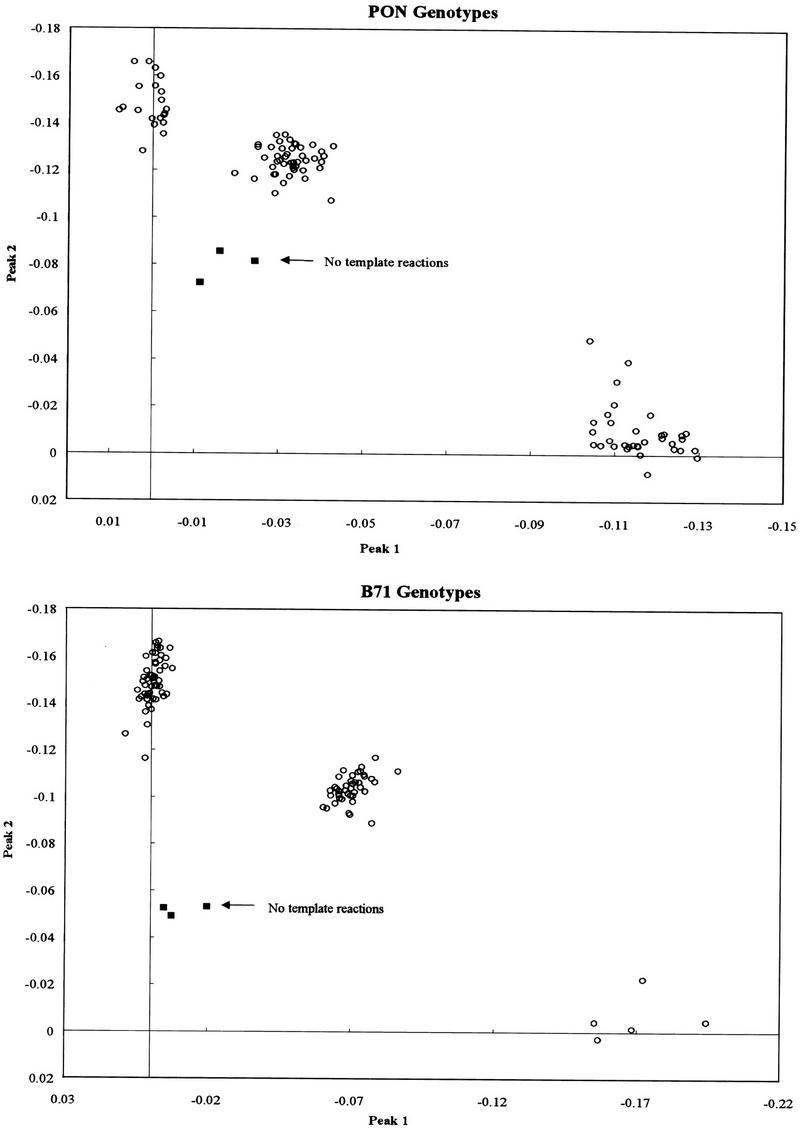
Cluster analysis. From the melting profile of each sample is plotted its peak 1 and peak 2 areas, as detailed in the text. (○) Genomic DNA containing samples; (█) no-template controls.
To further test the validity of the assay, we compared the results of _T_m-shift genotyping with the PON genotypes determined independently for 63 of the samples by probe strip hybridization (Fildes and Reynolds 1995; G. Zangenberg, pers. comm.). Our results were consistent with these (Table 1). One sample was typed differently by probe strip and _T_m-shift genotyping. Subsequent sequencing of both strands confirmed that it was a heterozygote type AB as determined by _T_m-shift genotyping. In addition, for 65 samples of European origin typed for the B71 locus, we found an allele frequency of 65.1% and 34.9%, respectively, for the C and the T alleles (data not shown). This corresponds roughly to the 70:30 ratio between the two alleles reported previously for similar populations (Duriez et al. 1987; Chatterton et al. 1995). Finally, a χ2 test on observed and expected genotype frequencies for both SNP loci did not indicate any deviation from Hardy–Weinberg equilibrium.
Table 1.
Comparison of Genotyping Results (PON) by _T_m-Shift and Probe Strip Genotyping
| Number of samples | Concordance between _T_m-shift and probe genotyping | |
|---|---|---|
| Genotype A | 31 | 31/31 |
| Genotype AB | 25 | 24/25a |
| Genotype B | 7 | 7/7 |
| Total | 63 | 62/63 |
For each SNP genotyping experiment, we included three controls that contained no template DNA. All controls clearly fell away from the clusters in the scatter graphs (Fig. 3). Although the controls resulted in melting profiles similar to melting curves generated from actual template amplifications, their melting curves often peaked at 1°C–2°C lower temperatures, probably due to the fact that the product was primer–dimer. In addition, kinetic analysis (see above) showed that reactions with no template typically entered the linear phase of PCR amplification much later and thus gave _C_t values six to seven cycles higher than actual samples (data not shown). To further screen out false heterozygote genotypes generated from reactions with no template, or a very low initial copy number of template DNA, we could thus set a limit at 30 cycles and discount reactions with higher _C_t values.
DISCUSSION
We have developed an easy and inexpensive method for determining the genotype of single-nucleotide polymorphisms that does not rely on fluorescent DNA probes and that does not require post-PCR processing. It has been tested on 100 samples for two independent SNP loci. All of the samples were successfully and unambiguously genotyped.
In contrast to systems based on fluorescent probes, _T_m-shift genotyping comes with few material requirements beyond what is necessary for standard PCR amplification. Once allele-specific primers have been designed for a particular SNP, a large number of individual samples can be processed relatively quickly. With a 40-min melting step and postamplification data analysis, one person can type 192 samples (two runs of 96) on the GeneAmp 5700 per day. Furthermore, _T_m-shift genotyping lends itself well to automation. With a robotic set up of reactions and software for automatic data analysis, genotype scoring would require only minimal human intervention.
It obviously remains to be seen whether all SNPs can be typed with the _T_m-shift genotyping assay, and whether other SNP loci require significant changes in reaction conditions. The broad range of anneal/extend temperatures over which allele specificity is maintained is encouraging. Here we found that the assay could be used for two independent SNP loci with nearly identical reaction and cycling conditions. We see no reason to believe that other loci would typically require major modifications of the experimental protocol, with perhaps one exception. Our own limited experience suggests that it may be somewhat more difficult to optimize the assay for very GC-rich target sequences. This is hardly surprising, as the assay relies precisely on the discriminatory effect of a GC-tailed primer.
Given the potential high value of SNPs in mapping disease genes (Risch and Merikangas 1996), it is possible that they will become the marker of choice for this and other genomic studies and applications. As the most common form of genetic variation, biallelic markers can be an effective tool in functional genomics and medical genetics (Kruglyak 1997). The number of known SNPs is increasing rapidly. Most recently, high-density oligonucleotide arrays, or gene chips, have been used to identify and map large collections of SNPs (Wang et al. 1998; Winzeler et al. 1998). These chips are also capable of the simultaneous genotyping of up to 500 SNPs (Wang et al. 1998) for a single sample. However, such chips are expensive and at present not readily available. _T_m-shift genotyping, by use of current instrumentation, is capable of simultaneously genotyping 96 samples at a single SNP. Future instrumentation, particularly CCD camera-based (Higuchi and Watson 1999), may increase the number of samples an order of magnitude.
In a recent review of SNP typing methods for gene mapping, Landegren et al. (1998) noted as deficiencies of allele-specific amplification methods the requirement for gel-based analysis and the lack of high-throughput instrumentations. Those deficiencies have now been corrected. _T_m-shift genotyping allows a high-throughput, easy, accurate, and inexpensive typing of significant SNPs, both for medical diagnostics and for gene mapping.
METHODS
Genomic DNA
Samples of genomic DNA were obtained from Roche Biomedical Laboratories (now LabCorp of America). They were collected from unrelated individuals residing in geographically diverse regions of the United States. Genomic DNA samples were originally obtained as detailed in Helmuth et al. (1990) and were recoded for anonymity. The majority of samples for this study were made available courtesy of Rebecca Reynolds and Gabriele Zangenberg of Roche Molecular Systems (RMS).
PCR Amplification and Product Melting
All PCR reactions were performed in 100-μl volume with 40 ng (PON) or 20 ng (B71) genomic DNA. By use of kinetic PCR analysis (Higuchi et al. 1993) and gel electrophoresis, PCR reactions and cycling conditions were optimized for amplification efficiency and to minimize nonhomologous allele amplification and primer–dimer as described below. PCR reactions were set up as follows: 0.2 μm each of three primers, 10 units of Stoffel polymerase (Perkin Elmer); 1× Stoffel buffer (Perkin Elmer, 10 mm KCl, 10 mm Tris-HCl at pH 8.3); an additional 30 mm KCl for a final concentration of 40 mm; 2 mm MgCl2; 50 μm each dATP, dCTP, and dGTP; 25 μm dTTP; 75 μm dUTP; 2 units of UNG; 0.2× SYBR Green I (Molecular Probes); 5% DMSO; and 2.5% glycerol. The PON locus was amplified with TATTTTCTTGACCCCTACTTACA (short allele-specific primer); GCGGGCAGGGCGGCGGGGGCGGGGCCTTTCTTGACCCCTACTTACG (GC-tail allele-specific primer); and CCACGCTAAACCCAAATACATCTC (reverse primer); and the B71 locus with TGAAGACCAGCCAGTGCAT (short allele-specific primer); GCGGGCAGGGCGGCGGGGGCGGGGCCGAAGACCAGCCAGTGCAC (GC-tail allele-specific primer); and CAAGGCTTTGCCCTCAGGGTT (reverse primer).
Kinetic PCR analysis was performed on a GeneAmp 5700 Sequence Detection System (PE-Applied Biosystems). A similar, CCD camera-based, fluorescence-detecting thermocycler has been described (Higuchi and Watson 1999; J.J Kang, R.M. Watson, M.E. Fischer, R. Higuchi, D.H. Gelfand, and M.J. Holland, in prep). An initial incubation step of 2 min at 50°C, to allow UNG-mediated elimination of any carryover PCR product contamination (Longo et al. 1990), and a 1-min denaturation step at 95°C, were followed by either 37 (PON) or 40 (B71) two-step amplification cycles of 20 sec denaturation at 95°C and 20 sec annealing/extension at 60°C. Melting curves were obtained from 40 subsequent temperature increments, with +1°C stepwise increments for 1 min beginning at 56°C. An updated version of the GeneAmp 5700 software allows for the generation of melting curves at a faster rate, and it has been demonstrated that total melting reaction times can be lowered to <10 min (Ririe et al. 1997). SYBR Green I binds preferentially to dsDNA with significant fluorescence enhancement on DNA binding, so that the level of fluorescence decreases as the temperature increases and DNA denatures. Fluorescence levels were measured once during each of the 40 temperature increments.
Data Analysis
Melting curves (Fig. 2) were generated by plotting for each sample the rate of change in fluorescence against the increase in temperature. To do this, measurements were first converted into relative fluorescence values by dividing fluorescence values at each temperature by initial fluorescence values (at 56°C). The use of relative fluorescence compensates for well-to-well fluorescence measurement variation (Higuchi et al. 1993). The change in fluorescence due solely to temperature change was then largely eliminated by subtracting base line values derived from a linear regression of the first nine data points (56°C–65°C) in each series. Final melting curves were generated by a Savitzky–Golay first difference and smoothing of the data (Savitzky and Golay 1964). Savitzky–Golay values were calculated for each data point by multiplying by 2 the sum of the increase in fluorescence between the immediately previous and subsequent data points and the flourescence increase between values two data points removed {2_x_[(X + 1) − (X − 1) + (X + 2) − (X − 2)]}, and dividing that product by 10 times the stepwise temperature increment (1°C).
Scatter graphs were constructed for the 100 samples genotyped for both loci (Fig. 3). _x_- and _y_-axes values for each sample were obtained by approximating the area under each of the two peaks seen in the melting curves (Fig. 2). This was done for the PON locus by setting separate baselines equal to zero from 69°C to 74°C and from 78°C to 85°C. For B71, this was from 74°C to 81°C and from 82°C to 88°C. For each sample plotted in Figure 3, x is the area for the type A temperature range, and y the area for the type B temperature range. Samples homozygous for type A were expected to fall close to the x axis, samples homozygous for type B close to the y axis, and heterozygous samples near the x = y axis (see Fig. 3).
Acknowledgments
We thank Kelly Birch, Sheng-Yung Chang, Suzanne Cheng, Carita Elfstrom, Michael Grow, Wally Laird, Rebecca Reynolds, Tom Vess, Bob Watson, and Gabriele Zangenberg of RMS for advice, assistance, and/or samples. We thank PE-Applied Biosystems for the early use of a prototype 5700 thermocycler and their support of this instrument. We thank Chris Hinkle of Axys for some early testing of allele-specific PCR conditions, and John Sninsky of RMS for suggesting we work on SNPs. We thank Tom White and Henry Erlich of RMS for helpful comments on this paper.
The publication costs of this article were defrayed in part by payment of page charges. This article must therefore be hereby marked “advertisement” in accordance with 18 USC section 1734 solely to indicate this fact.
Footnotes
E-MAIL Russell.Higuchi@Roche.com; FAX (510) 522-1285.
REFERENCES
- Adkins S, Gan KN, Mody M, La Du BN. Molecular basis for the polymorphic forms of human serum paraoxonase/alrylesterase: Glutamine or arginine at position 191, for the respective A or B allozymes. Am J Hum Genet. 1993;52:598–608. [PMC free article] [PubMed] [Google Scholar]
- Bernard PS, Lay MJ, Wittwer CT. Integrated amplification and detection of the C677T point mutation in the methylenetetrahydrofolate reductase gene by fluorescence resonance energy transfer and probe melting curves. Anal Biochem. 1998;255:101–107. doi: 10.1006/abio.1997.2427. [DOI] [PubMed] [Google Scholar]
- Chatterton JE, Schlapfer P, Bütler E, Gutierrez MM, Puppione DL, Pullinger CR, Kane JP, Curtiss LK, Schumaker VN. Identification of apolipoprotein B100 polymorphisms that affect low-density lipoprotein metabolism: Description of a new approach involving monoclonal antibodies and dynamic light scattering. Biochemistry. 1995;34:9571–9580. doi: 10.1021/bi00029a034. [DOI] [PubMed] [Google Scholar]
- Chen X, Livak KJ, Kwok P-Y. A homogeneous, ligase-mediated DNA diagnostic test. Genome Res. 1998;8:549–556. doi: 10.1101/gr.8.5.549. [DOI] [PMC free article] [PubMed] [Google Scholar]
- Chou Q, Russel M, Birch DE, Raymond J, Block W. Prevention of pre-PCR mis-priming and primer dimerization improves low-copy-number amplification. Nucleic Acids Res. 1992;20:1717–1723. doi: 10.1093/nar/20.7.1717. [DOI] [PMC free article] [PubMed] [Google Scholar]
- Duriez P, Butler R, Tikkanen MJ, Steinmetz J, Vu Dac N, Butler-Brunner E, Luyeye I, Bard JM, Puchois P, Fruchart JC. A monoclonal antibody (BIP 45) detects Ag(c,g) polymorphism of human apolipoprotein B. J Immunol Methods. 1987;102:205–212. doi: 10.1016/0022-1759(87)90078-0. [DOI] [PubMed] [Google Scholar]
- Fildes N, Reynolds R. Consistency and reproducibility of AmpliType PM results between seven laboratories: Field trial results. J Forensic Sci. 1995;40:279–286. [PubMed] [Google Scholar]
- Helmuth R, Fildes N, Blake E, Luce MC, Chimera J, Madej R, Gorodezky C, Stoneking M, Schmill N, Klitz W, et al. HLA-DQα allele and genotype frequencies in various human populations, determined by using enzymatic amplification and oligonucleotide probes. Am J Hum Genet. 1990;47:515–523. [PMC free article] [PubMed] [Google Scholar]
- Higuchi R, Watson RM. Kinetic PCR analysis using a CCD-camera and without using oligonucleotide probes. In: Innis MA, Gelfand DH, Sninsky JJ, editors. PCR methods manual. San Diego, CA: Academic Press; 1999. pp. 263–284. [Google Scholar]
- Higuchi R, Fokler C, Dollinger G, Watson R. Kinetic PCR analysis: Real-time monitoring of DNA amplification reactions. BioTechnology. 1993;11:1026–1030. doi: 10.1038/nbt0993-1026. [DOI] [PubMed] [Google Scholar]
- Humbert R, Adler DA, Disteche CM, Hassett C, Omiencinski CJ, Furlong CE. The molecular basis of the human serum paraoxonase activity polymorphism. Nat Genet. 1993;3:73–76. doi: 10.1038/ng0193-73. [DOI] [PubMed] [Google Scholar]
- Humphries SE, Talmud PJ. Hyperlipidaemia associated with genetic variation in the apolipoprotein B gene. Curr Opin Lipidol. 1995;6:215–222. doi: 10.1097/00041433-199508000-00005. [DOI] [PubMed] [Google Scholar]
- Kostrikis LG, Tyagi S, Mhlanga MM, Ho DD, Kramer FR. Spectral genotyping of human alleles. Science. 1998;279:1228–1229. doi: 10.1126/science.279.5354.1228. [DOI] [PubMed] [Google Scholar]
- Kruglyak L. The use of a genetic map of biallelic markers in linkage studies. Nat Genet. 1997;17:21–24. doi: 10.1038/ng0997-21. [DOI] [PubMed] [Google Scholar]
- Kwok S, Kellog DE, McKinney N, Spasic D, Goda L, Levenson C, Sninsky JJ. Effects of primer-template mismatches on the polymerase chain reaction: Human immunodeficiency virus type 1 model studies. Nucleic Acids Res. 1990;18:999–1005. doi: 10.1093/nar/18.4.999. [DOI] [PMC free article] [PubMed] [Google Scholar]
- Kyger EM, Krevolin MD, Powell MJ. Detection of the hereditary hemachormatosis gene mutation by real-time fluorescence polymerase chain reaction and peptide nucleic acid clamping. Anal Biochem. 1998;260:142–148. doi: 10.1006/abio.1998.2687. [DOI] [PubMed] [Google Scholar]
- Landegren U, Nilsson M, Kwok P-Y. Reading bits of genetic information: Methods for single-nucleotide polymorphism analysis. Genome Res. 1998;8:769–776. doi: 10.1101/gr.8.8.769. [DOI] [PubMed] [Google Scholar]
- Lawyer FC, Stoffel S, Saiki RK, Chang SY, Landre PA, Abramson RD, Gelfand DH. High-level expression, purification, and enzymatic characterization of full-length Thermus Aquaticus DNA polymerase and a truncated form deficient in 5′ to 3′ exonuclease. PCR Methods Applic. 1993;2:275–287. doi: 10.1101/gr.2.4.275. [DOI] [PubMed] [Google Scholar]
- Lee LG, Connell CR, Bloch W. Allelic discrimination by nick-translation PCR with fluorogenic probes. Nucleic Acids Res. 1993;21:3761–3766. doi: 10.1093/nar/21.16.3761. [DOI] [PMC free article] [PubMed] [Google Scholar]
- Longo MC, Berninger MS, Hartley JL. Use of uracil DNA glycosylase to control carry-over contamination in polymerase chain reactions. Gene. 1990;93:135–128. doi: 10.1016/0378-1119(90)90145-h. [DOI] [PubMed] [Google Scholar]
- Newton CR, Graham A, Heptinstall LE, Powell SJ, Summers C, Kalsheker N, Smith JC, Markham AF. Analysis of any point mutation in DNA. The amplification refractory mutation system (ARMS) Nucleic Acids Res. 1989;17:2503–2516. doi: 10.1093/nar/17.7.2503. [DOI] [PMC free article] [PubMed] [Google Scholar]
- Persing DH, Cimino GD. Amplification product inactivation methods. In: Persing DH, Smith TF, Tenover FC, White TJ, editors. Diagnostic molecular microbiology: Principles and applications. Washington, D.C.: American Society for Microbiology; 1993. pp. 105–121. [Google Scholar]
- Ririe KM, Rasmussen RP, Wittwer CT. Product differentiation by analysis of DNA melting curves during the polymerase chain reaction. Anal Biochem. 1997;245:154–160. doi: 10.1006/abio.1996.9916. [DOI] [PubMed] [Google Scholar]
- Risch N, Merikangas K. The future of genetic studies of complex human diseases. Science. 1996;273:1516–1517. doi: 10.1126/science.273.5281.1516. [DOI] [PubMed] [Google Scholar]
- Savitzky A, Golay MJE. Smoothing and differentiation of data by simplified least-squares procedure. Anal Chem. 1964;36:1627–1639. [Google Scholar]
- Serrato M, Marian AJ. A variant of human paraoxonase/arylesterase (HUMPONA) gene is a risk factor for coronary artery disease. J Clin Invest. 1995;96:3005–3008. doi: 10.1172/JCI118373. [DOI] [PMC free article] [PubMed] [Google Scholar]
- Sheffield VC, Cox DR, Lerman LS, Myers RM. Attachment of a 40-base-pair G + C-rich sequence (GC-clamp) to genomic DNA fragments by the polymerase chain reaction results in improved detection of single-base changes. Proc Natl Acad Sci. 1989;86:232–236. doi: 10.1073/pnas.86.1.232. [DOI] [PMC free article] [PubMed] [Google Scholar]
- Sommer SS, Cassady JD, Sobell JL, Bottema CD. A novel method for detecting point mutations or polymorphisms and its application to population screening for carriers of phenylketonuria. Mayo Clin Proc. 1989;64:1361–1372. doi: 10.1016/s0025-6196(12)65378-6. [DOI] [PubMed] [Google Scholar]
- Tada M, Omata M, Kawai S, Saisho H, Ohto M, Saiki RK, Sninsky JJ. Detection of ras gene mutations in pancreatic juice and peripheral blood of patients with pancreatic adenocarcinoma. Cancer Res. 1993;53:2472–2474. [PubMed] [Google Scholar]
- Wang DG, Fan J-B, Siao C-J, Berno A, Young P, Sapolsky R, Ghandour G, Perkins N, Winchester E, Spencer J, et al. Large-scale identification, mapping, and genotyping of Single-Nucleotide Polymorphisms in the human genome. Science. 1998;280:1077–1082. doi: 10.1126/science.280.5366.1077. [DOI] [PubMed] [Google Scholar]
- Wetmur JG. DNA probes: Applications of the principles of nucleic acid hybridization. Crit Rev Biochem Mol Biol. 1991;26:227–259. doi: 10.3109/10409239109114069. [DOI] [PubMed] [Google Scholar]
- Winzeler EA, Richards DR, Conway AR, Goldstein AL, Kalman S, McCullough MJ, McCusker JH, Stevens DA, Wodicka L, Lockhart DJ, Davis RW. Direct allelic variation scanning of the yeast genome. Science. 1998;281:1194–1197. doi: 10.1126/science.281.5380.1194. [DOI] [PubMed] [Google Scholar]
- Wu DY, Ugozolli L, Pal BK, Wallace RB. Allele-specific enzymatic amplification of beta-globin genomic DNA for diagnosis of sickle-cell anemia. Proc Natl Acad Sci. 1989;86:2757–2560. doi: 10.1073/pnas.86.8.2757. [DOI] [PMC free article] [PubMed] [Google Scholar]
- Yamasaki Y, Sakamoto K, Watada H, Kajimoto Y, Hori M. The Arg192 isoform of paraoxonase with low sarin-hydrolyzing activity is dominant in the Japanese. Hum Genet. 1997;101:67–68. doi: 10.1007/s004390050588. [DOI] [PubMed] [Google Scholar]