Loss of Heterozygosity Analysis Using Whole Genome Amplification, Cell Sorting, and Fluorescence-Based PCR (original) (raw)
Abstract
Loss of heterozygosity (LOH) is a common genetic lesion found in many human neoplasms. Extending investigation of LOH to large-scale clinical and public health science studies has proven difficult because of the small size and cellular and genetic heterogeneity of human neoplasms, in addition to the challenges associated with increasing throughput. Our approach to LOH analysis was developed using clinical biopsy samples from patients with Barrett’s esophagus (BE) and uses flow cytometric cell sorting to increase sample purity, whole genome amplification to increase sample amount, and automated fluorescent genotyping to increase sample throughput. This approach allows LOH assessment at 20 loci in DNA extracted from 1000 flow-purified cells while maintaining accurate and reproducible allele ratios compared with the standard method of using genomic DNA. This method of analysis should allow accurate, reproducible determination of allele ratios in a variety of human tumors and premalignant conditions.
Loss of heterozygosity (LOH) is a common genetic alteration found throughout the genome in most solid neoplasms (Lasko et al. 1991). Regions of nonrandom LOH can indicate the presence of genes whose loss promotes neoplastic progression (Baker et al. 1989, Fearon et al. 1990) and may have prognostic significance (Jen et al. 1994, Sidransky 1997). However, characterization of LOH in large clinical and public health science studies has proven difficult. Clinical biopsies or skinny needle aspirates typically provide small amounts of tissue, limiting the number of loci at which LOH can be assessed reliably. In addition, human biopsies are heterogeneous, containing normal as well as neoplastic cells, and neoplastic cell populations in premalignant and malignant tissues are themselves often genetically heterogeneous. Further, traditional autoradiographic LOH analysis is labor intensive, prohibiting high-throughput evaluation of a large number of loci, biopsies, and patients. Therefore, LOH analysis in clinical or public health science studies requires methodologies that can efficiently evaluate multiple loci in small tissue samples, allow purification of homogeneous cell populations, and be performed in a reliable, high-throughput fashion.
We have developed a strategy for LOH analysis using clinical samples from the premalignant condition Barrett’s esophagus (BE). This approach uses flow-cytometric cell sorting to purify neoplastic cell populations, whole genome amplification to allow a large number of loci to be evaluated in small, clinical biopsies, and semiquantitative fluorescent LOH assessment using Applied Biosystems Inc. (ABI) DNA sequencers and software. BE, a complication of chronic gastric reflux, is a hyperproliferative metaplastic epithelium having increased G1 fractions that typically develops increased 4N (G2/tetraploid) fractions and/or aneuploidy during neoplastic progression (Reid 1991; Reid et al. 1993). Increased 4N fractions or aneuploidy can be identified in >95% of patients with esophageal adenocarcinoma and develop as early events that predict subsequent progression (Reid 1991; Reid et al. 1992; Neshat et al. 1994). Ki67/DNA content multiparameter flow sorting allows purification of hyperproliferative, diploid premalignant Barrett’s epithelium, as well as cell populations having increased 4N fractions or aneuploidy (Blount et al. 1994; Barrett et al. 1995; Galipeau et al. 1996). These flow-sorting techniques increase sensitivity of LOH detection by decreasing normal cell contamination and allow LOH analyses to be performed on multiple, distinct cell populations from the same biopsy.
Most biopsy methods yield small quantities of tissue. Flow sorting and laser capture microdissection, although increasing sample purity, further reduce the amount of analyzable tissue, limiting the number of chromosomal loci that can be examined per sample. Thus, methods that increase DNA quantity are essential for comprehensive genetic analyses. Primer extension preamplification (PEP) is a PCR method of whole genome amplification utilizing random 15-mer primers (Zhang et al. 1992). PEP can amplify DNA levels 60-fold, allowing as many as 20 locus-specific LOH analyses on as few as 1000 cells with short tandem repeats (STRs) (Barrett et al. 1995). Although PEP can significantly reduce the amount of sample required per analysis, the labor-intensive nature of standard autoradiography makes large-scale studies prohibitively difficult (Barrett et al. 1996). Throughput can be increased by use of fluorescent-labeled primers to amplify STRs with detection on automated sequencing gels (Reed et al. 1994; Hampton et al. 1996). Multiple STRs can be evaluated per lane on a gel and generate quantitative data that can be collected electronically, substantially increasing throughput over conventional autoradiographic techniques.
Our results validate LOH analysis of flow-purified samples using PEP and subsequent locus-specific PCR with fluorescent-labeled primers and ABI fluorescence detection. Although this approach reduces many of the problems that have limited LOH analyses in large-scale clinical and public health science studies, precautions, discussed below, are required to ensure the accuracy and reproducibility of such evaluations. These fundamental techniques should be readily adaptable to LOH investigations of other premalignant syndromes and cancers.
RESULTS
PEP Provides Accurate and Reproducible Allele Ratios
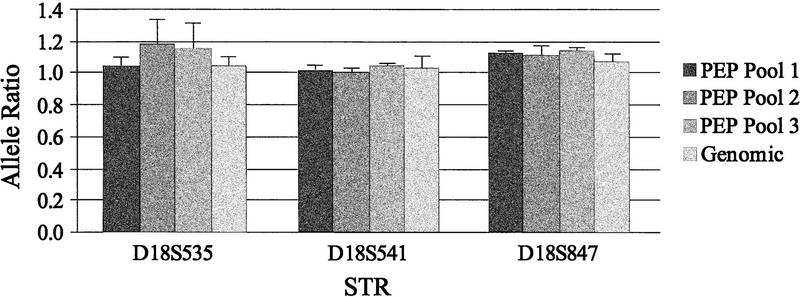
Any method of whole genome amplification that increases the number of loci that can be examined in a biopsy must accurately and reproducibly generate the allele ratios found in the original sample. We compared the accuracy and reproducibility of allele ratios obtained with locus-specific PCR from pools of PEP reactions with those obtained with genomic DNA. DNA from the equivalent of 1000 cells was used for each PEP reaction and from 3000 cells for the genomic locus-specific reactions. Nine independent PEP reactions were combined into three pools of three PEP reactions each (pools 1, 2, and 3) and samples were run in triplicate for each pool or genomic DNA. Locus-specific reactions were performed on 3 μl of PEP DNA (1/20 of a single PEP reaction) or 3 μl of genomic DNA (equivalent of 3000 cells) with fluorescent-labeled primers from chromosome 18 tetranucleotide STRs and analyzed by the ABI system. Allele ratios (peak height of the smaller allele divided by that of the larger allele) obtained after locus-specific PCR of the triplicate samples were averaged for each STR and results for three representative loci are shown in Figure 1. Overall, the allele ratios obtained from the pools differed from the genomic ratios by 4% (range 0.3%–12.3%). No differences in the number or size of alleles amplified were observed in the pooled PEP reactions compared with those in the genomic samples.
Figure 1.
Allele ratios from pooled PEP reactions are similar to those from genomic DNA. Allele ratios were obtained after locus-specific PCR with the chromosome 18 tetranucleotide STRs indicated. Locus-specific reactions were performed with DNA from the equivalent of 3000 cells (Genomic) or with DNA from three independent pools of three separate PEP reactions with an input DNA level of 1000 cells (PEP pools 1–3). All locus-specific reactions were done in triplicate, and the average allele ratio for the three reactions is shown. Error bars, s.d. of the replicates.
Reproducibility is Dependent on the Amount of Input DNA
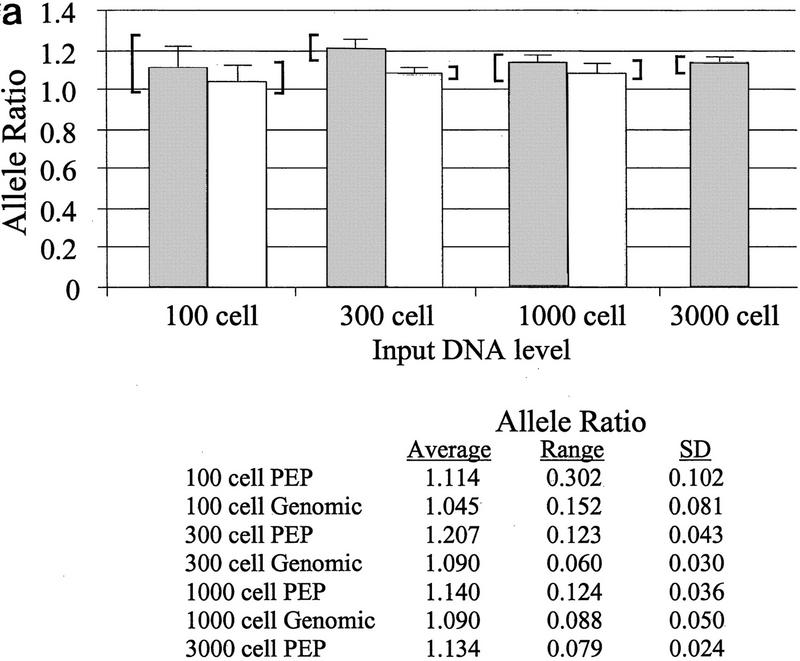
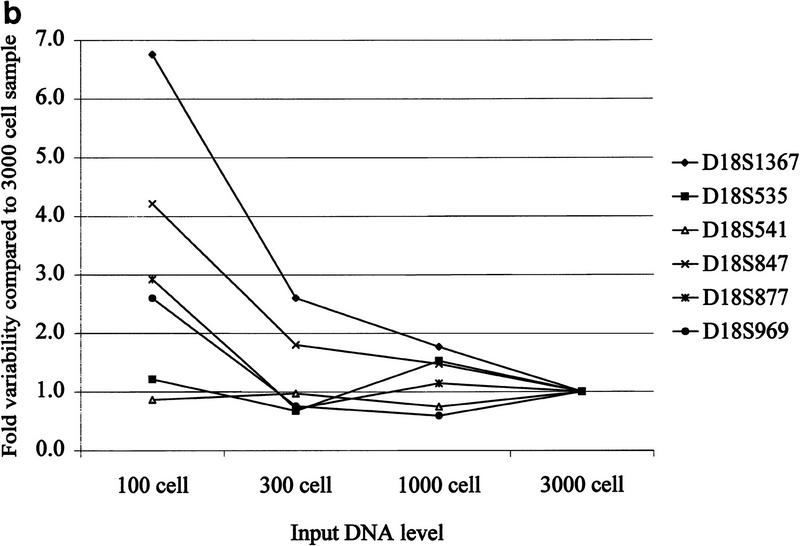
Although whole genome amplification allows at least a 20-fold reduction in the biopsy material required for LOH analyses, reducing the input DNA amount below a critical level can lead to variable allele ratios (Taberlet et al. 1996). We determined the effect of varying the amount of genomic DNA in PEP reactions on the reproducibility of subsequent locus-specific PCR. PEP reactions were performed on genomic DNA from the equivalent of 100, 300, 1000, or 3000 cells, with the same biopsy samples as in Figure 1. Because 1/20 of each PEP reaction is used for the locus-specific PCR, these DNA input levels correspond to 5, 15, 50, and 150 cells per genotype, respectively. Three PEP pools, each derived from three independent PEP reactions, were amplified for each concentration of genomic DNA. Locus-specific PCR was performed in triplicate on PEP and genomic DNA at each input DNA level, using six chromosome 18 STRs. An example is shown for the D18S847 locus (Fig. 2a). Sample variability decreased as input DNA level increased, as measured by the s.d. of the replicates and by the range between the highest and lowest allele ratios. For example, the s.d. of the pooled PEP samples was reduced more than fourfold, from 0.102 to 0.024, as the DNA level increased from 100 to 3000 cells, and the range of allele ratios was reduced from 0.302 to 0.079. Variability at different input DNA levels was compared by determining the ratio of the s.d. of the replicates at a given input level to the s.d. of the replicates at the highest input level (3000 cells). A reduction in variability as DNA input level increased was observed for multiple STRs (Fig. 2b), although some STRs showed low variability at all DNA levels. In addition, 20% of the locus-specific reactions at the 100-cell level failed to generate a PCR product, compared with <5% at higher levels. We also examined other variables that might affect reproducibility of allele ratios, including tissue of origin (Barrett’s epithelium or gatric tissue) and method of tissue acquisition (endoscopic biopsies vs. surgical specimens), but no differences were observed (T. Paulson, unpubl.).
Figure 2.
Allele ratio reproducibility depends on DNA input level. (a) Analysis of input DNA level on allele ratio variability with STR D18S847. Allele ratios represent the average of either nine locus-specific PCR reactions with pooled PEP DNA [three independently derived pools of three PEP reactions, each done in triplicate (dark shaded bars)] or of three independent locus-specific reactions using genomic DNA (light shaded bars). Amount of DNA used in each PEP or genomic locus-specific reaction is indicated on the _x_-axis. Error bars represent the s.d. of the replicates, and brackets indicate the range of allele ratios for each set of replicates. Values for the s.d. and allele ratio range are given below the graph. Volume constraints prevented the evaluation of genomic DNA at the 3000 cell level. (b) Variability vs. input DNA level into PEP reactions for multiple chromosome 18 STRs. Values indicate the ratio of the variability (s.d.) at a given input DNA level compared with the variability (s.d.) at the highest input DNA level (3000 cells).
PEP Maintains the Allele Proportions Found in Biopsy Samples
Frequently, only a subpopulation of a purified sample will have undergone LOH, resulting in partial reduction of one allele. Thus, it is critical that differences in allele intensity be maintained after whole genome amplification. To assess the relative proportion of alleles in heterogeneous populations, we mixed constitutive DNA from two individuals (NL1 and NL2) informative for a polymorphic chromosome 17 STR. NL1 and NL2 have a common allele that is the same size, whereas their second alleles differ in size. Samples were mixed to have a variable amount of NL2, ranging from 0% to 100%. The common allele always comprises 50% of the allele copies, and thus should be amplified by PEP to give 50% of the PCR product in subsequent locus-specific reactions for each mixture.
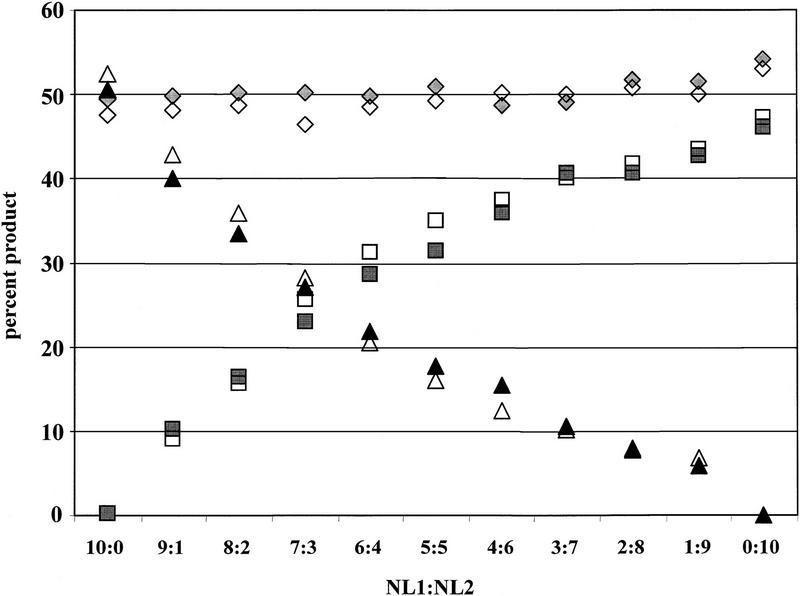
Genomic DNA for NL1 and NL2 was quantitated and mixed prior to PEP. Three independent, pooled PEP reactions and mixed genomic DNA were used for locus-specific PCR. The shared allele typically comprised nearly 50% of the product for pooled PEP and genomic DNA, as expected (Fig. 3). With increasing concentration of NL2, the amount of the unique NL2 allele increased for both PEP and genomic DNA, indicating PEP amplification accurately represents the allele ratio differences in mixed populations. The nonshared NL2 allele was 4 bp smaller than the common allele [the stutter position (Hauge and Litt 1993; Litt et al. 1993)], resulting in an artificially increased NL2 intensity and causing the unique allele proportions to be unequal in the 50:50 mix.
Figure 3.
PEP preserves relative allele concentrations. Two cases were selected that were informative at the chromosome 17 STR D17S1303, and that had one common allele (diamonds) of the same size (bp), and one unique allele of different size [NL1 (triangles) or NL2 (squares) allele]. Locus-specific reactions were performed with either genomic DNA from the equivalent of 3000 cells (open symbols) or pools of three independent PEP reactions (1000 cells into each PEP) (solid symbols). DNA was mixed with the indicated proportions of NL1:NL2 prior to PEP or locus-specific genomic PCR. The percentage of PCR product represented by each allele was determined by dividing the fluorescent intensity of the allele by the total fluorescent units for all three alleles.
Sensitivity of LOH Detection
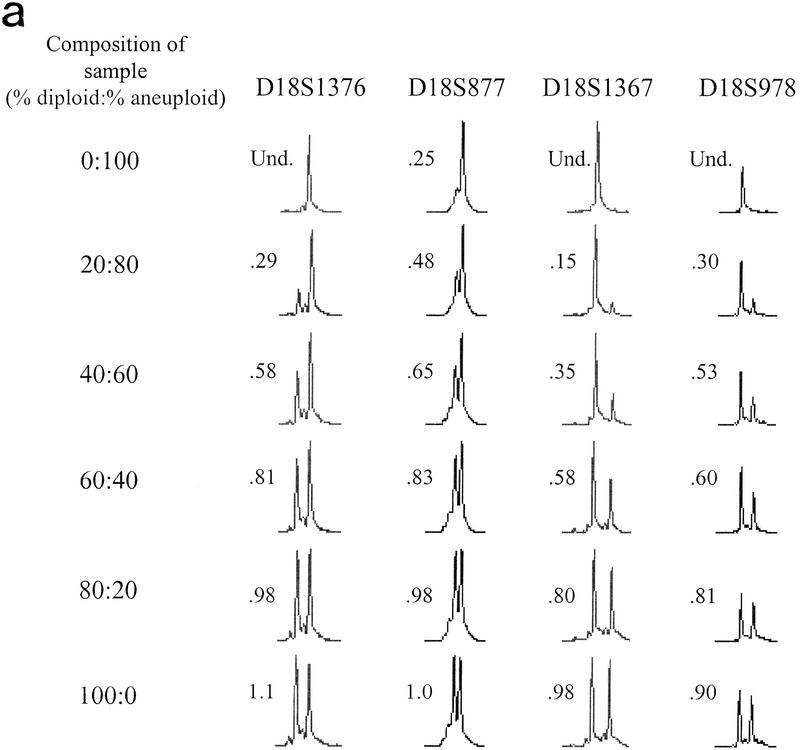
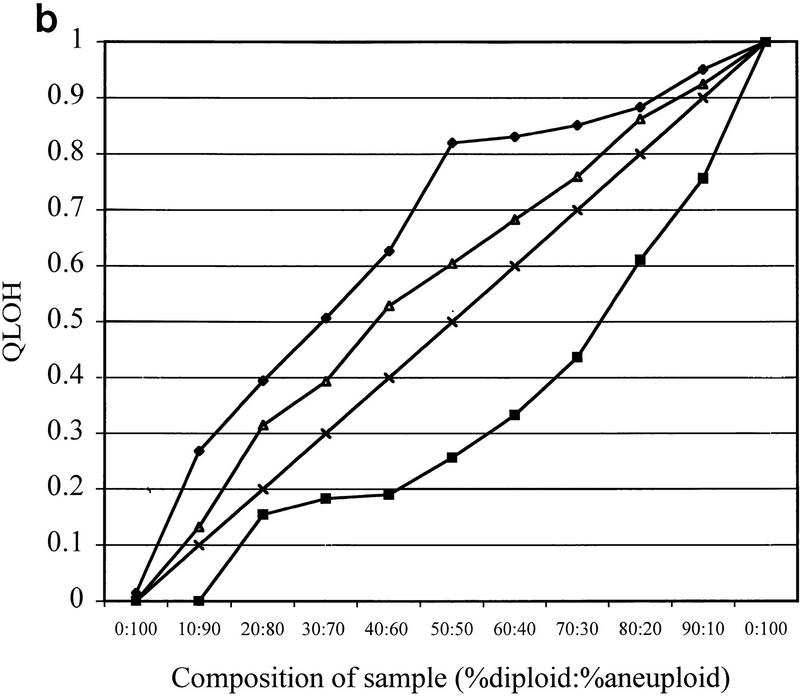
Cell populations within tumors and premalignant tissues are rarely homogeneous. Cells that have LOH are typically mixed with normal or other cells that have not undergone LOH. We investigated the sensitivity of LOH detection in populations in which only a subset of cells had undergone loss. DNA mixtures representative of mixed cell populations were reconstructed by combining increasing amounts of normal diploid DNA heterozygous for chromosome 18 loci with DNA from aneuploid cells from the same individual that had a complete loss of one copy of chromosome 18. Pooled PEP DNAs from diploid and aneuploid cell populations were mixed in the indicated ratios prior to locus-specific PCR with 16 different chromosome 18 STRs. Q-LOH, the allele ratio of the sample/the allele ratio of the 100% diploid sample (Hahn et al. 1995), was determined for each mixture. Allele ratios of mixed populations were intermediate between the allele ratios of the normal and aneuploid samples (Fig. 4a). The ratio of 0.25 in the all-aneuploid D18S877 sample demonstrates the contribution of stutter, which can affect peak height in some STRs (Hauge and Litt 1993; Litt et al. 1993). Furthermore, QLOH was roughly proportional to the percent of cells in a population with LOH, although STRs differed substantially in their sensitivity for detecting LOH (Fig. 4b). We obtained similar results in biopsy samples from a different individual using seven chromosome 9 loci, indicating that sensitivity differences between STRs are not unique to the chromosome 18 set (data not shown).
Figure 4.
LOH detection in the presence of normal cell contamination. Two DNA samples, one corresponding to a biopsy sample with no allelic loss on chromosome 18 (diploid), the other corresponding to a biopsy sample that had undergone chromosome 18 nondisjunction (aneuploid), underwent PEP reactions with genomic input DNA from 1000 cells. Pooled PEP reactions were mixed in the ratios indicated and subjected to locus-specific PCR. (a) Electropherograms showing allele ratios in diploid/aneuploid mixtures for four chromosome 18 STRs. Numbers indicate allele ratios. The reciprocal of the allele ratio was taken for those STRs that had ratios >1 (i.e., larger allele was lost), for ease of comparison. (b) Variable STR sensitivity for LOH detection. QLOH for each sample was determined by dividing the allele ratio obtained for each DNA mixture by the allele ratio of the all-diploid sample. The STRs that were most sensitive (shaded squares) and least sensitive (solid diamonds) in detecting a minority population of cells with LOH correspond to the upper (D18S1369) and lower (D18S541) plots, respectively. The average plot (triangles) represents the numerical average of QLOH for all 14 informative markers; the expected plot (line) represents a theoretical line assuming the allele intensity is exactly proportional to its abundance in a population. QLOH was corrected for the contribution of stutter for samples in which the lost allele was in the stutter position.
LOH Analysis in Flow-Purified Aneuploid Cell Populations
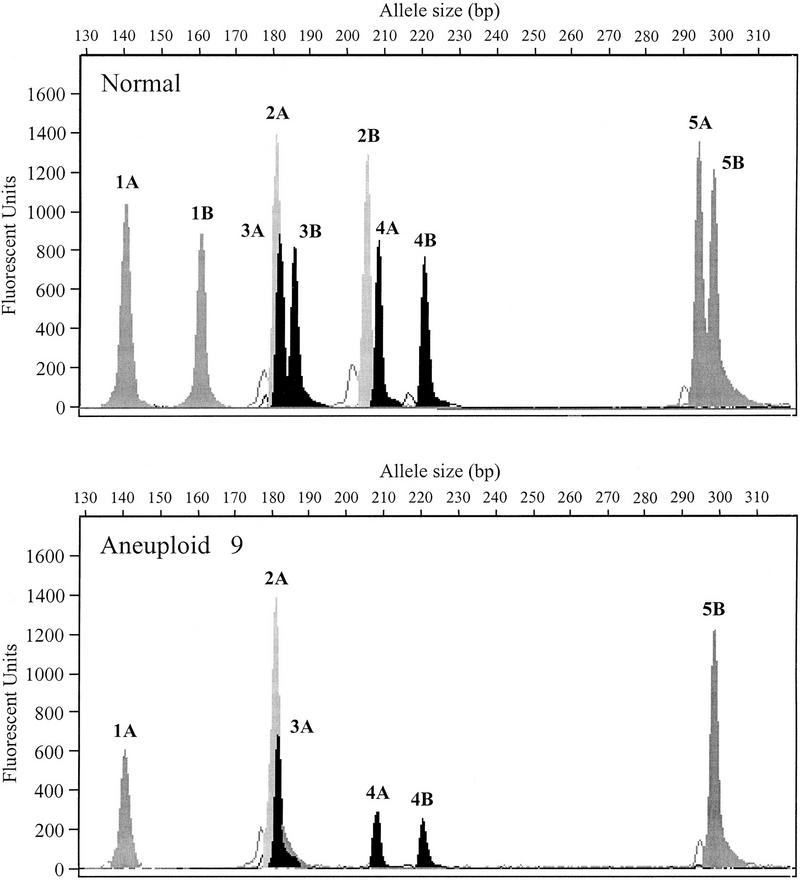
The capacity afforded by PEP to analyze multiple loci along the length of a chromosome can allow detailed analyses of chromosomal alterations. Examples of typical analyses are shown in Figures 5 and 6. A low-resolution LOH analysis at 5 loci on chromosome 9 was performed on 10 flow-purified aneuploid populations from different patients that had been found previously by conventional autoradiographic detection to have LOH on 9p21. Normal gastric tissue was used as a control for each patient. Reactions were done in quadruplicate without pooling PEP samples to illustrate the variability that can occur from reaction to reaction. Fluorescent-labeled PCR products for all five loci were pooled for each sample and run in a single lane on an ABI 373 sequencing gel. Electropherograms for a representative sample (Aneuploid 9) are shown in Figure 5. Flow cytometric cell sorting purified neoplastic cells in this population, as demonstrated by clear LOH without residual background peaks that result from normal stromal cell contamination.
Figure 5.
LOH at multiple sites in esophageal adenocarcinoma. Chromosome 9 STRs are labeled from 1 to 5 and alleles are identified as A or B. Electropherograms are representative of the four replicates done for this normal: aneuploid pair. Unambiguous LOH occurs at each locus except 4 (D9S301), where both alleles are retained. (_x_-axis) Allele size in base pairs; (_y_-axis) peak height in fluorescent units.
Figure 6.
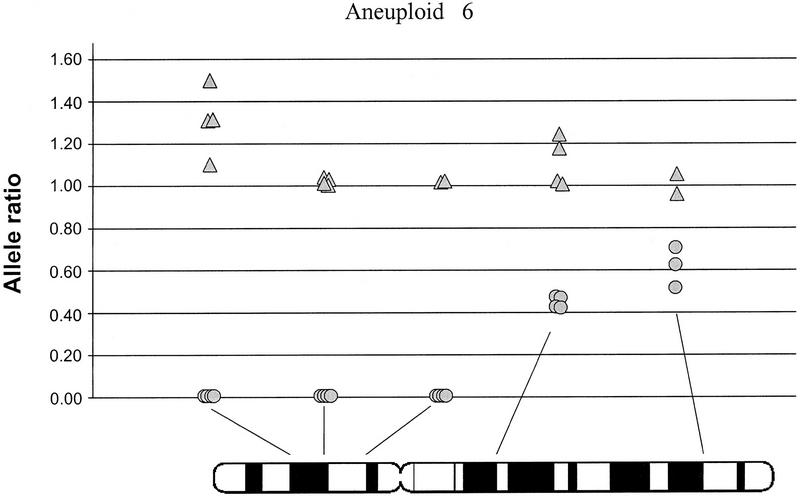
Allele ratios within a single aneuploid population. Allele ratios are shown for normal (triangles) and aneuploid (circles) populations from aneuploid 6. Results from the replicate samples are shown for the five informative loci on chromosome 9. PCR failure resulted in fewer than four replicates at three loci.
Aneuploid cells comprised from 12.9% to 77.7% of the samples before sorting (Table 1). Aneuploid 1 showed unambiguous loss at all informative loci on 9p and 9q, likely indicating chromosome 9 nondisjunction. Aneuploids 3, 4, and 5 showed LOH of all informative loci that amplified on chromosome 9p with retention of both alleles on 9q. Aneuploids 6, 7, and 8 showed clear LOH of all three 9p loci and allele ratios between 0.44–0.81 for loci on 9q (Table 1, Fig. 6). These 9q ratios are different from those in the corresponding normal DNA, but they do not show the clearcut LOH apparent at the 9p loci, suggesting complex chromosomal alterations.
Table 1.
Comparison Between Normal and Aneuploid Allele Ratios
| Ploidy (N) | Aneuploid | 9p | 9q | |||||
|---|---|---|---|---|---|---|---|---|
| No. | % | D9S925 | D9S1121 | D9S1118 | D9S301 | D9S930 | ||
| NL | 1.14 | N.I. | 1.65 | 1.01 | 1.08 | |||
| 3.0 | 1 | 34.5 | An | 0.04 | N.I. | 0.00 | 0.02 | 0.02 |
| NL | N.I. | 1.15 | N.I. | 1.15 | 0.86 | |||
| 3.5 | 2 | 30.9 | An | N.I. | 0.12 | N.I. | N.D. | 0.19 |
| NL | 1.36 | 1.47 | 1.19 | 1.13 | 1.23 | |||
| 3.5 | 3 | 32.4 | An | 0.00 | 0.00 | 0.00 | 1.23 | 1.07 |
| NL | 0.98 | N.I. | N.D. | 1.29 | 1.38 | |||
| 1.8 | 4 | 74.6 | An | 0.00 | N.I. | N.D. | 1.07 | 0.97 |
| NL | 0.76 | N.I. | N.D. | N.D. | 1.04 | |||
| 4.0 | 5 | 62.6 | An | 0.00 | N.I. | 0.00 | 1.17 | 1.37 |
| NL | 1.31 | 1.02 | 0.96 | 1.11 | 1.01 | |||
| 3.2 | 6 | 60.1 | An | 0.01 | 0.05 | 0.01 | 0.44 | 0.60 |
| NL | 1.02 | 1.35 | 1.15 | N.I. | 1.06 | |||
| 2.9 | 7 | 77.7 | An | 0.00 | 0.01 | 0.00 | N.I. | 0.55 |
| NL | 1.00 | 1.27 | 1.48 | 1.14 | 1.31 | |||
| 3.4 | 8 | 34.40 | An | 0.00 | 0.03 | 0.00 | 0.60 | 0.81 |
| NL | 1.07 | 1.11 | 1.20 | 1.10 | 1.03 | |||
| 3.3 | 9 | 58.7 | An | 0.00 | 0.00 | 0.00 | 1.07 | 0.01 |
| NL | 1.05 | N.I. | N.I. | 0.90 | 1.15 | |||
| 3.5 | 10 | 12.9 | An | 0.16 | N.I. | N.I. | 1.04 | N.D. |
DISCUSSION
The size and cellular heterogeneity of human biopsies frequently limit LOH analyses in premalignant and malignant tissues. In addition, the number of biopsies required for large-scale clinical or public health science studies necessitates automated, high-throughput techniques. Use of flow-cytometric cell sorting, whole genome amplification, and fluorescent-labeled, locus-specific primers increases the number of loci that can be analyzed from a single biopsy and increases sample throughput, while maintaining accuracy and reproducibility.
Most LOH studies have used DNA from ∼3000 to 6000 cells per genotype, making detailed somatic genetic analyses of small clinical samples impossible (Boynton et al. 1992; Hall et al. 1996; Niederacher et al. 1997). PEP has been shown to amplify loci equivalently throughout the genome (Zhang et al. 1992; Barrett et al. 1995), and our results indicate that properly performed cell purification, whole genome amplification, and fluorescent genotyping give accurate, reproducible results for use in clinical and population-based studies. We have found the amount of input genomic DNA used for PEP or locus-specific reactions to be the main variable in obtaining reproducible allele ratios and sample purity to be the main determinant for unambiguously identifying LOH. Higher allele ratio variation between replicate samples was observed when genomic DNA in the PEP reaction was reduced to the equivalent of 100 cells (Fig. 2). Increasing the input level of DNA to the equivalent of 300–1000 cells reduced variability between samples while maintaining accurate allele ratios. Whereas the observed variability would not affect evaluation of samples having unambiguous LOH, the level of variation in the 100-cell samples would make those samples with intermediate allele ratios difficult to evaluate. We have also found that pooled PEP reactions give more reproducible allele ratios than single PEP reactions, as pools are less susceptible to the effects of a single, suboptimal PCR (T. Paulson, unpubl.). Further, PEP does not result in preferential amplification of one allele over another (Fig. 3) or affect LOH detection in mixed cell populations (Fig. 4). Finally, ∼60 locus-specific PCRs can be analyzed from a pool of three PEP reactions, allowing analysis of multiple chromosomal regions with only 3000 cells from a biopsy sample. An evaluation of the entire genome at a resolution of 10cM could be performed with DNA from only 18,500 cells, which is easily obtainable with flow-sorted clinical biopsies.
The purity of the cell population being analyzed is one of the most important factors in detecting LOH. In BE and esophageal adenocarcinoma, we have used DNA content flow cytometric cell sorting to purify aneuploid cell populations to ≥95% purity (P. Rabinovitch, unpubl.). In nonaneuploid samples, cellular or nuclear antigens can be used in multiparameter flow cytometric cell sorting to achieve a high degree of purification of proliferating premalignant epithelial cell populations (Gerdes et al. 1984; Gerdes 1990). Similar multiparameter sorting strategies with cytokeratins have also been successful (Frei et al. 1994; Glogovac et al. 1996). Some investigations have examined tumor cell populations enriched by standard or laser-capture microdissection (Jen et al. 1994; Smith et al. 1995), but many studies have simply used macroscopic tumor without enrichment. Whereas microdissection can be useful for investigations requiring purification on the basis of tissue architecture and allows molecular and histological analysis to be done on the same sample, it enriches populations on the basis of morphology, which is subject to diagnostic errors and inter-observer variability (Reid et al. 1988). In contrast, flow sorting purifies neoplastic populations on the basis of objective, reproducible markers. However, neither flow sorting nor microdissection can separate genetically distinct subpopulations that do not differ in the parameter used for purification (e.g., two genetically distinct subpopulations within a 3.5N aneuploid population).
The normal-aneuploid mixing experiment (Fig. 4) demonstrates that LOH can be detected in a background of normal cells; however, there was considerable variation between STRs in sensitivity of LOH detection. Thus, the potential for incorrect classification of LOH exists if an impure sample containing only a subset of cells with LOH is analyzed with a low-sensitivity STR. Neither fluorescent primer dye nor size or sequence of the microsatellite repeat were characteristic of STR sensitivity for detecting LOH. It remains possible that the particular STRs or individual DNA samples used in this experiment contributed to the variability, although the similar results with chromosome 9 STRs make this unlikely. This experiment emphasizes the importance of sample purity and the difficulty in making unambiguous LOH determinations on the basis of intermediate allele ratios, such as QLOH between 0.4–0.8 or 1.25–2.5 (depending on the allele lost). We consider QLOH values <0.2 or >5.0 to be clearly indicative of loss, whereas ratios between 0.2 and 0.4 or 2.5 and 5.0 are considered suggestive of loss. Ratios from 0.4 to 0.8 or 1.25 to 2.5 could indicate partial LOH, but other mechanisms, including amplification or chromosome reduplication, could result in similar values. In these cases, LOH analysis is insufficient to characterize the chromosomal alterations that have taken place and other methodologies (e.g., comparative genomic or fluorescent in-situ hybridization) may be required. The differential STR sensitivity in detecting LOH in mixed populations emphasizes the importance of using purified samples and multiple STRs per chromosomal region for LOH analysis.
Flow purification of aneuploid populations prior to LOH analysis at multiple loci on chromosome 9 allowed unambiguous LOH determination (Table 1). One sample contained only 13% aneuploid cells and it is unlikely that unambiguous 9p LOH would have been detected without flow sorting. Flow-purification also allowed more detailed interpretation of LOH at loci with allelic imbalance. For example, Figure 6 shows some loci that had a ratio of 0.0 (100% LOH), whereas other loci on the same chromosome had a ratio closer to 0.5. Ratios of 0.5 are frequently interpreted as allelic imbalance due to contaminating normal tissue; however, the presence of 100% loss at other sites on the chromosome indicate normal cell contamination was unlikely. Another possibility was that 9pLOH was followed by isochromosome 9q formation. Similar chromosome rearrangements have been described in retinoblastoma (Cavenee et al. 1983), and recent experiments with CGH and other techniques have made similar findings (El-Rifai et al. 1998). Alternatively, all cells in this population may have 9p LOH, with a second loss occurring on 9q in a subset of cells. If this analysis had been done on unpurified populations, or only at one or two sites on the chromosome, discrimination between these possibilities would not have been possible. Although specific causes for allele ratios other than 1.0 cannot always be determined, use of flow-purified samples and assessment of allele ratios at multiple loci along the length of the chromosome allow a more detailed interpretation of LOH data.
We have used fluorescent-labeled primers to amplify STRs for LOH analysis on automated sequencing gels. Traditional ethidium bromide staining and autoradiographic techniques typically give qualitative results not readily adaptable to high-throughput analyses. Fluorescent genotyping provides an alternative by allowing multiple STRs to be evaluated per gel lane, and by generating data that can be collected and evaluated electronically (Reed et al. 1994; Schwengel et al. 1994; Hampton et al. 1996; Niederacher et al. 1997). For example, only 20 lanes would be required to obtain the data shown in Figures 5 and 6. We routinely analyze 10 loci per lane, generating up to 640 genotypes per gel using a 64-well comb, and other groups have been able to genotype with up to 24 STRs per lane, making this system readily adaptable to high-density LOH analyses (Reed et al. 1994). Automated sequencing gels also provide semiquantitative fluorescence detection, allowing more accurate determination of allele ratios. Because the ABI fluorescent detection system has a range of approximately three orders of magnitude, care must be taken to avoid signal saturation, which can result in skewed peak identification and quantification (ABI 373 Users Manual).
Although investigators have shown good reproducibility using dinucleotide STRs and fluorescent-labeled PCR without the use of PEP (Reed et al. 1994; Niederacher et al. 1997), tetranucleotide repeats tend to perform better when alleles of different concentrations are present in a DNA pool (Shaw et al. 1998). We have found tetranucleotide STRs to be more reproducible than di- or trinucleotides with PEP DNA as well (data not shown). Genotyper software (ABI) contains a feature for eliminating the stutter bands typically found with dinucleotide STRs that is useful when performing constitutive genotyping. However, in samples with LOH or allelic imbalance, visual inspection of each PCR product and manual editing of all the data is required because minor peaks are often not correctly identified. Tetranucleotide repeats also allow the use of shorter gels for analysis, reducing gel run times compared with dinucleotide markers (2 hr vs. 8–14 hr on ABI 373). These shorter gels do not sufficiently separate alleles at a 2-bp resolution, sometimes resulting in inaccurate peak identification. If a denser map is required for fine LOH mapping, 8- to 14-hr 36-cm gel runs on the ABI 373 or use of an ABI 377 may be required to achieve optimal 2-bp resolution.
In summary, LOH analysis of clinical samples requires an approach that minimizes the inherent variability in PCR analysis, increases throughput, and facilitates determination of LOH. Examination of LOH in BE provided a unique opportunity to obtain samples from premalignant and tumor tissue from the same individual over the course of many years. Whereas this system allows determination of the genetic changes that occur during tumor progression, it also requires analysis of a large number of biopsy samples. This has driven the development of an analysis system with a high degree of reproducibility coupled with a high-throughput capacity. The methods described here should be directly adaptable to analysis of a wide variety of premalignant and neoplastic tissues.
METHODS
Patient Samples
Endoscopic biopsies were obtained from patients with BE who were enrolled in a research program of endoscopic surveillance as part of the Seattle Barrett’s Esophagus Research Project, which was approved by the Human Subjects Division at the University of Washington and the Institutional Review Board of the Fred Hutchinson Cancer Research Center.
Flow Cytometry
Endoscopic Biopsy
Tissue samples (∼25 mg) were collected during endoscopy or from surgical resections and immediately placed into tissue culture medium with 5% FCS, 5 mm HEPES buffer and 10% DMSO on ice in the endoscopy suite, and stored in a freezer at −70°C until analyzed. Samples used in these analyses were primarily from esophageal adenocarcinomas and corresponding normal tissue from the same patient.
Tissue Preparation for DNA Content Flow Cytometry
Biopsies were minced in the bottom of a Petri dish (35 × 100 mm) in 146 mm NaCl buffer containing 10 mm Tris-HCl (pH 7.5), 0.2% Nonidet P40 (Sigma, St. Louis, MO), 1 mm CaCl2, 0.5 mm MgSO4, 21 mm MgCl2, 0.05% BSA, and 10 μg/ml of DAPI (Boehringer Mannheim, Indianapolis, IN). The suspension was forced through a 1-cm3 tuberculin syringe with a 25-guage needle typically 7–10 times to disaggregate and enucleate the cells, and stored on ice.
Ki67/DNA Content Flow Cytometry: G0, G1 Sorting
Ki67/DNA content flow cytometry was performed as described previously (Reid et al. 1993; Blount et al. 1994).
Cell Sorter
Cells were sorted with a Coulter Elite ESP (Miami, FL) with dual argon ion lasers (UV and 488 nm) with DAPI (DNA) fluorescence collected at 420–480 nm and phycoerythrin fluorescence collected at 565–585 nm. Data were displayed as peak versus area and collected as list mode files. Aggregates were excluded from the Ki67/DNA histograms by doublet discrimination within the peak versus area histogram. Ki67/DNA data were displayed and collected as two related parameters (DNA, linear, abscissa) versus phycoerythrin (Ki67, logarithmic, ordinate). Nuclei were sorted either into diploid G0/G1 (2N) and aneuploid cell populations or Ki67-positive 2N (G1) and 4N cell populations. Nuclei were collected into presiliconized 1.7-ml microcentrifuge tubes, kept on ice, and stored at −70 C.
DNA Extraction
DNA was extracted from fresh-frozen esophageal biopsy material or flow-sorted nuclei by a standard phenol/chloroform protocol as described previously (Blount et al. 1994), or using the Puregene DNA Isolation Kit (Gentra Systems, Minneapolis, MN) according to the manufacturer’s instructions. DNA was stored at ∼7 ng/μl in 1× Tris/EDTA at −20°C.
Primer Extension Preamplification (PEP)
Whole genome amplification was performed on the basis of the PEP method of Zhang et al. (1992). Briefly, DNA from ∼1000 nuclei was mixed with 400 μm random 15-mer primers, PCR buffer (10 mm Tris-HCl at pH 8.4, 2.5 mm MgCl2, 50 mm KCl, 0.01% gelatin) 300 μm dNTP mix, and 5 units of Taq DNA polymerase (Boehringer Mannheim) in a 60 μl final volume. Cycling conditions were 1 min at 95°C, 2 min 37°C, ramp to 55°C at 10 sec/degree, hold at 55°C for 4 min, repeat cycling 49 times with a final hold at 4°C. For routine high-throughput screening applications, 90 unique DNA samples and 6 PEP and PCR controls were loaded into a 96-well plate (Robbins Scientific). This was the master plate from which DNA for subsequent PCR was aliquoted. When pooling PEP reactions, three independent PEP plates were generated, and the plates were pooled prior to locus-specific PCR.
Polymorphisms, Primer Selection, and Primer Labeling
Polymorphic primers were synthesized by Research Genetics (Huntsville, AL) with the forward primer labeled on the 5′ end with one of three phosphoramidite fluorescent dyes, 6-FAM, HEX, or TET. Loci were selected that were robust when used with whole genome-amplified DNA and allowed multiple STRs to be evaluated per gel lane. Final primer concentration for PCR reactions ranged from 0.06 to 0.3 μm. For chromosome 18q, in which the gene(s) being targeted for inactivation in Barrett’s esophagus are unknown, we selected loci spaced an average of every 7.75 cm, with a minimum heterozygosity of 0.75 (according to CHLC). STRs used in LOH analyses in this manuscript were D9S930, D9S925, D9S301, D9S1121, D9S1118, D17S1303, D18S1376, D18S1363, D18S877, D18S847, D18S974, D18S1369, D18S535, D18S548, D18S978, D18S977, D18S1270, D18S969, D18S1367, D18S875, D18S541, and D18S1358. Several online resources were utilized to obtain polymorphic loci, allele frequencies, primer sequences, and location on genetic maps relative to other genes and loci. The primary online resources used were The Center for Medical Genetics (http://www.marshmd.org/genetics), The Cooperative Human Linkage Center (CHLC) (http://www.chlc.org), The Genome Database (http://gdb.www.gdb.org), and The Genetic Location Database (http://cedar.genetics.soton.ac.uk).
Locus-Specific PCR
For primer optimization we found that 0.08 μm of fluorescent-labeled primer was usually sufficient to generate PCR products with fluorescence intensities near 1000 FU. However, some primer sets gave optimal signals with primer concentrations ranging from 0.06 to 0.3 μm. Therefore, each primer concentration was optimized using multiple constitutive DNA samples. Optimal PCR annealing temperature was determined by evaluating peak intensity and specificity of PCR product with temperatures ranging from 50°C to 65°C for each primer concentration analyzed. The majority of STRs amplify optimally with 0.08 μm primer and 55–60°C annealing temperature.
Following PEP, 3 μl of each amplified DNA was transferred from the master plate to a separate 96-well plate for each locus-specific primer with the Hydra96Microdispensor (Robbins Scientific). After each experiment, the Hydra was cleaned as described (Robbins Scientific Innovations, Summer 1997). To increase throughput and enhance primer-binding specificity, we used Advantage PCR enzyme mix (Clontech), a mix of Tth DNA polymerase, a second proofreading polymerase, and TaqStart Antibody, which provides built-in hot-start PCR. Locus-specific reactions were performed in a total volume of 8 μl with 0.08 μl of this enzyme mix, 1× buffer with 3 mm magnesium acetate in the concentration supplied by the manufacturer (Clontech), and 200 μm dNTPs. Standard cycling conditions were as follows: 95°C for 1 min, 30 cycles of 95°C for 45 sec, at annealing temperature (55–65°C) for 45 sec, 72°C for 1 min, and a final two-temperature step of 72°C for 7 min, and annealing temperature for 30 min. All reactions were performed in either a Tetrad DNA Engine or a PTC-200 thermal cycler (MJ Research) and were kept at 4°C following cycling.
PCR Product Pooling and Gel Electrophoresis
Before pooling of the PCR products, samples were run on either a 2% acrylamide, Novex 1mm 20% acrylamide/TBE gel on the Thermaflow electrophoresis apparatus (Novex, San Diego, CA), or on 1.5% agarose gels to evaluate approximate product intensity. In the initial PCR optimization, we defined the PCR conditions and primer concentrations to generate PCR products of similar intensity. Product intensity was also adjusted by increasing or decreasing the amount of locus-specific reaction added to the other samples during pooling (see below). Optimal fluorescence intensity of PCR products is critical because interpretation of LOH results depends on accurate measurement of the relative allele intensities in each sample to the allele intensities in the normal controls.
PCR products were pooled with the Hydra96 Microdispenser, desalted, concentrated with Micron-100 96 place filters (Amicon) according to the manufacturer, and resuspended in 40 μl of water. Two microliters of this cleaned, diluted, pooled product was mixed 1:1 with formamide loading dye (Amersham) and denatured. PCR reactions were run on 12-cm 5% acrylamide gel at 26 W for 2 hr on an ABI 373 DNA sequencer, with real time fluorescence-detection of PCR products. An internal size standard (Genescan-500 labeled with Tamra, ABI) was used in each lane to give accurate base-pair determinations.
Data Flow, Quality Control, Collection, and Analysis
After each gel run, lanes were tracked manually and data were inspected visually with Genescan software (ABI). A data file for each lane was imported into Genotyper (ABI) for automated allele calling. We empirically determined that peak height was superior to peak area for LOH assessment when running 12-cm gels on the basis of the reproducibility of peak calling with the Genescan software. All alleles (peaks) called by Genotyper were visually inspected for accuracy. All data were electronically imported into our existing Access 97 database for subsequent data analysis.
Allele ratios were determined by measuring the fluorescence intensity (peak height) of the smaller (base-pair) allele A relative to the FU intensity of the larger allele B (A/B). LOH was determined by assessing the ratio of peak heights in tumor or neoplastic tissue samples relative to the ratio in the corresponding normal control. QLOH was then determined [QLOH = (Tumor allele ratio)/(Normal allele ratio)]. Depending on whether the smaller or larger allele was lost, QLOH could have any value between zero and infinity, with 0.0 being 100% loss of allele A, and infinity being 100% loss of allele B. QLOH values <0.2 or >5 were considered to be clearly indicative of LOH.
Statistical Analysis
Variability was measured by determining the s.d. between the multiple replicates done at each PCR condition. Comparisons of the variability between different treatment conditions were done by calculating the ratio of the s.d.s of those treatments. This ratio was calculated separately for each STR. Allele ratios obtained from PEP versus genomic DNA were compared by determining the percent difference between allele ratios obtained from the different DNA sources, by use of the value obtained from the genomic DNA as the baseline.
Acknowledgments
We thank Drs. Peter Rabinovitch and Shawn Iadonato and members of the Reid laboratory for critical evaluation of the manuscript. This work is supported by grants from the National Institutes of Health (NIH) (R0161202 and R0172030). T.G.P. supported by NIH training grant DK07742.
The publication costs of this article were defrayed in part by payment of page charges. This article must therefore be hereby marked “advertisement” in accordance with 18 USC section 1734 solely to indicate this fact.
Footnotes
E-MAIL bjr@fhcrc.org; FAX (206) 667-6132.
REFERENCES
- Baker SJ, Fearon ER, Nigro JM, Hamilton SR, Preisinger AC, Jessup JM, vanTuinen P, Ledbetter DH, Barker DF, Nakamura Y, et al. Chromosome 17 deletions and p53 gene mutations in colorectal carcinomas. Science. 1989;244:217–221. doi: 10.1126/science.2649981. [DOI] [PubMed] [Google Scholar]
- Barrett MT, Reid BJ, Joslyn G. Genotypic analysis of multiple loci in somatic cells by whole genome amplification. Nucleic Acids Res. 1995;23:3488–3492. doi: 10.1093/nar/23.17.3488. [DOI] [PMC free article] [PubMed] [Google Scholar]
- Barrett MT, Galipeau PC, Sanchez CA, Emond MJ, Reid BJ. Determination of the frequency of loss of heterozygosity in esophageal adenocarcinoma by cell sorting, whole genome amplification and microsatellite polymorphisms. Oncogene. 1996;12:1873–1878. [PubMed] [Google Scholar]
- Blount PL, Galipeau PC, Sanchez CA, Neshat K, Levine DS, Yin J, Suzuki H, Abraham JM, Meltzer SJ, Reid BJ. 17p allelic losses in diploid cells of patients with Barrett’s esophagus who develop aneuploidy. Cancer Res. 1994;54:2292–2295. [PubMed] [Google Scholar]
- Boynton RF, Blount PL, Yin J, Brown VL, Huang Y, Tong Y, McDaniel T, Newkirk C, Resau JH, Raskind WH, et al. Loss of heterozygosity involving the APC and MCC genetic loci occurs in the majority of human esophageal cancers. Proc Natl Acad Sci. 1992;89:3385–3388. doi: 10.1073/pnas.89.8.3385. [DOI] [PMC free article] [PubMed] [Google Scholar]
- Cavenee WK, Dryja TP, Phillips RA, Benedict WF, Godbout R, Gallie BL, Murphree AL, Strong LC, White RL. Expression of recessive alleles by chromosomal mechanisms in retinoblastoma. Nature. 1983;305:779–784. doi: 10.1038/305779a0. [DOI] [PubMed] [Google Scholar]
- El-Rifai W, Harper JC, Cummings OW, Hyytinen ER, Frierson HF, Jr, Knuutila S, Powell SM. Consistent genetic alterations in xenografts of proximal stomach and gastro-esophageal junction adenocarcinomas. Cancer Res. 1998;58:34–37. [PubMed] [Google Scholar]
- Fearon ER, Cho KR, Nigro JM, Kern SE, Simons JW, Ruppert JM, Hamilton SR, Preisinger AC, Thomas G, Kinzler KW, et al. Identification of a chromosome 18q gene that is altered in colorectal cancers. Science. 1990;247:49–56. doi: 10.1126/science.2294591. [DOI] [PubMed] [Google Scholar]
- Frei JV, Rizkalla K, Martinez VJ. Proliferative cell indices measured by DNA flow cytometry in node-negative adenocarcinomas of breast: Accuracy and significance in cytokeratin-stained archival specimens. Mod Pathol. 1994;7:925–929. [PubMed] [Google Scholar]
- Galipeau PC, Cowan DS, Sanchez CA, Barrett MT, Emond MJ, Levine DS, Rabinovitch PS, Reid BJ. 17p (p53) allelic losses, 4N (G2/tetraploid) populations, and progression to aneuploidy in Barrett’s esophagus. Proc Natl Acad Sci. 1996;93:7081–7084. doi: 10.1073/pnas.93.14.7081. [DOI] [PMC free article] [PubMed] [Google Scholar]
- Gerdes J. Ki-67 and other proliferation markers useful for immunohistological diagnostic and prognostic evaluations in human malignancies. Semin Cancer Biol. 1990;1:199–206. [PubMed] [Google Scholar]
- Gerdes J, Lemke H, Baisch H, Wacker HH, Schwab U, Stein H. Cell cycle analysis of a cell proliferation-associated human nuclear antigen defined by the monoclonal antibody Ki-67. J Immunol. 1984;133:1710–1715. [PubMed] [Google Scholar]
- Glogovac JK, Porter PL, Banker DE, Rabinovitch PS. Cytokeratin labeling of breast cancer cells extracted from paraffin-embedded tissue for bivariate flow cytometric analysis. Cytometry. 1996;24:260–267. doi: 10.1002/(SICI)1097-0320(19960701)24:3<260::AID-CYTO9>3.0.CO;2-L. [DOI] [PubMed] [Google Scholar]
- Hahn M, Matzen SE, Serth J, Pingoud A. Semiautomated quantitative detection of loss of heterozygosity in the tumor suppressor gene p53. BioTechniques. 1995;18:1040–1047. [PubMed] [Google Scholar]
- Hall JM, LeDuc CA, Watson AR, Roter AH. An approach to high-throughput genotyping. Genome Res. 1996;6:781–790. doi: 10.1101/gr.6.9.781. [DOI] [PubMed] [Google Scholar]
- Hampton GM, Larson AA, Baergen RN, Sommers RL, Kern S, Cavenee WK. Simultaneous assessment of loss of heterozygosity at multiple microsatellite loci using semi-automated fluorescence-based detection: Subregional mapping of chromosome 4 in cervical carcinoma. Proc Natl Acad Sci. 1996;93:6704–6709. doi: 10.1073/pnas.93.13.6704. [DOI] [PMC free article] [PubMed] [Google Scholar]
- Hauge XY, Litt M. A study of the origin of “shadow bands” seen when typing dinucleotide repeat polymorphisms by the PCR. Hum Mol Genet. 1993;2:411–415. doi: 10.1093/hmg/2.4.411. [DOI] [PubMed] [Google Scholar]
- Jen J, Kim H, Piantadosi S, Liu ZF, Levitt RC, Sistonen P, Kinzler KW, Vogelstein B, Hamilton SR. Allelic loss of chromosome 18q and prognosis in colorectal cancer. N Engl J Med. 1994;331:213–221. doi: 10.1056/NEJM199407283310401. [DOI] [PubMed] [Google Scholar]
- Lasko D, Cavenee W, Nordenskjold M. Loss of constitutional heterozygosity in human cancer. Annu Rev Genet. 1991;25:281–314. doi: 10.1146/annurev.ge.25.120191.001433. [DOI] [PubMed] [Google Scholar]
- Litt M, Hauge X, Sharma V. Shadow bands seen when typing polymorphic dinucleotide repeats: Some causes and cures. BioTechniques. 1993;15:280–284. [PubMed] [Google Scholar]
- Neshat K, Sanchez CA, Galipeau PC, Levine DS, Reid BJ. Barrett’s esophagus: The biology of neoplastic progression. Gastroenterol Clin Biol. 1994;18:D71–D76. [PubMed] [Google Scholar]
- Niederacher D, Picard F, van Roeyen C, An HX, Bender HG, Beckmann MW. Patterns of allelic loss on chromosome 17 in sporadic breast carcinomas detected by fluorescent-labeled microsatellite analysis. Genes Chromosomes Cancer. 1997;18:181–192. doi: 10.1002/(sici)1098-2264(199703)18:3<181::aid-gcc5>3.0.co;2-y. [DOI] [PubMed] [Google Scholar]
- Reed PW, Davies JL, Copeman JB, Bennett ST, Palmer SM, Pritchard LE, Gough SC, Kawaguchi Y, Cordell HJ, Balfour KM, et al. Chromosome-specific microsatellite sets for fluorescence-based, semi-automated genome mapping. Nat Genet. 1994;7:390–395. doi: 10.1038/ng0794-390. [DOI] [PubMed] [Google Scholar]
- Reid BJ. Barrett’s esophagus and esophageal adenocarcinoma. Gastroenterol Clin N Am. 1991;20:817–834. [PubMed] [Google Scholar]
- Reid BJ, Blount PL, Rubin CE, Levine DS, Haggitt RC, Rabinovitch PS. Flow-cytometric and histological progression to malignancy in Barrett’s esophagus: Prospective endoscopic surveillance of a cohort. Gastroenterology. 1992;102:1212–1219. [PubMed] [Google Scholar]
- Reid BJ, Haggitt RC, Rubin CE, Roth G, Surawicz CM, Van Belle G, Lewin K, Weinstein WM, Antonioli DA, Goldman H, et al. Observer variation in the diagnosis of dysplasia in Barrett’s esophagus. Hum Pathol. 1988;19:166–178. doi: 10.1016/s0046-8177(88)80344-7. [DOI] [PubMed] [Google Scholar]
- Reid BJ, Sanchez CA, Blount PL, Levine DS. Barrett’s esophagus: Cell cycle abnormalities in advancing stages of neoplastic progression. Gastroenterology. 1993;105:119–129. doi: 10.1016/0016-5085(93)90017-7. [DOI] [PubMed] [Google Scholar]
- Schwengel DA, Jedlicka AE, Nanthakumar EJ, Weber JL, Levitt RC. Comparison of fluorescence-based semi-automated genotyping of multiple microsatellite loci with autoradiographic techniques. Genomics. 1994;22:46–54. doi: 10.1006/geno.1994.1344. [DOI] [PubMed] [Google Scholar]
- Shaw SH, Carrasquillo MM, Kashuk C, Puffenberger EG, Chakravarti A. Allele frequency distributions in pooled DNA samples: Applications to mapping complex disease genes. Genome Res. 1998;8:111–123. doi: 10.1101/gr.8.2.111. [DOI] [PubMed] [Google Scholar]
- Sidransky D. Nucleic acid-based methods for the detection of cancer. Science. 1997;278:1054–1059. doi: 10.1126/science.278.5340.1054. [DOI] [PubMed] [Google Scholar]
- Smith JR, Carpten JD, Brownstein MJ, Ghosh S, Magnuson VL, Gilbert DA, Trent JM, Collins FS. Approach to genotyping errors caused by nontemplated nucleotide addition by Taq DNA polymerase. Genome Res. 1995;5:312–317. doi: 10.1101/gr.5.3.312. [DOI] [PubMed] [Google Scholar]
- Taberlet P, Griffin S, Goossens B, Questiau S, Manceau V, Escaravage N, Waits LP, Bouvet J. Reliable genotyping of samples with very low DNA quantities using PCR. Nucleic Acids Res. 1996;24:3189–3194. doi: 10.1093/nar/24.16.3189. [DOI] [PMC free article] [PubMed] [Google Scholar]
- Zhang L, Cui X, Schmitt K, Hubert R, Navidi W, Arnheim N. Whole genome amplification from a single cell: Implications for genetic analysis. Proc Natl Acad Sci. 1992;89:5847–5851. doi: 10.1073/pnas.89.13.5847. [DOI] [PMC free article] [PubMed] [Google Scholar]
