Akt-Dependent Glucose Metabolism Promotes Mcl-1 Synthesis to Maintain Cell Survival and Resistance to Bcl-2 Inhibition (original) (raw)
. Author manuscript; available in PMC: 2012 Aug 1.
Abstract
Most cancer cells utilize aerobic glycolysis, and activation of the phosphatidyl-inositol 3-kinase (PI3K)/Akt/mTOR pathway can promote this metabolic program to render cells glucose-dependent. While manipulation of glucose metabolism may provide a means to specifically eliminate cancer cells, mechanistic links between cell metabolism and apoptosis remain poorly understood. Here we examine the role and metabolic regulation of the anti-apoptotic Bcl-2 family protein Mcl-1 in cell death upon inhibition of Akt-induced aerobic glycolysis. In the presence of adequate glucose, activated Akt prevented the loss of Mcl-1 expression and protected cells from growth factor-deprivation induced apoptosis. Mcl-1 associated with and inhibited the pro-apoptotic Bcl-2 family protein Bim, contributing to cell survival. However, suppression of glucose metabolism led to induction of Bim, decreased expression of Mcl-1, and apoptosis. The pro-apoptotic Bcl-2/Bcl-xL/Bcl-w inhibitor, ABT-737, shows clinical promise, but Mcl-1 upregulation can promote resistance. Importantly, inhibition of glucose metabolism or mTORC1 overcame Mcl-1-mediated resistance in diffuse large B cell leukemic cells. Together these data show that Mcl-1 protein synthesis is tightly controlled by metabolism and that manipulation of glucose metabolism may provide a mechanism to suppress Mcl-1 expression and sensitize cancer cells to apoptosis.
Keywords: Mcl-1, mTOR, ABT-737, apoptosis, glycolysis
Introduction
Many cancer cells have increased rates of glucose uptake and glycolysis relative to their normal counterparts, a metabolic program termed aerobic glycolysis (1, 2) that has allowed detection and imaging of tumors and metastases by 18F-deoxyglucose Positron Emission Tomography (FDG-PET) (3). This metabolic program is believed to promote biosynthesis for rapid cell growth and inhibit some cell death pathways (4, 5). In particular, we have shown that elevated glycolysis characteristic of cancer cells can affect Bcl-2 family proteins to suppress induction of the pro-apoptotic protein Puma and degradation of the anti-apoptotic protein Mcl-1 (6–9). Because cancer cells often rely on glucose as a biosynthetic and energy source, disruption of aerobic glycolysis may provide an efficient means to selectively target and eliminate cancer cells.
Bcl-2 family proteins are likely critical to effectively induce apoptosis in new metabolic approaches to cancer therapy, as inhibition of glucose metabolism requires Bcl-2 family proteins to initiate rapid apoptosis. Cells lacking the pro-apoptotic Bcl-2 family proteins Bax and Bak resist cell death for prolonged periods of nutrient starvation through activation of autophagy and use of alternate fuels (10). In addition, the Bcl-2 family includes anti-apoptotic proteins such as Bcl-2, Bcl-xL, and Mcl-1, and pro-apoptotic BH3-only proteins, including Puma and Bim (11), and expression of anti-apoptotic family members can protect cells from apoptosis upon glucose-deprivation (8, 12). In addition, we have previously shown that glucose-deprivation can lead to induction of Bim and a p53-dependent increase in Puma expression that contributes to apoptosis (8, 9).
Among Bcl-2 family proteins, Mcl-1 may play a particularly important role in cell death responses to changes in glucose metabolism (7, 13, 14). Mcl-1 was first identified in a myeloid cell leukemia cell line (15) and is overexpressed in many cancers, including B and T cell malignancies (16). In contrast, genetic deletion of Mcl-1 can cause embryonic lethality (17), impede lymphocyte survival (18, 19), and sensitize cancer cells to treatment with other agents (20–22). Synthesis of Mcl-1 is regulated through transcriptional mechanisms induced by cytokines including IL-2, IL-3, and IL-7, as well as by control of protein translation through mTOR (14, 23). When translated, Mcl-1 is a short-lived protein that is subject to rapid degradation after phosphorylation through ubiquitin-dependent (24–27) and ubiquitin-independent pathways (28).
We have previously demonstrated that the oncogenic kinase Akt promotes glucose metabolism and requires glucose in part to regulate Bcl-2 family proteins to prevent cell death (4, 9). Here we examine the role of glucose metabolism in cells with active Akt and show that inhibition of glucose metabolism leads to a decrease in Mcl-1 protein expression that greatly sensitizes cells to ABT-737, a BH3-mimetic that functions by binding to and inhibiting the anti-apoptotic function of Bcl-2, Bcl-xL, and Bcl-w, but not Mcl-1 or A1 (29). These results suggest that cancer cell glucose metabolism is essential to maintain mTOR and 4EBP1 phosphorylation to sustain Mcl-1 protein translation, and that therapies directed at aerobic glycolysis may allow selective reduction of Mcl-1 to sensitize cancer cells to apoptosis to ABT-737.
Materials and Methods
Cell culture
Control, myristoylated Akt (mAkt), mAkt+p70 S6K1 E389-D3E (mAkt+CA-S6K1), and Bcl-xL expressing FL5.12 cells were cultured as described (7, 12) and washed 3X with PBS followed by culture +/− IL-3. mAkt was induced by 16–24 hour treatment with 1 μg/ml doxycycline (Sigma). Jurkat cells (American Type Culture Collection) were cultured in RPMI 1640 media with 10% FBS. Murine primary T cells were isolated by negative selection (StemSep) and stimulated on anti-CD3ε and anti-CD28 coated plates (BD Pharmingen) in RPMI 1640 media with 10% FBS and 5 ng/ml IL-2 (PeproTech). After 48 hours, T cells were washed and cultured for an additional 24 hours with IL-2. DHL4 Par, DHL4 R2, Ly.1 Par, Ly.1 R7, and Ly.1 R10 cells were provided by Dr. A. Letai (Dana Farber Cancer Institute, Boston, MA) (20). DHL4 cells were cultured in Iscoves Modified DMEM media (Mediatech) with 10% FBS. Ly.1 cells were cultured in RPMI 1640 media with 10% FBS. Glucose starvation was accomplished by washing 3X with PBS and culture in glucose-free RPMI 1640 media (Gibco) with 10% dialyzed FBS (Gemini BioProducts). 2-deoxyglucose (2DG; Sigma), cycloheximide (CHX; Sigma), PP242 (Sigma), rapamycin (Cell Signaling), and ABT-737 (Abbott Laboratories) were added at indicated doses.
Immunoblots
Cell lysates were prepared as described (8). Primary antibodies used were: Mcl-1 (BioLegend), Bim (BD Pharmingen), Actin (Sigma), Puma (Cell Signaling), P-S6K (Thr421/Ser424; Cell Signaling), P-S6 (Ser235/236; Cell Signaling), S6 (Cell Signaling), P-4EBP1 (Thr31/46; Cell Signaling), 4EBP1 (Cell Signaling), P-Akt (Ser473, Cell Signaling), Akt (Cell Signaling), P-GSK3 (Ser9/21; Cell Signaling), and A1 (Cell Signaling). Secondary antibodies were: horseradish peroxidase-labeled anti-rabbit (BD Pharmingen) and fluorescent labeled anti-rabbit (Invitrogen) and anti-mouse (LiCor) antibodies. Blots were visualized using Supersignal West Pico Chemiluminescent Substrate (Thermo Scientific) or the Odyssey infrared imagining system (LiCor). Images were uniformly contrasted and some were digitally reorganized to ease interpretation (indicated by white spaces).
Immunopreciptations
Cells were harvested in 1% CHAPS buffer with protease (BD Pharmingen) and phosphatase (Sigma) inhibitors. Anti-Mcl-1 antibody (BioLegend) was added to equal protein amounts and precipitated with protein A/G beads (Santa Cruz) in 1% CHAPS buffer.
Cell death analysis
Cells were stained with 1 μg/ml propidium iodide (Invitrogen) and 5000 cells were analyzed on a FACScan flow cytometer (BD Biosciences) in triplicate and analyzed with FlowJo software (TreeStar).
Quantitative real-time PCR
RNA was harvested using TRizol solution (Invitrogen) and reverse transcribed with SuperScript II RT (Invitrogen) for quantitative real-time PCR with IQ SYBR Green Supermix (BioRad) and β2-microglobulin (8) and Mcl-1 primers (GCATGCTCCGGAAACTGGACATTA and ACGTGGAAGAACTCCACAAACCCA).
Transfection and plasmids
Transient transfections were conducted by nucleofection (Amaxa Kit V; Lonza). Bim, Mcl-1, and control shRNAi constructs have been described (7). FLAG-tagged mouse Bim in the pEF6 vector was used for Bim overexpression.
Mcl-1 synthesis
Control and/or mAkt expressing FL5.12 cells were cultured for 8 hours as indicated, washed, and cultured in cysteine and methionine-free RPMI 1640 media (Mediatech) for 30 minutes. 35S labeled cysteine and methionine (Perkin Elmer) were added, cells were harvested at the indicated times. Mcl-1 was immunoprecipitated and synthesis rate was determined using the following formula: t1/2 = LN(2)/slope of 35S incorporation.
Metabolic Measurements
ATP levels were determined using the ATP bioluminescence assay kit CLS II (Roche Applied Science). Oxygen consumption rate (OCR) and extracellular acidification rate (ECAR) were measured in real-time using an XF24 extracellular flux analyzer (Seahorse Bioscience) as previously described (30).
Statistical analyses
Statistical significance was determined by Students t test with p values as indicated with an asterisk.
Results
Active Akt Must Maintain Mcl-1 in a Glucose-Dependent Fashion to Suppress Bim-Induced Cell Death After IL-3 Deprivation
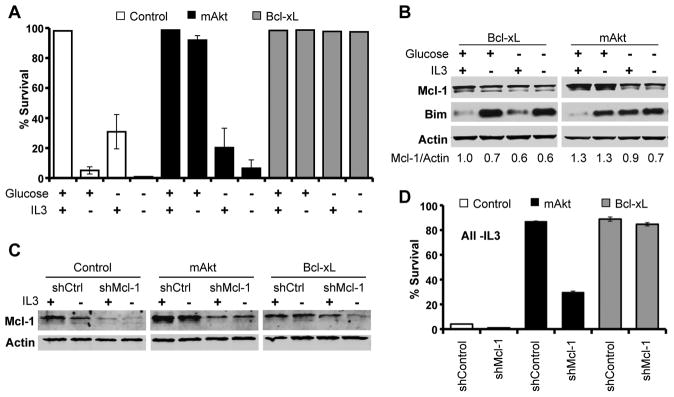
Constitutive Akt activation occurs in many cancers to promote aerobic glycolysis and glucose-dependent cell survival (4, 12). Because Mcl-1 and Bim are known to play prominent roles in hematopoietic cell survival (18, 19, 31), we hypothesized these proteins may be subject to metabolic regulation in Akt-mediated cell survival. Expression of either myristoylated Akt (mAkt) or Bcl-xL prevented cell death after IL-3 withdrawal of FL5.12 cells, but only mAkt required glucose for survival (Figure 1A) (9, 12). To assess possible regulation of Bcl-2 family members by Akt-dependent glucose metabolism and to avoid changes in Mcl-1 and Bim as a consequence of apoptosis itself (32), we examined Mcl-1 and Bim in cells expressing Bcl-xL or mAkt. In Bcl-xL expressing cells, growth factor or glucose deprivation each led to decreased Mcl-1 expression and induction of Bim, particularly in the absence of IL-3 (Figure 1B). In mAkt expressing cells, Bim was induced upon limitation of either growth factor or glucose. In contrast, while activated Akt maintained Mcl-1 expression upon IL-3 withdrawal, Mcl-1 levels decreased when glucose was withdrawn. This was not due to decreased Akt signaling, as both Akt and the Akt substrate GSK-3 remained phosphorylated in the absence of glucose (Supplemental Figure 1A). Decreased Mcl-1 expression upon disruption of glucose metabolism appeared specific among anti-apoptotic Bcl-2 family proteins, as glucose deprivation did not affect expression of Bcl-2 or Bcl-xL (Supplemental Figure 1B).
Figure 1. Glucose-Dependent Maintenance of Mcl-1 is Essential for Akt-Mediated Cell Survival.
A. Control, Bcl-xL, and mAkt expressing FL5.12 cells were cultured as indicated and assayed for cell death by PI exclusion after 24 hours. B. Bcl-xL and mAkt expressing FL5.12 cells were cultured as indicated for 10 hours and analyzed by immunoblot. C, D. Control, mAkt, and Bcl-xL expressing cells were transfected with control and Mcl-1 shRNAi and examined (C) by immunoblot and (D) cultured -IL-3 and assayed for cell death by PI exclusion after 24 hours. Representative experiments are shown and values represent the means +/− standard deviations of triplicate samples.
Importantly, the glucose-dependent ability of mAkt to maintain Mcl-1 expression was essential for maximal Akt-mediated survival. Partial reduction of Mcl-1 expression by shRNAi was sufficient to reduce survival of mAkt-expressing cells relative to Bcl-xL expressing cells that resist apoptosis and to more closely resemble control FL5.12 cells that undergo rapid cell death after IL-3 withdrawal (Figures 1C and 1D, and Supplemental Figures 2A and 2B). Dependence on Mcl-1 was not due to a specific unique function of Mcl-1, as overexpression of the anti-apoptotic protein Bcl-xL fully rescued the survival of IL-3-deprived cells with reduced Mcl-1. Rather, the specific metabolic regulation of Mcl-1 provided anti-apoptotic function that could not be replaced by endogenous Bcl-2 or Bcl-xL expression.
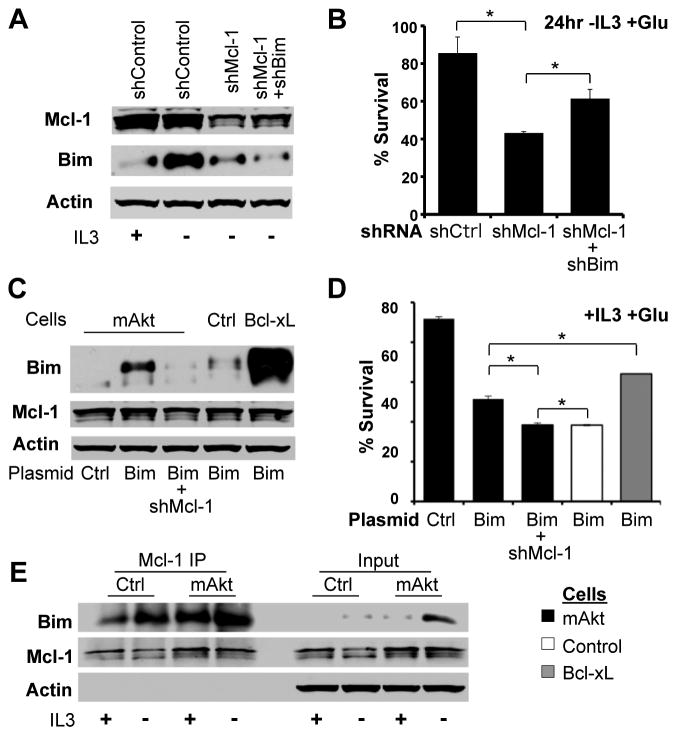
Mcl-1 is required for viability of hematopoietic cells in vivo (18, 19), and decreased Mcl-1 may have allowed apoptosis induced by Bim or other pro-apoptotic Bcl-2 family proteins (9, 13). To test the role of Bim in the death of mAkt expressing cells with reduced Mcl-1, expression of Bim and Mcl-1 was reduced by shRNAi in IL-3 deprived mAkt expressing cells (Figure 2A). Bim-deficiency partially rescued the increased apoptosis observed in IL-3 deprived mAkt expressing cells with reduced Mcl-1 (Figure 2B). Conversely, transfection of control cells with Bim led to rapid toxicity (Figures 2C and 2D). mAkt and Bcl-xL could each partially suppress Bim-induced apoptosis, but mAkt-expressing cells failed to do so when Mcl-1 levels were reduced by shRNAi. These data suggested a functional relationship between Mcl-1 and Bim, and co-immunoprecipitation with an anti-Mcl-1 antibody revealed increased Bim binding to Mcl-1 after IL-3 withdrawal (Figure 2E). Therefore, Mcl-1 expression is required to suppress apoptosis induced by Bim and other Bcl-2 family members (5, 8) upon disruption of glycolysis.
Figure 2. Mcl-1 Inhibits Bim-Induced Apoptosis.
A, B. mAkt expressing cells were transfected with control, Mcl-1, and/or Bim shRNAi, cultured +/- IL-3, and analyzed by (A) immunoblot after 10 hours or (B) for cell survival after 24 hours -IL-3. C, D. Control, mAkt, and Bcl-xL expressing cells were transfected with control or Bim expression plasmids +/− Mcl-1 shRNAi and cells were examined by (C) immunoblot and (D) assayed for cell death by PI exclusion. E. Mcl-1 was immunoprecipitated (IP) from control and mAkt-expressing cells cultured +/− IL-3 for 10 hours and analyzed by immunoblot. Representative experiments are shown and values represent the means +/− standard deviations of triplicate samples. Statistical significance is indicated with an *: p < 0.05.
Inhibition of Glucose Metabolism Causes Decreased Mcl-1 Expression and Cell Death in Multiple Settings
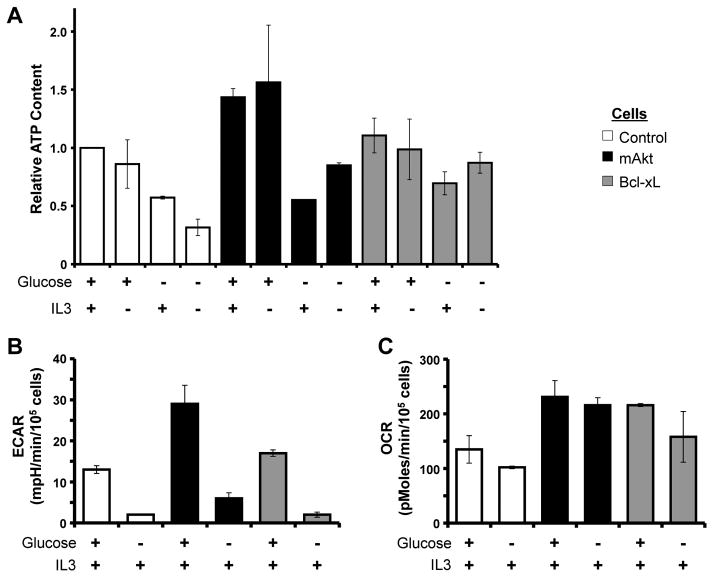
Because glucose can be exhausted in inflamed tissues or tumors (33), glucose availability may act as a rheostat to control Mcl-1 expression and cell death. To examine the metabolic effects of glucose-depletion, control, mAkt, and Bcl-xL expressing cells were cultured in the presence or absence of glucose for 12 hours and ATP and metabolic flux were analyzed. Despite the availability of alternative fuel sources, glucose deprivation decreased ATP levels in control and mAkt expressing cells (Figure 3A). ATP also decreased, although to a lesser extent in cells expressing Bcl-xL, suggesting these cells had more robust capacity for metabolic adaptation. As expected, glucose deprivation decreased the extracellular acidification rate (ECAR), a measurement indicative of glycolytic rate (Figure 3B). Surprisingly, in no case did cells increase their rate of oxygen consumption (OCR) after twelve hours of glucose deprivation (Figure 3C). Thus glucose deprivation for extended periods led to decreased ATP and mitochondrial oxidative metabolism did not increase to compensate.
Figure 3. Glucose Deprivation Causes Bioenergetic Stress.
A. Control, mAkt, and Bcl-xL expressing cells were cultured as indicated for 12 hours and assayed for ATP content. B, C. mAkt and Bcl-xL expressing cells were cultured in the presence of IL3 with or without glucose for 12 hours and analyzed (B) for extracellular acidification rate (ECAR) and (C) oxygen consumption rate (OCR). Values represent the means +/− standard deviations of triplicate samples and are representative of two independent experiments.
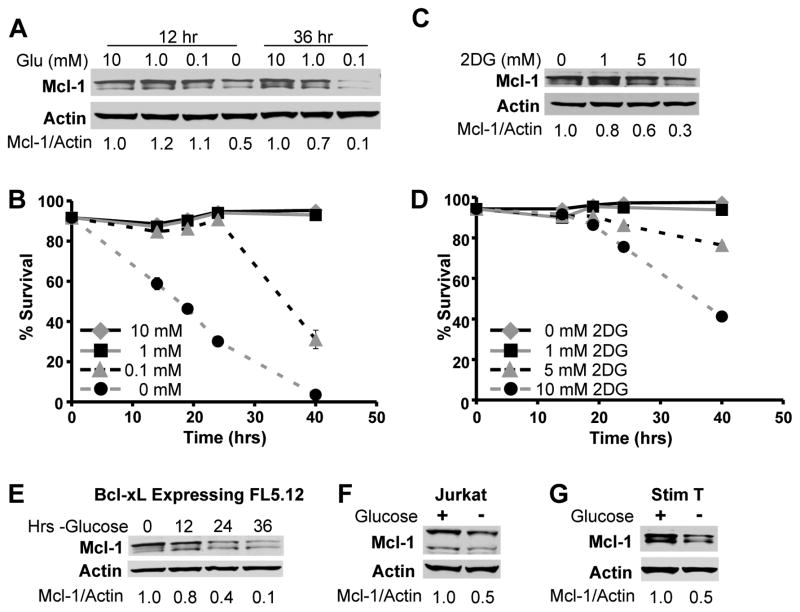
To more closely examine glucose metabolism and Mcl-1, control FL5.12 cells were cultured either in limiting doses of glucose or in the presence of glucose and the glycolytic inhibitor 2-deoxyglucose (2DG). Complete glucose deprivation caused decreased Mcl-1 expression (Figure 4A) and rapid cell death (Figure 4B). As little as 0.1 mM glucose protected Mcl-1 and prevented cell death at early time points, although Mcl-1 decreased and cells underwent apoptosis at later times. Addition of 2DG to inhibit glycolysis also led to a dose-dependent loss of Mcl-1 expression and cell viability (Figures 4C and 4D). Lower Mcl-1 expression was not a result of cell death, as glucose deprivation of Bcl-xL expressing FL5.12 cells that resisted cell death (Figure 1A) (8, 12) also showed decreased Mcl-1 expression following glucose withdrawal (Figure 4E). In addition, glucose deprivation of both the T-ALL cell line Jurkat (Figure 4F) as well as stimulated primary murine T cells (Figure 4G) also caused decreased Mcl-1 expression.
Figure 4. Inhibition of Glucose Metabolism Decreases Mcl-1 Expression and Promotes Cell Death.
A and B. FL5.12 cells were cultured in IL-3 with indicated concentrations of glucose and analyzed over time (A) by immunoblot or (B) for cell death by PI exclusion. C, D. FL5.12 cells were cultured in IL-3 with addition of indicted concentrations of 2-deoxyglucose (2DG) and analyzed (C) by immunoblot after 10 hours or (D) for cell death by PI exclusion. E–G. Immunoblots of (E) Bcl-xL expressing FL5.12 cells, (F) Jurkat T cells, and (G) stimulated primary murine T cells cultured as indicated (E) over time, or after (F) 48 or (G) 12 hours. Quantification displayed is Mcl-1 relative to Actin. Representative experiments are shown and values represent the means +/− standard deviations of triplicate samples.
Glucose Metabolism is Essential to Maintain Mcl-1 Protein Synthesis
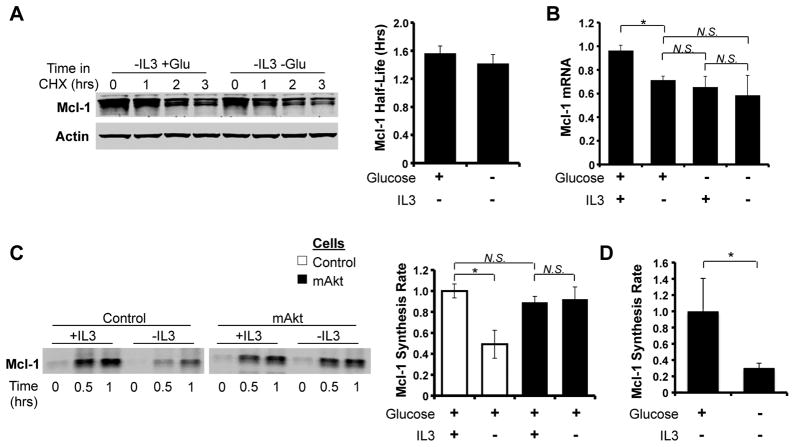
Mcl-1 is frequently regulated at the level of protein stability (7, 24–26). To determine if Akt maintained Mcl-1 levels by glucose-dependent suppression of proteolytic degradation, mAkt-expressing FL5.12 cells were cultured in the absence of IL-3 and the presence and absence of glucose followed by treatment with CHX to inhibit new protein synthesis (Figure 5A). Surprisingly, glucose deprivation did not significantly decrease Mcl-1 protein half-life. Mcl-1 mRNA can also be unstable (34) and Mcl-1 transcription is highly regulated, but real-time PCR also did not reveal additional significant changes in Mcl-1 mRNA levels upon glucose deprivation beyond what occurred upon IL-3 withdrawal (Figure 5B).
Figure 5. Glucose Deprivation Inhibits Mcl-1 Protein Synthesis.
A. mAkt expressing cells were cultured -IL-3 +/− glucose for 10 hours, cycloheximide (25 μg/ml; CHX) was added. A representative blot is shown on left and quantitation of Mcl-1 half-life from three independent experiments is shown on right. B. mAkt expressing cells were cultured as indicated for 8 hours and analyzed by qRT-PCR. C. Control and mAkt cells were labeled with 35S labeled cysteine and methionine as indicated, Mcl-1 was immunoprecipitated, and a representative autoradiogram is shown on the left with quantitation of Mcl-1 synthesis rates from three independent experiments on the right. D. mAkt expressing cells were cultured -IL3 +/− glucose for 8 hours and Mcl-1 synthesis rate was calculated as above. Values represent the means +/− standard deviations of triplicate experiments. Statistical significance is indicated by an *: p < 0.05.
Akt can promote protein synthesis through the activation of mTORC1, and interruption of this pathway may decrease Mcl-1 after glucose deprivation. Indeed, metabolic stress has been reported to promote AMPK activation to inhibit mTORC1 and lead to decreased Mcl-1 synthesis (14). Mcl-1 synthesis rates were, therefore, directly measured in control and mAkt expressing FL5.12 cells by 35S metabolic labeling and Mcl-1 immunoprecipitation. IL-3 deprivation led to a decrease in Mcl-1 synthesis in control cells that was inhibited by mAkt expression (Figure 5C). Importantly, the ability of mAkt to prevent the decrease in Mcl-1 synthesis upon IL-3 deprivation was dependent on glucose metabolism, as glucose deprivation of mAkt cells sharply decreased Mcl-1 synthesis (Figure 5D).
Control of Mcl-1 Synthesis by the mTORC1/4EBP1 Pathway
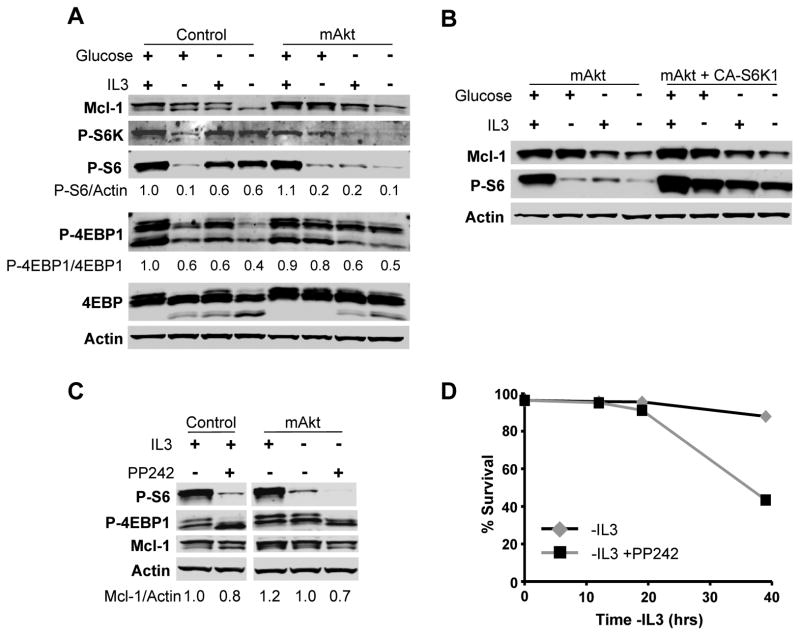
Akt promotes protein synthesis by stimulating mTORC1 to phosphorylate S6 kinases (S6K) and 4EBP1 (35). Recent data has shown that these two pathways of mTORC1 function can be differentially regulated and functionally distinct, with inhibitory phosphorylation of 4EBP1 important to promote protein synthesis while stimulatory phosphorylation the S6K pathway promotes cell growth and metabolism (36). IL-3 deprivation of control cells reduced mTORC1 activity and decreased phosphorylation of 4EBP1 as well as S6K and the S6K substrate, S6 (Figure 6A; quantitative analyses of phosphorylation provided under each blot). Importantly, total S6 levels were unaffected by the presence or absence of IL-3 and/or glucose (Supplemental Figure 3). While IL-3 deprivation of mAkt expressing cells led to a sharp decrease in phospho-S6, constitutively active Akt partially sustained phospho-4EBP1 in the presence of glucose. Glucose deprivation of IL-3 deprived mAkt-expressing cells, however, led to further decreased phosphorylation of components of both mTORC1 effector pathways, with reduced phospho-S6 and phospho-4EBP1. These data suggested that mAkt maintained Mcl-1 translation partially via the mTOR/4EBP1 pathway rather than through S6K/S6. To directly test the role of S6K in regulation of Mcl-1 levels, cells expressing mAkt alone or together with a constitutively active form of S6K (p70 S6K1 E389-D3E) were cultured in the presence or absence of IL-3 or glucose (Figure 6B). While S6 remained phosphorylated, glucose deprivation nevertheless led to decreased Mcl-1 levels, demonstrating that the S6K1/S6 pathway is not sufficient to support Mcl-1 expression.
Figure 6. 4EBP1-Phosphorylation is Essential for Mcl-1 Synthesis and Survival.
A. Control and mAkt expressing cells were cultured as indicated for 10 hours and analyzed by immunoblot with quantitation. B. Cells expressing mAkt +/− constitutively active S6K1 (CA-S6K1; p70 S6K1 E389-D3E) were cultured as indicated for 10 hours and analyzed by immunoblot. C, D. Control and mAkt expressing cells were cultured as indicated with or without the mTOR kinase inhibitor PP242 (1 μM) and analyzed (C) by immunoblot after 10 hours or (D) for cell viability by PI exclusion. Representative experiments are shown and values represent the means +/− standard deviations of triplicate samples.
Because Akt relied on glucose to maintain Mcl-1 protein synthesis via inhibition of 4EBP1, direct inhibition of mTORC1 may provide a means to limit protein translation and thus suppress Mcl-1 expression due to its short half-life. The mTORC1 inhibitor rapamycin has shown mixed results in cancer clinical trials (37) and recent studies have demonstrated that it does not completely block 4EBP1 phosphorylation (38). Therefore, we treated cells with an active site kinase inhibitor of mTOR, PP242, that efficiently inhibits both S6 and 4EBP1 phosphorylation (39). In both control and mAkt expressing FL5.12 cells, PP242 treatment readily inhibited both S6 and 4EBP1 phosphorylation and led to decreased levels of Mcl-1 (Figure 6C). mTOR kinase inhibition also impeded mAkt-mediated cell survival (Figure 6D).
Inhibition of Glycolysis Overcomes ABT-737 Resistance in DLBL Cells
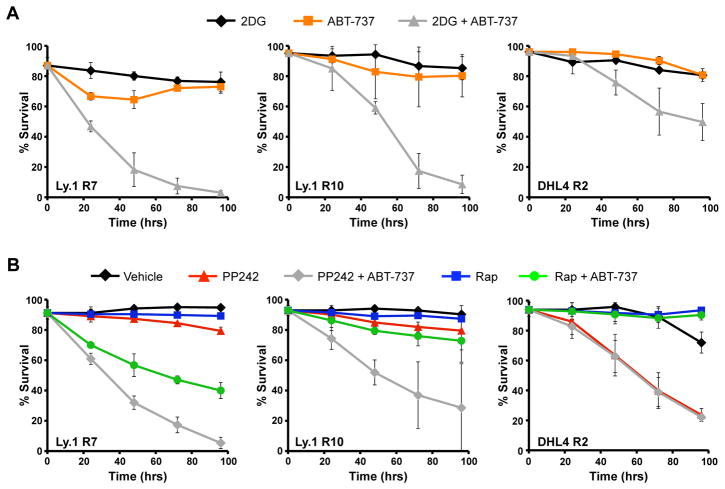
The Bcl-2, Bcl-xL, and Bcl-w inhibitor ABT-737 has shown promise to promote apoptosis of cancer cells, but overexpression of Mcl-1 leads to resistance (20, 21, 40). Therefore, inhibition of glycolysis or mTOR kinase activity to reduce Mcl-1 protein levels may restore sensitivity to ABT-737-resistant cancer cells performing aerobic glycolysis. To test this hypothesis, ABT-737 resistant variants of the diffuse large B cell lymphoma (DLBL) cell lines Ly.1 and DHL4 (20) were examined for synergistic induction of apoptosis by combined glycolysis inhibition and ABT-737. Using increasing doses of ABT-737, each cell line was shown more resistant to ABT-737 treatment than the parental strains (Supplemental Figures 4A and 4B) (20). Resistance to ABT-737 appeared due to elevated Mcl-1 in Ly.1 R7 and Ly.1 R10 and elevated Mcl-1 together with increased A1 in DHL4 R2 (20) (Supplemental Figure 4C). Consistent with similar anti-apoptotic roles for Mcl-1 and Bcl-2 or Bcl-xL, neither 2DG treatment to inhibit glycolysis nor ABT-737 treatment alone were sufficient to cause death of the resistant cell lines (Figure 7A). Combined treatment with 2DG and Mcl-1, however, led to rapid and near complete cell death of both Ly.1 R7 and Ly.1 R10 cells. Similarly, a combination of ABT-737 and 2DG caused significant cell death of DHL4 R2 cells, albeit to not as great a degree as the Ly.1 lines. This less effective killing of DHL4 R2 cells might have been due to expression of the anti-apoptotic Bcl-2 family member A1 (Supplemental figure 4C) that does not appear to be sensitive to metabolic status.
Figure 7. Inhibition of Glycolysis or mTOR Kinase Activity Can Overcome ABT-737 Resistance.
A. Ly.1 R7, Ly.1 R10, and DHL4 R2 cells were cultured with sublethal doses of 2DG (5 mM for Ly.1 R7 and R10, 1 mM for DHL4 R2), ABT-737 (0.1 µM for Ly.1 R7 and R10, 1 µM for DHL4 R2), or both drugs together and assayed for cell death by PI exclusion over time. B. Ly.1 R7, Ly.1 R10, and DHL4 R2 cells were cultured with PP242 (1 μM), rapamycin (25 nM), ABT-737 (same dosing as A), or the indicated combinations and assayed for cell death by PI exclusion. Values represent the means +/− standard deviations of duplicate experiments.
If inhibition of mTORC1-dependent protein synthesis of Mcl-1 is responsible for reduced Mcl-1 after inhibition of aerobic glycolysis, treatment with mTOR kinase inhibitors was likely to also restore sensitivity to ABT-737. In addition, treatment with PP242 should reverse ABT-737 resistance more efficiently than rapamycin due to its enhanced ability to inhibit 4EBP1 phosphorylation and reduce Mcl-1 expression (Supplemental Figure 4D). While neither PP242 nor rapamycin treatment alone caused significant death of Ly.1 R7 or Ly.1 R10 cells, combined treatment with ABT-737 caused significant cell death (Figure 7B). Importantly, PP242 was more efficient than rapamycin to overcome ABT-737 resistance in these two lines. Similar to 2DG and direct glycolytic inhibition, cell death of the DHL4 R2 cell line due to PP242 was not enhanced by ABT-737 treatment. Together these data demonstrate that targeting cancer cell metabolism can enhance ABT-737 effectiveness and overcome ABT-737 resistance by suppressing Mcl-1 translation in glucose-dependent cells.
Discussion
The highly glycolytic metabolic phenotype of cancer cells was first observed by Otto Warburg nearly a century ago (2). Molecular links between aerobic glycolysis and apoptosis that may provide a selective approach to target cancer cells for apoptosis, however, are poorly understood. Here we show that inhibition of glucose metabolism can promote or sensitize cancer cells to apoptotic cell death by decreased mTORC1/4EBP1-dependent Mcl-1 translation that allows toxicity of pro-apoptotic Bcl-2 family proteins, including Bim. Importantly, metabolic or mTOR kinase inhibition reduced Mcl-1 protein levels and overcame resistance to the Bcl-2 inhibitor ABT-737, suggesting this pathway may provide a mechanism to exploit aerobic glycolysis and promote cancer cell apoptosis either alone or as combinatorial therapy.
Aerobic glycolysis is induced in many cancers as a consequence of oncogenic kinase activity such as through the PI3K/Akt/mTOR pathway (4, 12, 41). Importantly, Akt can also suppress alternative metabolic pathways, such as suppression of lipid uptake and oxidation through phosphorylation of CPT1 (42) or by inhibition of autophagy as an alternate nutrient source in metabolically stressed cells (43). The overall effect, therefore, is to render cells with constitutively active Akt dependent on glucose availability and glycolytic metabolism while normal cells can retain greater metabolic flexibility. Thus, although all cells utilize glucose as fuel, cancer cells may be particularly sensitive to glycolytic inhibition to reduce Mcl-1. Coupling inhibition of glucose metabolism with targeted treatments may further selectively impact cancer cells (6).
This study has further implicated the importance of the mTORC1/4EBP1 pathway in metabolic stress to regulate Mcl-1 protein synthesis. Mcl-1 is highly regulated and distinguished from Bcl-2 and Bcl-xL by a short half-life and enhanced reliance on continued translation. Decreased rates of Mcl-1 synthesis in response to metabolic stress, coupled with its rapid turnover, reduced Mcl-1 expression to sensitize cells to apoptosis. Importantly, changes in Mcl-1 expression observed here were modest yet sufficient to allow Bim-mediated toxicity, highlighting the importance of this pathway. Also, it is likely that inhibition of glucose metabolism or mTOR kinase activity does not specifically reduce Mcl-1 translation, but inhibits general protein synthesis (36). However, because of the very short half-life of Mcl-1 relative to other anti-apoptotic Bcl-2 family members, Mcl-1 levels may be a central determinant in cell death when glucose metabolism is disrupted.
The mechanism by which inhibition of glucose metabolism inhibits mTORC1-dependent phosphorylation of 4EBP1 and Mcl-1 translation remains unclear. Our data show that inhibition of glycolysis causes decreased ATP levels, for which oxidative metabolism cannot fully compensate. This may lead to activation of AMPK, resulting in the inhibition of mTORC1 activity and suppression of Mcl-1 translation (14, 44–47). Inactivation of all mTOR activity, however, would decrease Akt phosphorylation, as mTORC2 is the Akt serine 473 kinase (48). 2DG treatment or glucose deprivation of cells with oncogenic Akt, however, did not reduce Akt S473 phosphorylation or phosphorylation of the Akt substrate, GSK3. In contrast, the mTOR inhibitors rapamycin and PP242 each decreased phospho-Akt, suggesting that glucose deprivation causes specific inhibition of mTORC1 in a manner distinct from either rapamycin or PP242. A more detailed understanding of how glucose deprivation can affect mTOR activity in the context of cancer cells to selectively block mTORC1 will be essential in understanding how metabolism-targeted therapies might enhance cell death.
We have previously shown that glucose-deprivation leads to induction of the pro-apoptotic Bcl-2 proteins Puma and Bim, and reduced levels of Mcl-1 (8, 9). Similarly, glucose deprivation of activated T cells and other cancer cells can lead to reduced levels of Mcl-1 (13, 14). Regulation of the balance of Bcl-2 family proteins by glucose metabolism may be a critical aspect of how aerobic glycolysis can affect cell fate. Many cancer cells are considered primed for apoptosis by upregulation of pro-apoptotic BH3 only proteins, such as Bim, Puma, or Noxa, to occupy anti-apoptotic Bcl-2, Bcl-xL, and Mcl-1 (49). Metabolic status and nutrient availability may alter the primed state of cancer cells to influence susceptibility to other cancer therapeutics that induce apoptosis. It is the unique dependence of Mcl-1 on cell metabolism that places it as a central regulator of cell survival to inhibit pro-apoptotic proteins, including Bim, upon disruption of cancer metabolism.
Metabolically-targeted therapies offer promising pharmacological targets for cancer therapy. Anti-apoptotic Bcl-2 family proteins Bcl-2, Bcl-xL, and Mcl-1, however, must be overcome to promote cancer cell death. Mcl-1 levels have been closely associated with resistance to the Bcl-2/Bcl-xL inhibitor ABT-737 (20–22, 40, 50) and our data show that inhibition of aerobic glycolysis or mTOR kinase activity can suppress protein synthesis leading to a reduction in Mcl-1 levels that sensitizes cells to cytotoxicity mediated by Bim and potentially other pro-apoptotic Bcl-2 family proteins (36). Metabolic control of Mcl-1 synthesis, therefore, is essential for growth factor independent survival of cancer cells, and metabolism-targeted therapies may provide useful options for novel cancer treatments to reduce Mcl-1 and increase cancer cell apoptotic sensitivity.
Supplementary Material
1
2
Acknowledgments
We thank members of the Rathmell and Plas labs for assistance. This work was supported by NIH R01s CA123350 (J.C.R.), AI063345 (J.C.R.), and CA133164 (D.R.P.), the Leukemia and Lymphoma Society Scholar Award (J.C.R.), the Gabrielle’s Angel Foundation for Cancer Research (J.C.R.), and Alex’s Lemonade Stand (J.C.R.).
References
- 1.Vander Heiden MG, Cantley LC, Thompson CB. Understanding the Warburg effect: the metabolic requirements of cell proliferation. Science. 2009;324:1029–33. doi: 10.1126/science.1160809. [DOI] [PMC free article] [PubMed] [Google Scholar]
- 2.Warburg O. On the origin of cancer cells. Science. 1956;123:309–14. doi: 10.1126/science.123.3191.309. [DOI] [PubMed] [Google Scholar]
- 3.Fletcher JW, Djulbegovic B, Soares HP, Siegel BA, Lowe VJ, Lyman GH, et al. Recommendations on the use of 18F-FDG PET in oncology. J Nucl Med. 2008;49:480–508. doi: 10.2967/jnumed.107.047787. [DOI] [PubMed] [Google Scholar]
- 4.Rathmell JC, Fox CJ, Plas DR, Hammerman PS, Cinalli RM, Thompson CB. Akt-directed glucose metabolism can prevent Bax conformation change and promote growth factor-independent survival. Mol Cell Biol. 2003;23:7315–28. doi: 10.1128/MCB.23.20.7315-7328.2003. [DOI] [PMC free article] [PubMed] [Google Scholar]
- 5.Vander Heiden MG, Plas DR, Rathmell JC, Fox CJ, Harris MH, Thompson CB. Growth factors can influence cell growth and survival through effects on glucose metabolism. Mol Cell Biol. 2001;21:5899–912. doi: 10.1128/MCB.21.17.5899-5912.2001. [DOI] [PMC free article] [PubMed] [Google Scholar]
- 6.Mason EF, Zhao Y, Goraksha-Hicks P, Coloff JL, Gannon H, Jones SN, et al. Aerobic glycolysis suppresses p53 activity to provide selective protection from apoptosis upon loss of growth signals or inhibition of BCR-Abl. Cancer Res. 2010;70:8066–76. doi: 10.1158/0008-5472.CAN-10-0608. [DOI] [PMC free article] [PubMed] [Google Scholar]
- 7.Zhao Y, Altman BJ, Coloff JL, Herman CE, Jacobs SR, Wieman HL, et al. Glycogen synthase kinase 3alpha and 3beta mediate a glucose-sensitive antiapoptotic signaling pathway to stabilize Mcl-1. Mol Cell Biol. 2007;27:4328–39. doi: 10.1128/MCB.00153-07. [DOI] [PMC free article] [PubMed] [Google Scholar]
- 8.Zhao Y, Coloff JL, Ferguson EC, Jacobs SR, Cui K, Rathmell JC. Glucose metabolism attenuates p53 and Puma-dependent cell death upon growth factor deprivation. J Biol Chem. 2008;283:36344–53. doi: 10.1074/jbc.M803580200. [DOI] [PMC free article] [PubMed] [Google Scholar]
- 9.Coloff JL, Mason EF, Altman BJ, Gerriets VA, Liu T, Nichols AN, et al. Akt requires glucose metabolism to suppress puma expression and prevent apoptosis of leukemic T cells. J Biol Chem. 2011;286:5921–33. doi: 10.1074/jbc.M110.179101. [DOI] [PMC free article] [PubMed] [Google Scholar]
- 10.Lum JJ, Bauer DE, Kong M, Harris MH, Li C, Lindsten T, et al. Growth factor regulation of autophagy and cell survival in the absence of apoptosis. Cell. 2005;120:237–48. doi: 10.1016/j.cell.2004.11.046. [DOI] [PubMed] [Google Scholar]
- 11.Chipuk JE, Moldoveanu T, Llambi F, Parsons MJ, Green DR. The BCL-2 family reunion. Mol Cell. 2010;37:299–310. doi: 10.1016/j.molcel.2010.01.025. [DOI] [PMC free article] [PubMed] [Google Scholar]
- 12.Plas DR, Talapatra S, Edinger AL, Rathmell JC, Thompson CB. Akt and Bcl-xL promote growth factor-independent survival through distinct effects on mitochondrial physiology. J Biol Chem. 2001;276:12041–8. doi: 10.1074/jbc.M010551200. [DOI] [PubMed] [Google Scholar]
- 13.Alves NL, Derks IA, Berk E, Spijker R, van Lier RA, Eldering E. The Noxa/Mcl-1 axis regulates susceptibility to apoptosis under glucose limitation in dividing T cells. Immunity. 2006;24:703–16. doi: 10.1016/j.immuni.2006.03.018. [DOI] [PubMed] [Google Scholar]
- 14.Pradelli LA, Beneteau M, Chauvin C, Jacquin MA, Marchetti S, Munoz-Pinedo C, et al. Glycolysis inhibition sensitizes tumor cells to death receptors-induced apoptosis by AMP kinase activation leading to Mcl-1 block in translation. Oncogene. 2010;29:1641–52. doi: 10.1038/onc.2009.448. [DOI] [PubMed] [Google Scholar]
- 15.Kozopas KM, Yang T, Buchan HL, Zhou P, Craig RW. MCL1, a gene expressed in programmed myeloid cell differentiation, has sequence similarity to BCL2. Proc Natl Acad Sci U S A. 1993;90:3516–20. doi: 10.1073/pnas.90.8.3516. [DOI] [PMC free article] [PubMed] [Google Scholar]
- 16.Warr MR, Shore GC. Unique biology of Mcl-1: therapeutic opportunities in cancer. Curr Mol Med. 2008;8:138–47. doi: 10.2174/156652408783769580. [DOI] [PubMed] [Google Scholar]
- 17.Rinkenberger JL, Horning S, Klocke B, Roth K, Korsmeyer SJ. Mcl-1 deficiency results in peri-implantation embryonic lethality. Genes Dev. 2000;14:23–7. [PMC free article] [PubMed] [Google Scholar]
- 18.Opferman JT, Iwasaki H, Ong CC, Suh H, Mizuno S, Akashi K, et al. Obligate role of anti-apoptotic MCL-1 in the survival of hematopoietic stem cells. Science. 2005;307:1101–4. doi: 10.1126/science.1106114. [DOI] [PubMed] [Google Scholar]
- 19.Opferman JT, Letai A, Beard C, Sorcinelli MD, Ong CC, Korsmeyer SJ. Development and maintenance of B and T lymphocytes requires antiapoptotic MCL-1. Nature. 2003;426:671–6. doi: 10.1038/nature02067. [DOI] [PubMed] [Google Scholar]
- 20.Yecies D, Carlson NE, Deng J, Letai A. Acquired resistance to ABT-737 in lymphoma cells that up-regulate MCL-1 and BFL-1. Blood. 2010;115:3304–13. doi: 10.1182/blood-2009-07-233304. [DOI] [PMC free article] [PubMed] [Google Scholar]
- 21.Chen S, Dai Y, Harada H, Dent P, Grant S. Mcl-1 down-regulation potentiates ABT-737 lethality by cooperatively inducing Bak activation and Bax translocation. Cancer Res. 2007;67:782–91. doi: 10.1158/0008-5472.CAN-06-3964. [DOI] [PubMed] [Google Scholar]
- 22.Lin X, Morgan-Lappe S, Huang X, Li L, Zakula DM, Vernetti LA, et al. ‘Seed’ analysis of off-target siRNAs reveals an essential role of Mcl-1 in resistance to the small-molecule Bcl-2/Bcl-XL inhibitor ABT-737. Oncogene. 2007;26:3972–9. doi: 10.1038/sj.onc.1210166. [DOI] [PubMed] [Google Scholar]
- 23.Mills JR, Hippo Y, Robert F, Chen SM, Malina A, Lin CJ, et al. mTORC1 promotes survival through translational control of Mcl-1. Proc Natl Acad Sci U S A. 2008;105:10853–8. doi: 10.1073/pnas.0804821105. [DOI] [PMC free article] [PubMed] [Google Scholar]
- 24.Ding Q, He X, Hsu JM, Xia W, Chen CT, Li LY, et al. Degradation of Mcl-1 by beta-TrCP mediates glycogen synthase kinase 3-induced tumor suppression and chemosensitization. Mol Cell Biol. 2007;27:4006–17. doi: 10.1128/MCB.00620-06. [DOI] [PMC free article] [PubMed] [Google Scholar]
- 25.Maurer U, Charvet C, Wagman AS, Dejardin E, Green DR. Glycogen synthase kinase-3 regulates mitochondrial outer membrane permeabilization and apoptosis by destabilization of MCL-1. Mol Cell. 2006;21:749–60. doi: 10.1016/j.molcel.2006.02.009. [DOI] [PubMed] [Google Scholar]
- 26.Zhong Q, Gao W, Du F, Wang X. Mule/ARF-BP1, a BH3-only E3 ubiquitin ligase, catalyzes the polyubiquitination of Mcl-1 and regulates apoptosis. Cell. 2005;121:1085–95. doi: 10.1016/j.cell.2005.06.009. [DOI] [PubMed] [Google Scholar]
- 27.Schwickart M, Huang X, Lill JR, Liu J, Ferrando R, French DM, et al. Deubiquitinase USP9X stabilizes MCL1 and promotes tumour cell survival. Nature. 2010;463:103–7. doi: 10.1038/nature08646. [DOI] [PubMed] [Google Scholar]
- 28.Stewart DP, Koss B, Bathina M, Perciavalle RM, Bisanz K, Opferman JT. Ubiquitin-independent degradation of antiapoptotic MCL-1. Mol Cell Biol. 2010;30:3099–110. doi: 10.1128/MCB.01266-09. [DOI] [PMC free article] [PubMed] [Google Scholar]
- 29.Oltersdorf T, Elmore SW, Shoemaker AR, Armstrong RC, Augeri DJ, Belli BA, et al. An inhibitor of Bcl-2 family proteins induces regression of solid tumours. Nature. 2005;435:677–81. doi: 10.1038/nature03579. [DOI] [PubMed] [Google Scholar]
- 30.Wu M, Neilson A, Swift AL, Moran R, Tamagnine J, Parslow D, et al. Multiparameter metabolic analysis reveals a close link between attenuated mitochondrial bioenergetic function and enhanced glycolysis dependency in human tumor cells. Am J Physiol Cell Physiol. 2007;292:C125–36. doi: 10.1152/ajpcell.00247.2006. [DOI] [PubMed] [Google Scholar]
- 31.Bouillet P, Metcalf D, Huang DC, Tarlinton DM, Kay TW, Kontgen F, et al. Proapoptotic Bcl-2 relative Bim required for certain apoptotic responses, leukocyte homeostasis, and to preclude autoimmunity. Science. 1999;286:1735–8. doi: 10.1126/science.286.5445.1735. [DOI] [PubMed] [Google Scholar]
- 32.Michels J, O’Neill JW, Dallman CL, Mouzakiti A, Habens F, Brimmell M, et al. Mcl-1 is required for Akata6 B-lymphoma cell survival and is converted to a cell death molecule by efficient caspase-mediated cleavage. Oncogene. 2004;23:4818–27. doi: 10.1038/sj.onc.1207648. [DOI] [PubMed] [Google Scholar]
- 33.Schroeder T, Yuan H, Viglianti BL, Peltz C, Asopa S, Vujaskovic Z, et al. Spatial heterogeneity and oxygen dependence of glucose consumption in R3230Ac and fibrosarcomas of the Fischer 344 rat. Cancer Res. 2005;65:5163–71. doi: 10.1158/0008-5472.CAN-04-3900. [DOI] [PubMed] [Google Scholar]
- 34.Yang T, Buchan HL, Townsend KJ, Craig RW. MCL-1, a member of the BLC-2 family, is induced rapidly in response to signals for cell differentiation or death, but not to signals for cell proliferation. J Cell Physiol. 1996;166:523–36. doi: 10.1002/(SICI)1097-4652(199603)166:3<523::AID-JCP7>3.0.CO;2-R. [DOI] [PubMed] [Google Scholar]
- 35.Ruggero D, Sonenberg N. The Akt of translational control. Oncogene. 2005;24:7426–34. doi: 10.1038/sj.onc.1209098. [DOI] [PubMed] [Google Scholar]
- 36.Hsieh AC, Costa M, Zollo O, Davis C, Feldman ME, Testa JR, et al. Genetic dissection of the oncogenic mTOR pathway reveals druggable addiction to translational control via 4EBP1-eIF4E. Cancer Cell. 2010;17:249–61. doi: 10.1016/j.ccr.2010.01.021. [DOI] [PMC free article] [PubMed] [Google Scholar]
- 37.Chapuis N, Tamburini J, Green AS, Willems L, Bardet V, Park S, et al. Perspectives on inhibiting mTOR as a future treatment strategy for hematological malignancies. Leukemia. 2010;24:1686–99. doi: 10.1038/leu.2010.170. [DOI] [PubMed] [Google Scholar]
- 38.Choo AY, Yoon SO, Kim SG, Roux PP, Blenis J. Rapamycin differentially inhibits S6Ks and 4E-BP1 to mediate cell-type-specific repression of mRNA translation. Proc Natl Acad Sci U S A. 2008;105:17414–9. doi: 10.1073/pnas.0809136105. [DOI] [PMC free article] [PubMed] [Google Scholar]
- 39.Janes MR, Limon JJ, So L, Lim RJ, Chavez MA, Vu C, et al. Effective and selective targeting of leukemia cells using a TORC1/2 kinase inhibitor. Nat Med. 2010;16:205–13. doi: 10.1038/nm.2091. [DOI] [PMC free article] [PubMed] [Google Scholar]
- 40.van Delft MF, Wei AH, Mason KD, Vanderberg CJ, Chen L, Czabotar PE, et al. The BH3 mimetic ABT-737 targets selective Bcl-2 proteins and efficiently induces apoptosis via Bak/Bax if Mcl-1 is neutralized. Cancer Cell. 2006;10:389–99. doi: 10.1016/j.ccr.2006.08.027. [DOI] [PMC free article] [PubMed] [Google Scholar]
- 41.Elstrom RL, Bauer DE, Buzzai M, Karnauskas R, Harris MH, Plas DR, et al. Akt stimulates aerobic glycolysis in cancer cells. Cancer Res. 2004;64:3892–9. doi: 10.1158/0008-5472.CAN-03-2904. [DOI] [PubMed] [Google Scholar]
- 42.Deberardinis RJ, Lum JJ, Thompson CB. Phosphatidylinositol 3-kinase-dependent modulation of carnitine palmitoyltransferase 1A expression regulates lipid metabolism during hematopoietic cell growth. J Biol Chem. 2006;281:37372–80. doi: 10.1074/jbc.M608372200. [DOI] [PubMed] [Google Scholar]
- 43.Altman BJ, Wofford JA, Zhao Y, Coloff JL, Ferguson EC, Wieman HL, et al. Autophagy provides nutrients but can lead to Chop-dependent induction of Bim to sensitize growth factor-deprived cells to apoptosis. Mol Biol Cell. 2009;20:1180–91. doi: 10.1091/mbc.E08-08-0829. [DOI] [PMC free article] [PubMed] [Google Scholar]
- 44.Inoki K, Zhu T, Guan KL. TSC2 mediates cellular energy response to control cell growth and survival. Cell. 2003;115:577–90. doi: 10.1016/s0092-8674(03)00929-2. [DOI] [PubMed] [Google Scholar]
- 45.Shaw RJ, Bardeesy N, Manning BD, Lopez L, Kosmatka M, DePinho RA, et al. The LKB1 tumor suppressor negatively regulates mTOR signaling. Cancer Cell. 2004;6:91–9. doi: 10.1016/j.ccr.2004.06.007. [DOI] [PubMed] [Google Scholar]
- 46.Bolster DR, Crozier SJ, Kimball SR, Jefferson LS. AMP-activated protein kinase suppresses protein synthesis in rat skeletal muscle through down-regulated mammalian target of rapamycin (mTOR) signaling. J Biol Chem. 2002;277:23977–80. doi: 10.1074/jbc.C200171200. [DOI] [PubMed] [Google Scholar]
- 47.Sengupta S, Peterson TR, Sabatini DM. Regulation of the mTOR complex 1 pathway by nutrients, growth factors, and stress. Mol Cell. 2010;40:310–22. doi: 10.1016/j.molcel.2010.09.026. [DOI] [PMC free article] [PubMed] [Google Scholar]
- 48.Hresko RC, Mueckler M. mTOR. RICTOR is the Ser473 kinase for Akt/protein kinase B in 3T3-L1 adipocytes. J Biol Chem. 2005;280:40406–16. doi: 10.1074/jbc.M508361200. [DOI] [PubMed] [Google Scholar]
- 49.Deng J, Carlson N, Takeyama K, Dal Cin P, Shipp M, Letai A. BH3 profiling identifies three distinct classes of apoptotic blocks to predict response to ABT-737 and conventional chemotherapeutic agents. Cancer Cell. 2007;12:171–85. doi: 10.1016/j.ccr.2007.07.001. [DOI] [PubMed] [Google Scholar]
- 50.Konopleva M, Contractor R, Tsao T, Samudio I, Ruvolo PP, Kitada S, et al. Mechanisms of apoptosis sensitivity and resistance to the BH3 mimetic ABT-737 in acute myeloid leukemia. Cancer Cell. 2006;10:375–88. doi: 10.1016/j.ccr.2006.10.006. [DOI] [PubMed] [Google Scholar]
Associated Data
This section collects any data citations, data availability statements, or supplementary materials included in this article.
Supplementary Materials
1
2
