Shadows Cast by Retinal Blood Vessels Mapped in Primary Visual Cortex (original) (raw)
. Author manuscript; available in PMC: 2011 Aug 15.
Published in final edited form as: Science. 2002 Oct 18;298(5593):572–576. doi: 10.1126/science.1074887
Abstract
The mammalian eye is a remarkable optical device, but its design is not perfect. The blood vessels that supply the inner retina are located in front of the photoreceptor layer, blocking access to light. Their shadows create a pattern of blindness in the field of vision that corresponds precisely to the location of the largest vessels in the eye. We show here that in squirrel monkeys, focal deprivation by blood vessels leads to rewiring of the eye’s geniculocortical projections, imprinting an image of the retinal vascular tree onto the primary visual cortex. This process illustrates vividly that local imbalances in neuronal activity can influence column formation during normal development.
In many higher species, the geniculate afferents serving right and left eyes are segregated in the brain in layer 4 of primary (striate, V1) visual cortex into a mosaic of interdigitated inputs called ocular dominance columns (1). The formation of these columns has been scrutinized in the hope of elucidating the processes that guide the development of the cerebral cortex (2). Some experiments show an essential role for neuronal activity, because infusion of tetrodotoxin into both eyes seems to prevent the emergence of ocular dominance columns (3). According to this idea, the correlated discharge of neighboring ganglion cells, perhaps generated by spontaneous waves of retinal activity (4, 5), induces local cortical imbalances in the density of geniculate afferents driven by each eye. These small imbalances may be amplified by competitive synaptic interactions between geniculocortical afferents to generate a mature system of ocular dominance columns (6-9).
Doubt has been cast on this explanation for column development by recent experiments showing that ocular dominance columns appear in ferrets despite early bilateral enucleation (10). This finding suggests that column formation is ordained by intrinsic molecular cues, and not by patterns of neuronal activity. Although neuronal activity has a disputed role in column induction, it certainly can influence column morphology at a later stage in development. Raising a newborn animal with monocular eyelid suture, to mimic congenital cataract, causes shrinkage of the deprived eye’s columns and expansion of the normal eye’s columns (11-14). Here, an imbalance in neuronal activity has a profound influence on the shape and size of the ocular dominance columns. The relevance of these experiments, however, can be questioned on the grounds that suture of the eyelids is an artificial manipulation, creating an extreme imbalance in the stimulation of each retina. It has not been shown that under natural circumstances, competition between the two eyes has an important influence on the appearance of the ocular dominance columns.
Cortical representation of retinal vessels
We now show that visual deprivation occurs routinely in normal primates, affecting ocular dominance patterns. Helmholtz discovered while plotting his blind spot that he could discern the proximal stumps of large blood vessels emerging from the optic disc (15). With refinement of perimetric techniques, subsequent investigators have plotted these so-called angioscotomas over wide portions of the visual field (16, 17). The hemoglobin in red blood cells absorbs light, casting a shadow from blood vessels in the inner retina onto photoreceptors located underneath. We have found a representation of angioscotomas in striate cortex of the squirrel monkey (Saimiri sciureus).
The squirrel monkey was reported originally to lack ocular dominance columns (18, 19). They are present, in fact, but often appear poorly developed and irregular (20). To examine their pattern more closely, we enucleated one eye and stained striate cortex for the mitochondrial enzyme cytochrome oxidase (CO) (21-23). The ocular dominance columns are revealed by this approach because metabolic activity is reduced in the missing eye’s columns. After perfusion, striate cortex was stripped from the white matter, flattened in a single piece, and sectioned tangentially to the surface. Flatmount preparations enhance the likelihood of detecting subtle metabolic patterns, such as the optic disc representation, which lies buried in the calcarine sulcus (24).
Ocular dominance is expressed most strongly in layer 4C of striate cortex. CO montage of this layer revealed a fuzzy pattern of fine ocular dominance columns (Fig. 1). The left eye’s optic disc representation appeared as a large, homogeneous zone of CO activity in the right cortex. It stained darkly, because the left eye was enucleated in this animal. In the periphery, a large pale zone corresponded to the representation of the far nasal retina of the left eye (monocular crescent).
Fig. 1.
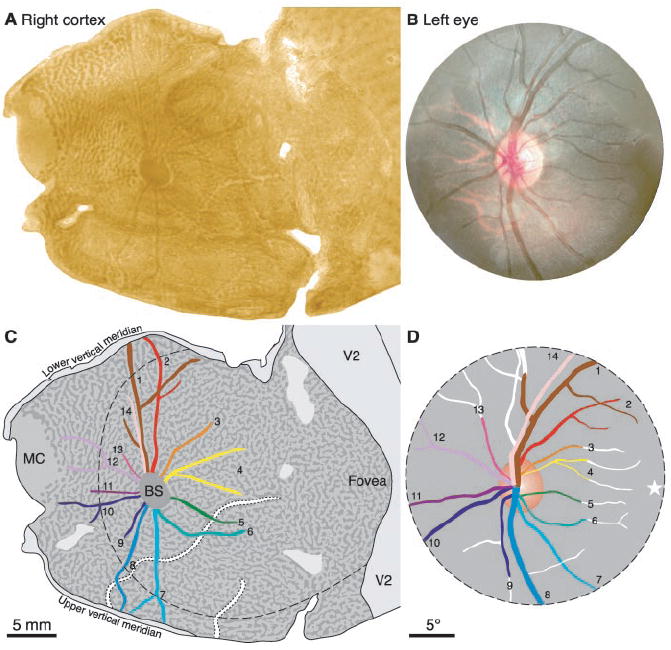
Representation of angioscotomas in striate cortex. (A) Flatmount montage stained for CO after removal of the left eye to reveal the ocular dominance columns. The dark lines emerging from the central dark oval correspond to the blood vessels of the left eye. (B) Fundus photograph showing optic disc and retinal blood vessels. (C) Drawing of vessel representations, color-coded to match the retinal drawing. Dashed line denotes circumference of retinal photograph in (B), projected onto the cortex. MC, monocular crescent; BS, blind spot. (D) Drawing of retina, with represented portions of vessels coded by color. Star denotes the fovea.
Radiating from the optic disc representation were more than a dozen, thin, dark profiles. They represented the blood vessels emanating from the optic disc of the left eye. This was confirmed by matching each element in the cortical pattern to its corresponding retinal blood vessel (Fig. 1, C and D).
How do angioscotoma representations form?
Angioscotoma representations cannot form before birth, because the uterine environment is dark. We propose that after birth (Fig. 2A), the right cortex, for instance, receives binocular input organized into nascent columns, except at the representation of the left optic disc, where input comes exclusively from the right eye. Once the baby monkey opens its eyes (Fig. 2B), light enters through the pupil and shadows are cast by retinal blood vessels. Ganglion cells in the left eye that receive input from photoreceptors beneath blood vessels are not driven effectively by visual stimulation. In turn, these ganglion cells fail to activate lateral geniculate neurons. Consequently, the axon terminals of these geniculate fibers retract in striate cortex, and the territory they relinquish is taken over by afferents serving the right eye. After the critical period, geniculocortical afferents become frozen in place. When one eye is enucleated (Fig. 2C), CO reveals the ocular dominance columns, which have been rearranged to correspond to the cortical representation of retinal blood vessels.
Fig. 2.
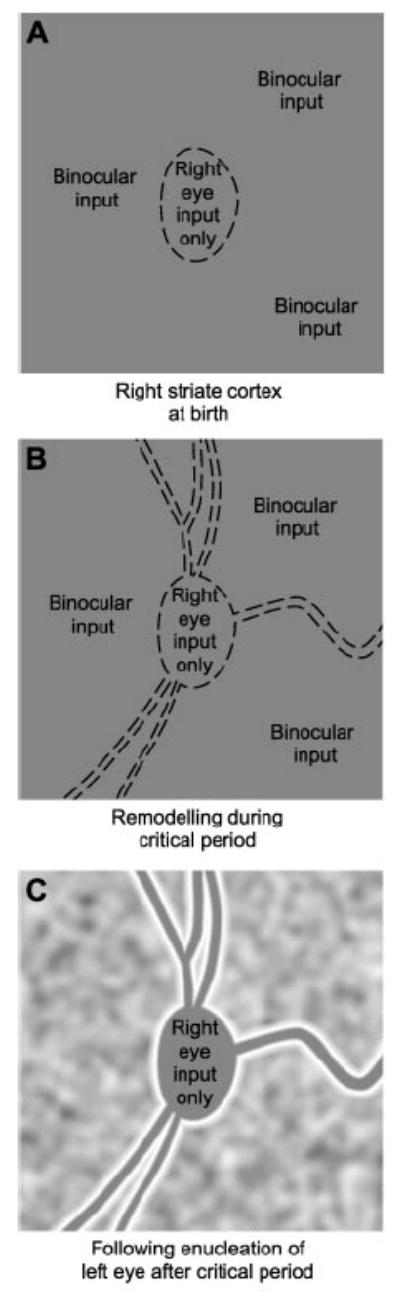
CO staining of angioscotoma representations. (A) At birth, CO staining is uniform. Angioscotomas are absent, but the right eye already monopolizes the left eye’s blind spot representation. (B) After light exposure, vessels begin to cast shadows, generating angioscotoma representations. Their pattern becomes immutable at the end of the critical period. (C) Removal of one eye induces an undulating pattern of CO activity, corresponding to the ocular dominance columns. The angioscotomas appear silhouetted against this textured background, because they stain solidly. Note the tendency for the other eye to “frost” the vessel and blind spot representations.
To confirm this hypothesis, we double-labeled the ocular dominance columns in this animal (and two others) by injecting an anatomical tracer, [3H]proline, into the remaining right eye (25, 26). The proline and CO patterns were identical (compare Figs. 1A and 3). As expected, the angioscotoma representations in striate cortex were solidly labeled, as intensely as the blind spot representation (Fig. 2C). This experiment proved that cortical angioscotoma representations are generated by anatomical rearrangement of geniculocortical inputs. It should be emphasized that in three control animals, with intact vision in both eyes, no CO pattern was visible in layer 4C. Removal of one eye is required to reveal the cortical angioscotoma representations with CO.
Fig. 3.
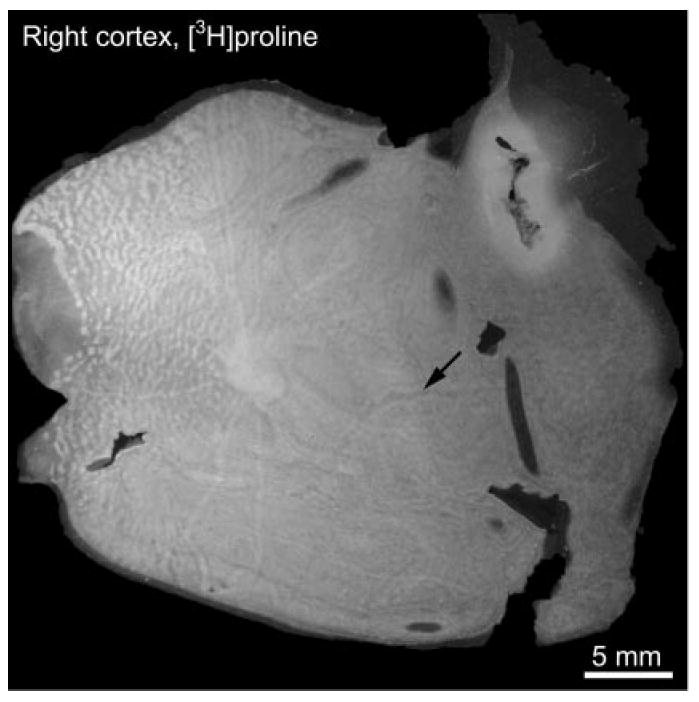
Autoradiograph prepared after tracer injection into the remaining right eye, showing label (bright regions) distributed in a pattern identical to that in Fig. 1A. The congruence of the patterns confirms that CO staining after monocular enucleation precisely reflects the distribution of geniculocortical inputs. The angioscotomas and the blind spot are solidly labeled, as predicted in Fig. 2C. Arrow denotes an unlabeled angioscotoma, arising from a temporal vessel in the right eye.
Angioscotomas were represented in striate cortex of 9 of 12 squirrel monkeys. Shadows generated in the contralateral eye predominated, because blood vessels are generally larger in nasal retina, especially near the optic disc. A few vessel representations, however, could be traced across the vertical meridian (V1/V2 border) and into the opposite cortex (Figs. 3 and 4). Their contrast was reversed, compared with other angioscotomas in the same cortex, because they originated from the temporal retina of the ipsilateral eye.
Fig. 4.

Vessels in nasal, compared with temporal, retina are represented more extensively. (A) Retinal photomontage. (B) CO staining after enucleation of the right eye. Most angioscotomas are dark, because they represent vessels of the right eye’s nasal retina, but a few are pale, representing the left eye’s temporal retina. (C) Drawing of the right fundus. The dotted lines outline the left eye’s blind spot and major inferior fundus vessels (see retinal montage, inset). Their temporal segments account for the two pale angioscotoma representations visible in the lower left cortex. (D) Drawing of CO pattern. Abbreviations as in Fig. 1.
Each angioscotoma representation was fringed by cortex that exhibited opposite CO contrast (Fig. 5). This “frosting” enhanced the visibility of the angioscotoma pattern by highlighting each vessel representation. Apparently, when retraction of geniculate afferents occurs during the critical period, the displaced afferents form a solid phalanx along the edges of the representation of each angioscotoma. The displaced afferents dominate in these flanking zones, expelling those from the other eye. This is noteworthy, because neither eye enjoys any obvious competitive advantage in visual stimulation right next to an angioscotoma.
Fig. 5.
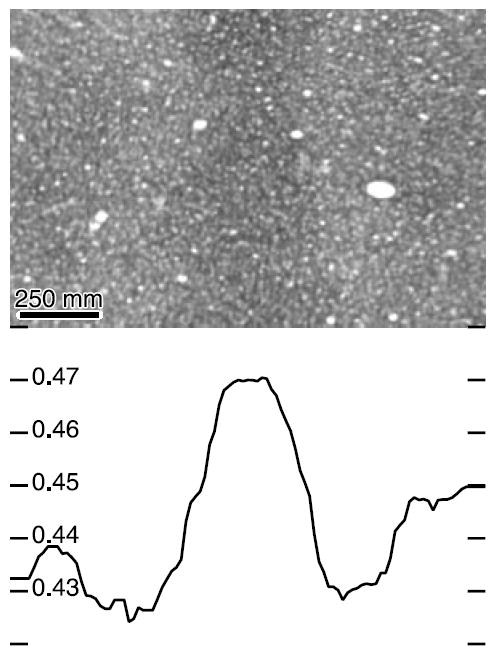
Vessel representations are flanked by CO activity of opposite contrast. A vertically oriented dark angioscotoma representation (Fig. 4D) is surrounded by pale staining. Mean optical density of each column of pixels is plotted below.
Precision of the visual field representation
The biggest vessels represented in the cortex were retinal veins near the optic disc. They attained a diameter of nearly 100 μm (0.62°). The smallest were vessels approaching the fovea, less than 30 μm wide (0.17°). To calculate shadow widths, we measured exit pupil diameter, distance from exit pupil to retinal vessel, retinal vessel diameter, and distance from retinal vessel to photoreceptors (27, 28). Many smaller vessels failed to eclipse the pupil completely and therefore produced no umbra. For example, a 28-μm-diameter vessel 7.5° from the fovea cast only penumbra, measuring 83 μm in width (Fig. 6). From an expression for cortical magnification factor along an isoeccentricity ring (derived below), we calculated that an 83-μm shadow should produce a cortical representation 737 μm wide. In fact, the vessel’s cortical profile measured only 350 μm (see vessel 11, Fig. 4D), indicating that just the central ~50% of the shadow was sufficiently dense to induce remodeling of geniculocortical afferents. This portion of the shadow was only three to four cones wide.
Fig. 6.
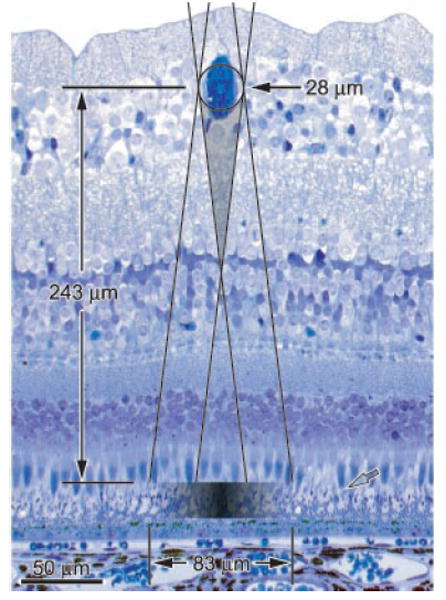
Optics of shadow formation. Toluidine blue–stained retinal cross section (Fig. 4C), showing the shadow cast by a blood vessel in the ganglion cell layer with a 28-μm lumen diameter, when fully inflated. Pairs of lines, projected from opposite margins of a 1.9-mm pupil located 8.4 mm in front of the retina, show the boundaries of the shadow obscuring photoreceptors. The umbra (gray triangle) does not reach the photoreceptor layer in this example, because the vessel is too small. Gradient indicates penumbra, which reached a maximum optical density of 0.45. Open arrow shows the light-recipient boundary between cone inner and outer segments.
Generation of a retinotopic map
The angioscotoma representations provided a simple means for construction of a visual field map in striate cortex (Fig. 7). First, dozens of prominent landmarks, such as vessel crossings or bifurcations, were identified in the retina and projected onto a tangent screen to determine their eccentricity. These data were used to calibrate a system of rings and rays, which was superimposed on an image of the nasal retina. This image was transformed by computer to match retinal features precisely to their cortical representation (29), thereby generating a retinotopic map. This map is truly retinotopic, as opposed to visuotopic, and therefore immune to errors introduced by eye movements or inaccurate plotting of receptive fields (30).
Fig. 7.
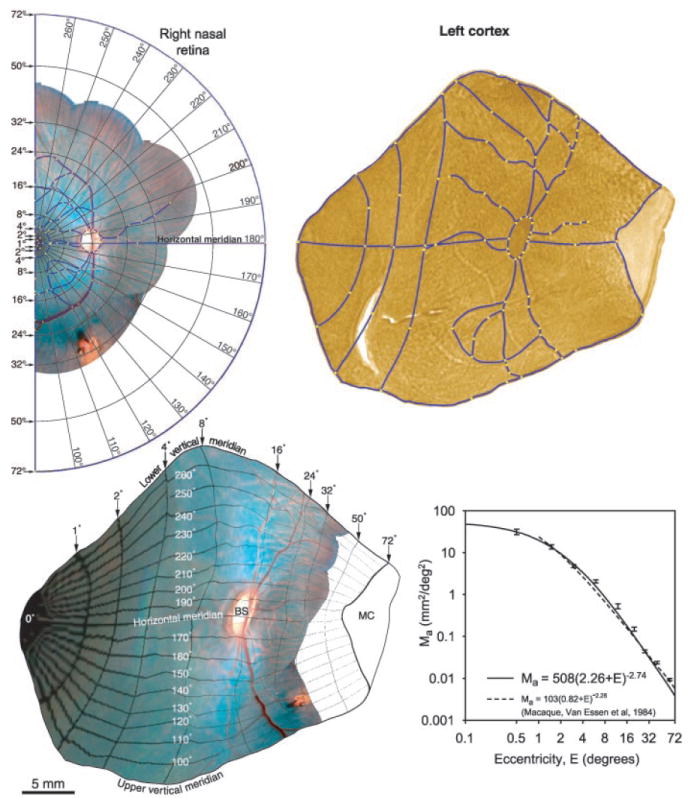
Generation of a retinotopic map. Ring and ray pattern is superimposed on the right retina, using landmarks plotted in vivo. Correspondence points (yellow squares) are placed on matching features of the retina and cortex. Blue lines are placed on segments between correspondence points. They include blood vessels, vertical meridian (V1/V2) border, horizontal meridian, and the boundary between binocular and monocular cortex (measured in vivo at 72°). Warping of the retina onto the cortex produces a retinotopic map. Areal cortical magnification factor (mean ± SEM) for four cortices is graphed versus eccentricity.
Areal cortical magnification factor, _M_a, was derived by measuring the area (mm2) of each compartment in the map and dividing by the area (degrees squared) of its corresponding visual field zone. The data were plotted as a function of eccentricity (Fig. 7D) for four hemispheres from two monkeys. Cortical magnification factor in the squirrel monkey was similar to the value reported in the macaque (31), showing that these evolutionarily divergent primate species emphasize macular vision to the same extent.
Discussion
Retinal blood vessels give rise to angioscotomas in the visual field, just as the optic disc creates a blind spot. However, the mechanism is quite different. The optic disc produces a hole, devoid of ganglion cells, in the fabric of the retina. The other eye fills in the cortical gap, visible as a solid oval amid a sea of ocular dominance columns. This occurs in utero, before visual experience has any influence (32).
Angioscotomas, on the other hand, arise because a few photoreceptors are condemned to a life of idleness owing to their location beneath blood vessels. The retina is otherwise normal. Deprivation by vascular shadows induces local remodeling of geniculate afferents, in a cortical distribution that corresponds to the trajectory of blood vessels within the retina. The process is analogous to amblyopia induced by a congenital cataract. A lens opacity, however, provokes global shrinkage of geniculate afferents in the cortex (33). Our results show that amblyopia can be exquisitely focal within an eye. It probably occurs underneath retinal blood vessels in primates other than squirrel monkeys, including humans.
Angioscotoma representations in the cortex provide a natural example of how visual activity can influence the pattern formed by ocular dominance columns. They are essentially nothing more than long, threadlike ocular dominance columns, generated because deprivation in one eye tips the local competition for cortical territory in favor of the other eye. The deprived eye is compensated by preferential assignment of the closest adjacent territory—as reflected by the “frosting” lining the angioscotoma representations (Fig. 5). This phenomenon presumably reflects an innate tendency to allot cortical territory in a reciprocal manner (6-8, 34, 35). The global periodicity of the columns resulting from this process is probably under genetic control (36). However, our data show that local imbalances in neuronal activity can determine the precise layout of the columns in any given region of cortex.
We have searched in vain for angioscotoma representations in striate cortex of the macaque and human. In general, these species have larger ocular dominance columns than squirrel monkeys. In the macaque, we have projected the retinal vasculature onto striate cortex, to compare the predicted size of individual vessel representations with the width of ocular dominance columns. The ocular dominance columns are much larger. We speculate that because the columns are larger, their pattern is resistant to the influence of angioscotomas during development. In the macaque, the amount of cortex deprived by angioscotomas is simply too small to compel the rearrangement of ocular dominance columns. Nonetheless, shouldn’t an angioscotoma carve a narrow swath through any column, no matter how big? Apparently, this is prevented by the higher degree of segregation of geniculocortical afferents in macaques, compared with squirrel monkeys. In squirrel monkeys, the fine grain and weak segregation of the ocular dominance columns create perfect conditions for the formation of angioscotoma representations.
Amblyogenic shadows just a few cones wide were represented in the cortex, reflecting the remarkable precision of the visual field map in layer 4C (37). In other layers, angioscotomas were not visible, because of the coarser resolution of the visual field map and the intermingling of ocular channels. The representation of angioscotomas was most extensive at eccentricities from 4° to 30°. Within this range, an ideal balance exists between cortical magnification factor and blood vessel size. Beyond 30°, vessel size and magnification factor both decrease, so most angioscotoma representations disappear. Toward the fovea, blood vessels rapidly taper. Their reduction is offset by a steep rise in cortical magnification factor, but nevertheless, angioscotoma representations abruptly peter out at 3° to 4°. This occurs because vessels near the fovea contain too little blood to cast a sufficiently dense shadow.
Angioscotomas are rarely noticed in our vision because they are filled in perceptually, just like the blind spot. Remarkably, angioscotomas amount collectively to a greater portion of the visual field than the blind spot. Nature has struck a compromise in the design of the eye, by allowing blood vessels to obscure some photoreceptors. At least the largest vessels in the retina are prohibited from approaching the fovea, so that we are scarcely aware of their presence.
Acknowledgments
This work was supported by the National Eye Institute (grant R01 EY10217 and core grant EY02162), That Man May See, The Bunter Fund, and a Lew W. Wasserman Merit Award from Research to Prevent Blindness. We thank D. Hocking and I. Wood for help with tissue processing and R. Troyer for assistance with animal care and surgery. We thank the California Regional Primate Research Center, which is supported by NIH Base Grant RR00169. L. Sincich, N. Swindale, and G. Westheimer provided valuable comments on the manuscript.
References and Notes
- 1.Hubel DH, Wiesel TN. Nature. 1969;221:747. doi: 10.1038/221747a0. [DOI] [PubMed] [Google Scholar]
- 2.Katz LC, Shatz CJ. Science. 1996;274:1133. doi: 10.1126/science.274.5290.1133. [DOI] [PubMed] [Google Scholar]
- 3.Stryker MP, Harris WA. J Neurosci. 1986;6:2117. doi: 10.1523/JNEUROSCI.06-08-02117.1986. [DOI] [PMC free article] [PubMed] [Google Scholar]
- 4.Meister M, Wong ROL, Baylor DA, Shatz CJ. Science. 1991;252:939. doi: 10.1126/science.2035024. [DOI] [PubMed] [Google Scholar]
- 5.Mooney R, Penn AA, Gallego R, Shatz CJ. Neuron. 1996;17:863. doi: 10.1016/s0896-6273(00)80218-4. [DOI] [PubMed] [Google Scholar]
- 6.von der Malsburg C, Willshaw DJ. Exp Brain Res Suppl. 1976;1:463. [Google Scholar]
- 7.Swindale NV. Proc R Soc London Ser B. 1980;208:243. doi: 10.1098/rspb.1980.0051. [DOI] [PubMed] [Google Scholar]
- 8.Miller KD, Keller JB, Stryker MP. Science. 1989;245:605. doi: 10.1126/science.2762813. [DOI] [PubMed] [Google Scholar]
- 9.Goodhill GJ. Network. 1998;9:419. [PubMed] [Google Scholar]
- 10.Crowley JC, Katz LC. Nature Neurosci. 1999;2:1125. doi: 10.1038/16051. [DOI] [PubMed] [Google Scholar]
- 11.Hubel DH, Wiesel TN, LeVay S. Philos Trans R Soc London Ser B. 1977;278:377. doi: 10.1098/rstb.1977.0050. [DOI] [PubMed] [Google Scholar]
- 12.Shatz CJ, Stryker MP. J Physiol (London) 1978;281:267. doi: 10.1113/jphysiol.1978.sp012421. [DOI] [PMC free article] [PubMed] [Google Scholar]
- 13.Swindale NV, Vital-Durand F, Blakemore C. Proc R Soc London Ser B. 1981;213:435. doi: 10.1098/rspb.1981.0074. [DOI] [PubMed] [Google Scholar]
- 14.Crair MC, Ruthazer ES, Gillespie DC, Stryker MP. Neuron. 1997;19:307. doi: 10.1016/s0896-6273(00)80941-1. [DOI] [PubMed] [Google Scholar]
- 15.von Helmholtz H. Handbook of Physiological Optics. Vol. 2. Optical Society of America; Menasha, WI: 1924. p. 28. [Google Scholar]
- 16.Evans JN. Am J Ophthalmol. 1926;9:489. [Google Scholar]
- 17.Schieferetal U, et al. Vision Res. 1999;39:1897. [Google Scholar]
- 18.Livingstone MS. J Neurosci. 1996;16:2086. doi: 10.1523/JNEUROSCI.16-06-02086.1996. [DOI] [PMC free article] [PubMed] [Google Scholar]
- 19.Hendrickson AE, Wilson JR, Ogren MP. J Comp Neurol. 1978;182:123. doi: 10.1002/cne.901820108. [DOI] [PubMed] [Google Scholar]
- 20.Horton JC, Hocking DR. J Neurosci. 1996;16:5510. doi: 10.1523/JNEUROSCI.16-17-05510.1996. [DOI] [PMC free article] [PubMed] [Google Scholar]
- 21.Experiments were performed on 12 adult squirrel monkeys from the California Regional Primate Center, Davis, CA. All procedures were approved by the University of California, San Francisco, Committee on Animal Research. Each animal was anesthetized with 2% isoflurane and paralyzed with succinylcholine (45 mg/kg, intravenously). The animal was placed in a stereotaxic frame mounted on a tripod to orient the visual axis perpendicular to a large tangent screen. Photographs were taken of both retinae and landmarks were projected onto a tangent screen with a fundus camera to pinpoint their eccentricity. Retinal magnification factor was 161 μm per degree in the central 24°. One eye was then enucleated under sterile conditions. Buprenorphine (0.03 mg/kg) was administered for 48 hours after surgery for analgesia. After a survival time of at least 10 days, the animal was killed with sodium pentobarbital (150 mg/kg) and perfused with 1% paraformaldehyde. Flatmounts were cut at 30 to 40 μm, air-dried on slides, reacted for CO, and montaged with Photoshop 6.0.
- 22.Wong-Riley MTT. Brain Res. 1979;171:11. doi: 10.1016/0006-8993(79)90728-5. [DOI] [PubMed] [Google Scholar]
- 23.Horton JC. Philos Trans R Soc London Ser B. 1984;304:199. doi: 10.1098/rstb.1984.0021. [DOI] [PubMed] [Google Scholar]
- 24.Horton JC, Hocking DR. J Neurosci. 1996;16:7228. doi: 10.1523/JNEUROSCI.16-22-07228.1996. [DOI] [PMC free article] [PubMed] [Google Scholar]
- 25.Two millicuries of l-[2,3,4,5-3H]proline were reconstituted in 20 μl of saline and injected into the vitreous of one eye. Alternate cortical sections were processed for CO or autoradiography.
- 26.Wiesel TN, Hubel DH, Lam DMK. Brain Res. 1974;79:273. doi: 10.1016/0006-8993(74)90416-8. [DOI] [PubMed] [Google Scholar]
- 27.Applegate RA, Bradley A, van Heuven WA. Invest Ophthalmol Vis Sci. 1990;31:2088. [PubMed] [Google Scholar]
- 28.Entrance pupil size was measured by photography with a 100-mm macro-lens in five squirrel monkeys aged 1 week; it was 1.9 ± 0.03 mm (SEM), with a range of 1.7 to 2.0 mm. This value was used for exit pupil size, because for small pupils, the difference between entrance and exit pupil size is negligible. Distance from pupil to retina was measured in three newborn squirrel monkeys with A-mode ultrasound; it was 8.4 ± 0.12 mm (SEM). Adult retinae were sectioned at 1 μm in Epon-Araldite and the lumen diameter of identified blood vessels was measured. Distance from retinal vessel to photoreceptors was also measured in these sections. Correction was made for retinal growth and tissue shrinkage.
- 29.About 50 to 100 correspondence points were used to warp the nasal retina onto the cortex, using Elastic Reality 3.0 (www.avid.com). No angioscotoma representations were present centrally, so points were obtained from Cowey’s microelectrode mapping of the central 4° (30). Linear cortical magnification factor along polar rays (_M_p) and along eccentricity rings (_M_e) were calculated independently: _M_p = 9.5 (0.95 + E)−1.03 and _M_e = 188 (6.45 + E)−1.85, where E is eccentricity.
- 30.Cowey A. J Neurophysiol. 1964;27:366. doi: 10.1152/jn.1964.27.3.366. [DOI] [PubMed] [Google Scholar]
- 31.Van Essen DC, Newsome WT, Maunsell JH. Vision Res. 1984;24:429. doi: 10.1016/0042-6989(84)90041-5. [DOI] [PubMed] [Google Scholar]
- 32.Horton JC, Hocking DR. J Neurosci. 1996;16:1791. doi: 10.1523/JNEUROSCI.16-05-01791.1996. [DOI] [PMC free article] [PubMed] [Google Scholar]
- 33.Horton JC, Hocking DR. J Neurosci. 1997;17:3684. doi: 10.1523/JNEUROSCI.17-10-03684.1997. [DOI] [PMC free article] [PubMed] [Google Scholar]
- 34.Jones DG, Van Sluyters RC, Murphy KM. J Neurosci. 1991;11:3794. doi: 10.1523/JNEUROSCI.11-12-03794.1991. [DOI] [PMC free article] [PubMed] [Google Scholar]
- 35.Goodhill GJ. Biol Cybern. 1993;69:109. doi: 10.1007/BF00226194. [DOI] [PubMed] [Google Scholar]
- 36.Kaschube M, Wolf F, Geisel T, Löwel S. J Neurosci. 2002;22:7206. doi: 10.1523/JNEUROSCI.22-16-07206.2002. [DOI] [PMC free article] [PubMed] [Google Scholar]
- 37.Blasdel GG, Fitzpatrick D. J Neurosci. 1984;4:880. doi: 10.1523/JNEUROSCI.04-03-00880.1984. [DOI] [PMC free article] [PubMed] [Google Scholar]