Integrative analysis of environmental sequences using MEGAN4 (original) (raw)
Abstract
A major challenge in the analysis of environmental sequences is data integration. The question is how to analyze different types of data in a unified approach, addressing both the taxonomic and functional aspects. To facilitate such analyses, we have substantially extended MEGAN, a widely used taxonomic analysis program. The new program, MEGAN4, provides an integrated approach to the taxonomic and functional analysis of metagenomic, metatranscriptomic, metaproteomic, and rRNA data. While taxonomic analysis is performed based on the NCBI taxonomy, functional analysis is performed using the SEED classification of subsystems and functional roles or the KEGG classification of pathways and enzymes. A number of examples illustrate how such analyses can be performed, and show that one can also import and compare classification results obtained using others' tools. MEGAN4 is freely available for academic purposes, and installers for all three major operating systems can be downloaded from www-ab.informatik.uni-tuebingen.de/software/megan.
In metagenomics, the aim is to understand the composition and operation of complex microbial assemblages in environmental samples through sequencing and analysis of their DNA. Similarly, metatranscriptomics and metaproteomics target the RNA and proteins obtained from such samples. In the case of DNA sequencing, one can distinguish between amplicon sequencing, which involves PCR-targeted sequencing of a specific locus, often 16S rRNA (Pace et al. 1985), and random shotgun sequencing of genomic DNA (Handelsman et al. 1998). Typical sources of environmental sequences are water (Rusch et al. 2007), soil (Urich et al. 2008), extreme environments (Tringe et al. 2005), ancient bones (Poinar et al. 2006), the human body (Turnbaugh et al. 2007), or the digestive tract of humans or animals (Turnbaugh et al. 2006; Qin et al. 2010). Advances in sequencing technology are fueling a rapid increase in the number and size of environmental sequencing projects.
In the analysis of such data sets, three main computational questions are: What is the taxonomic content of a sample; what is the functional content of a sample; and how do different samples compare?
One way to address these questions is to use a homology-based approach, which is based on comparing the sequencing reads against a reference database such as the NCBI-NR database of nonredundant protein sequences (Benson et al. 2005), usually employing a variant of the program BLAST (Altschul et al. 1990). The result of this extensive computation is a set of high-scoring pairs or matches that represent possible homologies between genes in the data set and genes in the reference database. This must then be analyzed so as to obtain a taxonomic profile and/or functional profile for the input data.
In an article by Huson et al. (2007), we published the first stand-alone interactive tool for determining the taxonomic content of a short-read metagenome data set, called MEGAN. The program takes the result of a BLAST comparison as input and produces a taxonomic classification of the reads as output. In more detail, MEGAN bases its taxonomic classification on the NCBI taxonomy, which is a hierarchically structured classification of all species that are represented at NCBI, now containing more than 670,000 nodes. Taxonomic analysis is performed by placing each sequence read onto a node of the NCBI taxonomy, based on gene content. For each read that matches the sequence of some gene, the program places the read on to the lowest common ancestor (LCA) node of those species in the taxonomy that are known to have that gene. This is called the LCA algorithm. Due to the simplicity of the LCA algorithm and the ease of use of the program, MEGAN is widely used for taxonomic binning, even for very large data sets (Qin et al. 2010).
There are several other tools that also employ a homology-based approach, such as MG-RAST (Glass et al. 2010), WebCARMA (Gerlach et al. 2009), IMG/M (Markowitz et al. 2006), and CAMERA (Seshadri et al. 2007). The Galaxy framework supports basic metagenomic analyses (Kosakovsky Pond et al. 2009). An alternative to using a homology-based approach is to employ a machine-learning method that uses simple signatures of the reads, as implemented in TETRA (Teeling et al. 2004), PhyloPythia (McHardy et al. 2007), and GSOM/S-GSOM (Chan et al. 2008). More recent tools include Phymm (Brady and Salzberg 2009) and NBC (Rosen et al. 2010). There are a number of tools that focus primarily on the analysis and comparison of 16S and 18S data, such as DOTUR (Schloss and Handelsman 2005), MOTHUR (Schloss et al. 2009), SILVA (Pruesse et al. 2007), RDP (Cole et al. 2009), and EstimateS (Colwell 2009). More recent tools include MLtreemap (Stark et al. 2010), UniFrac (Lozupone et al. 2010), QIIME (Caporaso et al. 2010), and pplacer (Matsen et al. 2010).
A major challenge in the analysis of environmental sequences is data integration, that is, the question of how to analyze different types of data in a unified approach, addressing both taxonomic and functional analysis. To tackle this problem, we have rewritten our program MEGAN so as to produce a new program, MEGAN4, with the aim of integrating the taxonomic and functional analysis of metagenomic, metatranscriptomic, metaproteomic, and rRNA data. While taxonomic analysis is performed based on the NCBI taxonomy, functional analysis can be performed by MEGAN4 using the SEED classification (Overbeek et al. 2005) and also the KEGG classification (Kanehisa and Goto 2000).
Results
MEGAN4 as an integrative platform
The aim of MEGAN4 is to facilitate the integrative analysis of environmental sequence data. The software goes beyond taxonomic analysis and allows the functional analysis of environmental sequencing data sets, using both the SEED classification of functional roles and subsystems (Overbeek et al. 2005) and also the KEGG (Kyoto Encyclopedia of Genes and Genomes) classification of enzymes and pathways (Kanehisa and Goto 2000). In the SEED classification, genes are mapped to functional roles, which are grouped into biological subsystems. Similarly, in the KEGG classification, genes are mapped to KEGG orthology groups, which, in turn, are mapped to enzymes that are present in different pathways.
Both the SEED and the KEGG classification can each be represented hierarchically as a tree with about 13,000 nodes. MEGAN4 attempts to place the sequencing reads onto the leaves of the trees using the best-matching reference genes for which a functional role or enzyme is known. The user can interact with the tree representations to summarize the results at different levels of the classification or to inspect or extract all reads assigned to a specific node. Moreover, one can interactively view KEGG pathways in which the participating enzymes are annotated by information on the individual reads that the program has mapped to them.
An additional feature of MEGAN4 is that it supports the analysis of amplicon data sets targeting rRNA. To use this feature, the amplicon sequences must first be compared against the SILVA rRNA database (Pruesse et al. 2007) using BLASTN. The output of this comparison is then parsed by MEGAN4 and mapped onto the NCBI taxonomy using the LCA algorithm. Alternatively, the program allows one to import the result of an analysis computed directly on the SILVA website or the RDP website (Cole et al. 2009). It is also possible to import a OTU table produced by the QIIME package.
With MEGAN4, one can perform an integrated analysis of metagenomic, metatranscriptomic, metaproteomic, and rRNA data in a uniform manner, obtaining a single view of the taxonomic or functional content of different types of data. To help deal with the increasing size of data sets, the program allows reads and BLAST results to be partitioned over multiple input files. To speed up the BLAST computation, MEGAN4 supports a hybrid approach in which a fast taxonomic classification tool such as NBC (Rosen et al. 2010) is used first to sort reads into different taxonomic groups at, for example, the taxonomic rank of “Order.” Then the computationally expensive BLAST comparison need only be performed against reference sequences from the assigned “Order.”
MEGAN4 uses a compressed binary file format to store and access data. Alternatively, MEGAN4 can also be configured to communicate with a PostgreSQL database, running either locally or on a server. Finally, MEGAN4 is fully multithreaded, and different calculations can be performed simultaneously in different windows on a multicore machine.
MEGAN4 can be run either in interactive mode or in command-line mode. While the main use of the command-line mode is to generate the initial MEGAN4 file on a server, it is possible to use all other aspects of the program in this mode as well. For example, one can direct the program to first open a specific data set, then open the KEGG viewer, then open a specific KEGG pathway, and lastly generate and save an image of the KEGG pathway indicated by the data set.
Application to multiple types of data
To illustrate the use of MEGAN4 as an integrative tool, we compare a number of different data sets from two published marine studies, namely a metagenome (called DNA-Time1-Bag1, with 209,073 reads) and a metatranscriptome (called cDNA-Time1-Bag1, with 131,089 reads) from Gilbert et al. (2008), and a 16S rRNA data set (849 reads) and a metaproteome (8073 sequences) from Morris et al. (2010). The metagenome, metatranscriptome, and metaproteome data sets were blasted against NCBI-NR, whereas the 16S rRNA data set was blasted against the SILVA database (Pruesse et al. 2007). In addition, we imported the result of the analysis of the metaproteome data set that was presented in (Morris et al. 2010). This result was obtained in two steps by first comparing mass-spectrometry data against marine metagenome sequences from the Global Ocean Survey (Rusch et al. 2007) and then blasting the matching sequences against the CAMERA database (Seshadri et al. 2007).
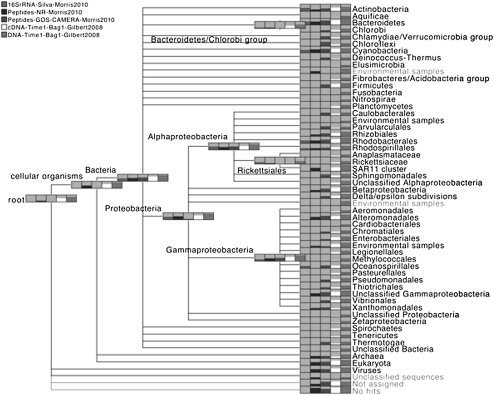
All five data sets were processed by MEGAN4, and the resulting taxonomic analysis is shown in Figure 1. In general, such a depiction shows the comparison of a number of data sets, the names of which are listed in the top left corner, using a tree representation of a part of the NCBI taxonomy. Each node represents a taxon and is drawn as a gray box that contains a bar chart indicating how many reads were assigned to the corresponding taxon, for each of the data sets, on a logarithmic scale. The exact numbers are displayed to the user when the mouse is placed over such a node. This example shows a high-level summary of the number of reads assigned to nodes down to the rank of Phylum or Order. In practice, a researcher will then move down the taxonomy by repeatedly expanding nodes to focus on areas of the taxonomy of particular interest.
Figure 1.
MEGAN4 integrative taxonomic analysis of a 16S rRNA data set (labeled “16SrRNA-Silva-Morris2010”) and two different analyses of a metaproteome (labeled “Peptides-NR-Morris2010, and Peptides-GOS-CAMERAMorris2010”), all from Morris et al. (2010), combined with a metatranscriptome and metatranscriptome from Gilbert et al. (2008) (labeled “cDNA-Time1-Bag1-Gilbert2008 and DNA-Time1-Bag1-Gilbert2008,” respectively). The results labeled Peptides-NR-Morris2010 were obtained by a MEGAN analysis based on a comparison against the NR database, whereas those labeled Peptides-GOS-CAMERA-Morris2010 were imported from Morris et al. (2010). We display the NCBI taxonomy down to the rank of Phylum and in some parts of the Proteobacteria, down to the rank of Order. In such MEGAN4 diagrams, each taxon is displayed as a gray rectangle that contains a bar chart indicating the number of reads assigned to the taxon, on a logarithmic scale.
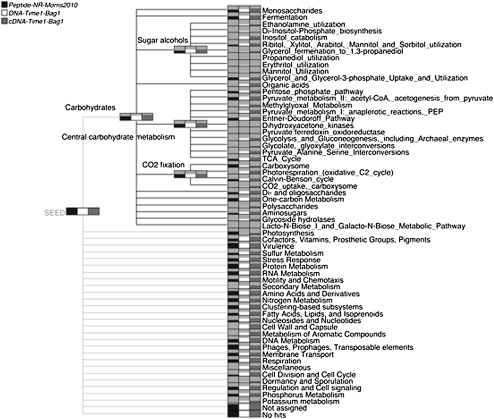
In Figure 2, we show a functional analysis of the metaproteome, metatranscriptome, and metagenome data sets based on the SEED classification. The nodes in this figure represent different types of subsystems and are drawn as bar charts to indicate the number of reads assigned to each subsystem, in the same way as described above for a taxonomic comparison. The carbohydrates part of the classification has been expanded to show some of the subsystems related to carbohydrates. The metaproteome data set covers fewer functional categories than the other two data sets simply because it is much smaller in size.
Figure 2.
MEGAN4's integrative functional analysis (using SEED) of a metaproteome (Morris et al. 2010), metatranscriptome, and metagenome (Gilbert et al. 2008), labeled “Peptides-NR-Morris2010,” “DNA-Time1-Bag1-Gilbert2008,” and “cDNATime1-Bag1-Gilbert2008,” respectively. The classification tree has been partially expanded to show some details of the subsystems below the Carbohydrates node.
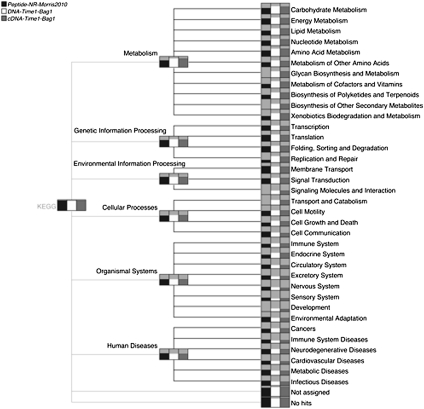
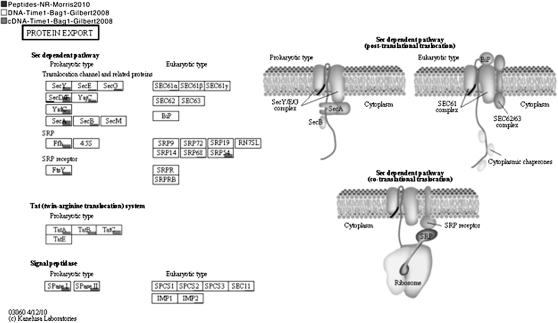
The KEGG classification can be depicted by MEGAN4 in a similar fashion (Fig 3). Pathways related to human diseases attract more reads than expected for a marine sample. Closer inspection reveals that only one or two enzymes in these pathways have large number of reads assigned to them, whereas the majorities have no associated reads. Hence, it is important that one be able to visually inspect a KEGG pathway of interest to see how many reads have been assigned to individual enzymes, as illustrated in Figure 4. MEGAN4 allows the user to select one or more nodes in a taxonomic or functional analysis and then to create a new MEGAN4 document containing only those reads assigned to the selected nodes. For example, this feature allows one to focus on the functional content for a given class of organisms or, vice versa, to determine which types of organisms contribute to a particular functional subsystem or pathway.
Figure 3.
A MEGAN4 integrative functional analysis (using KEGG) of a metaproteome (Morris et al. 2010), metatranscriptome, and metagenome (Gilbert et al. 2008), labeled “Peptides-NR-Morris2010,” “DNA-Time1-Bag1-Gilbert2008,” and “cDNATime1-Bag1-Gilbert2008,” respectively. The classification tree has been expanded down to the second level of the KEGG classification.
Figure 4.
A MEGAN4 integrative functional analysis (using KEGG) of a metaproteome (Morris et al. 2010), metatranscriptome, and metagenome (Gilbert et al. 2008), displaying the protein export pathway. Each labeled rectangle represents a participating enzyme and is underlayed by a bar chart that indicates how many reads from each of the three data sets is assigned to the enzyme, on a logarithmic scale. More details are shown whenever the mouse is placed over such a rectangle. (Courtesy of Kanehisa Laboratories, www.kegg.org.)
Comparison with other methods
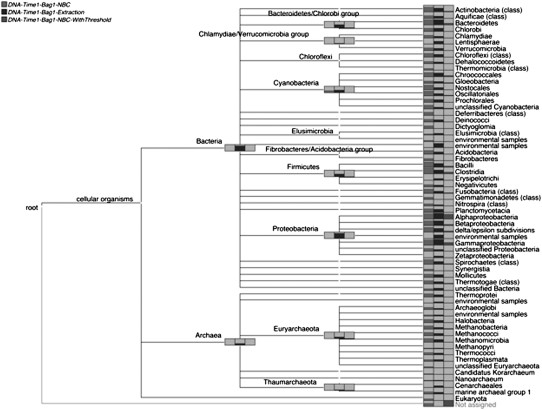
While a comparative performance study based on a sophisticated simulation is beyond the scope of this article, we present some comparisons of taxonomic and functional analyses produced using MEGAN4 and other approaches. In Figure 5 we compare the taxonomic analysis of a marine data set performed by MEGAN4 with two analyses that we have undertaken using NBC (Rosen et al. 2010), one nonthresholded and the other thresholded, as explained in the Methods section. The comparison is displayed down to the taxonomic ranks of Phylum and Class. For nearly all nodes, nonthresholded NBC assigns the most reads to any given taxon, followed by MEGAN4, followed by thresholded NBC. The thresholded version of NBC only assigns 7620 reads in total. There are two taxa to which MEGAN4 assigns reads, but not NBC, namely Lentisphaerae and Zetaproteobacteria. In both cases this is due to the fact that the corresponding genomes were not available for training of NBC. Similarly, some of the nodes labeled “environmental sequences” attracted hits from MEGAN4, but not from NBC, again because the corresponding genomes were not available for training.
Figure 5.
Comparison of the taxonomic analyses of a metagenome data set (Gilbert et al. 2008) computed by MEGAN4 and restricted to Prokaryotes (labeled “DNA-Time1-Bag1-Prokaryotes”) and by NBC (Rosen et al. 2010). In the latter case, we list results obtained both without using a threshold filter (labeled “DNA-Time1-Bag1-NBC”) and results obtained using a threshold filter (labeled “DNA-Time-Bag1-NBC-WithThreshold”).
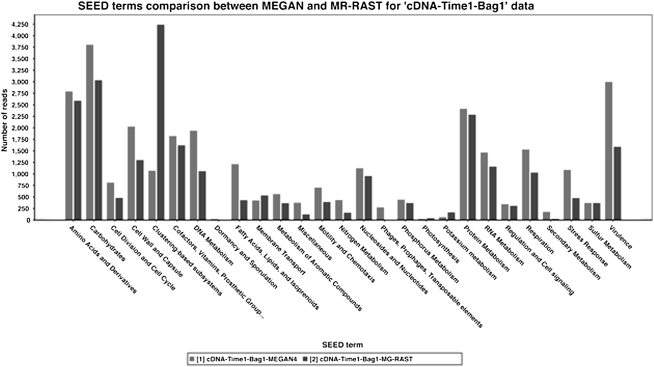
In Figure 6 we compare the SEED analysis of the metatranscriptome data set cDNA-Time1-Bag1 provided by MEGAN4 with that of MG-RAST (as of February 15, 2011). For most types of subsystems, the number of reads assigned by the two methods are very similar, except for the class labeled “clustering based,” which displays a large discrepancy. This is a dynamic category for which discrepancies are to be expected, due to the use of different reference databases and different versions of the SEED classification.
Figure 6.
Comparison of SEED-based functional analyses of a metatranscriptome data set (Gilbert et al. 2008) computed by MEGAN4 and by MG-RAST (Glass et al. 2010).
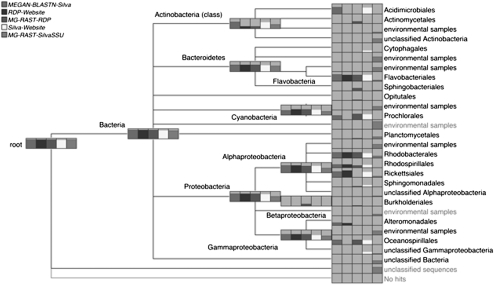
In Figure 7 we compare the MEGAN4 SILVA-based analysis of 16S rRNA reads, computed using top-percent = 1, with analyses produced using the RDP web server (Cole et al. 2009) and the SINA aligner at the SILVA website (Pruesse et al. 2007) and both a RDP- and SILVA-based analysis offered by MG-RAST (all analyses as of February 15, 2011). Here we generally see a good correlation among MEGAN4's SILVA-based analysis, the two RDP-based analyses, and the SILVA website's analysis. One major discrepancy is that MEGAN4 and SILVA assign over 100 reads to Acidmirobiales, whereas the other methods do not. These reads all have near full-length, highly significant (97%–99% identity, E-value = 0) BLASTN matches to SILVA reference sequences annotated as Acidmirobineae. RDP classifies these sequences less specifically as Bacteria. The SILVA-based MG-RAST analyses differ substantially from the other three and are generally uninformative, assigning a large proportion of the reads to nodes labeled “uncultured,” “unclassified,” or “environmental samples”.
Figure 7.
Comparison of the taxonomic analysis of a 16S rRNA data set (Morris et al. 2010), computed using five different approaches: MEGAN4's BLASTN-based SILVA analysis, the RDP website's classifier (Cole et al. 2009), MG-RAST's RDP-based approach (Glass et al. 2010), the SILVA website's aligner (Pruesse et al. 2007), and MG-RAST's SILVA-based approach targeting the SSU gene. In this figure, the bar charts on higher-rank nodes reflect the total number of reads assigned to the corresponding node or to any of the nodes in the subtree below the node.
Discussion
There is a rising interest in using metagenomics, metatranscriptomics, metaproteomics, and other techniques to investigate environmental samples, generating an increasing need for tools that allow one to integrate the analyses of these different types of data. The main challenges posed to bioinformatics are as follows:
- How to deal with very large data sets and how to allow the user to move easily between a high-level summary view of the data and low-level base-level view;
- How to compare multiple data sets in a hierarchical way;
- How to compare both the taxonomic and functional content simultaneously; and
- How to make it easy to find and extract reads of particular interest from a data set contains millions of reads.
The aim of MEGAN4 is to provide an interactive and easy-to-use tool to analyze different types of environmental sequence data in an integrative fashion. The emphasis is on enabling data exploration rather than on providing intricately computed final results. While our program is particularly geared toward the comparison-based approach to taxonomic and functional analysis, it also allows the user to import the results of analyses obtained using other tools, as demonstrated in the examples above.
Performing taxonomic and functional analysis by aligning the given reads against a reference database has a number of advantages. Only a single BLASTX run is required to obtain both taxonomic and functional assignments. In the case of uncertain assignments, one can inspect the individual alignments to determine whether a given assignment is sound. By using the LCA algorithm, one can perform a gene-content-based analysis. However, this approach also has a number of drawbacks. Current protein sequence reference databases cover only a small fraction of the biodiversity believed to be present in the environment (Wu et al. 2009), while databases for specific phylogenetic markers such as rRNA sequences cover a much larger range of species. Moreover, alignment-free approaches tend to run much faster than a BLAST-based analysis.
Researchers are particularly interested in uncovering correlations between environmental parameters and the taxonomic and functional content of different samples. While our new program, MEGAN4, makes it easy to compare different types of data from different samples, one should keep in mind that differences observed in such comparisons do not necessarily reflect actual biology but may also be due to one of numerous possible biases, such as may be caused by differences in data type or sequencing methods or by poor coverage of biodiversity in current reference databases (Wu et al. 2009).
As the number of environmental sequencing data sets continues to increase, researchers will increasingly want to pool data sets in different ways so as to compare, for example, daytime data versus nighttime data, disease-related data versus nondisease data, or open ocean versus coastal data. We are currently developing an extension to MEGAN4 that will allow one to attach attributes to different data sets and then to analyze pooled data sets on the fly.
While second-generation sequencing is fueling an increase in the number and size of metagenomics projects, we anticipate that new technologies providing substantially longer reads, of length 10,000–100,000 bp, for example (“fourth-generation sequencing”), will truly revolutionize metagenomics, providing access to the full sequence of novel genes and operons and making an accurate assembly of complete metagenomes feasible. In the future, we intend to extend MEGAN4 so as to support the analysis of such data.
Methods
Data
The metagenome data set DNA-Time1-Bag1 is called Mid-Bloom DNA-High CO2 by Gilbert et al. (2008) and has accession no. SRX000127. The metatranscriptome data set cDNA-Time1-Bag1 is called Mid-Bloom mRNA-High CO2 by Gilbert et al. (2008) and has accession no. SRX000131. Both were downloaded from the Short Read Archive at NCBI. The metaproteome data set was extracted from Supplemental Table 3 of the study by Morris et al. (2010). The 16S rRNA data is also from the study by Morris et al. (2010). It was downloaded from GenBank using the accession nos. GU460426–GU461274. All MEGAN files shown in this article are available from http://www-ab.informatik.uni-tuebingen.de/software/megan4/megan4paper.
Sequence analysis
For DNA, cDNA, and peptide sequences, sequence comparisons were performed against the NCBI-NR database of nonredundant protein sequences (downloaded July 2010) using BLASTX or BLASTP (in the case of peptides), using default settings. In the case of 16S rRNA sequences, BLASTN was used to compare against the SILVA database, using min-score 1. The BLAST files obtained in this way were then parsed by MEGAN4. In the case of 16S rRNA sequences, MEGAN4 uses a file silva2ncbi.map that maps 460,790 SILVA identifiers onto NCBI taxon identifiers, based on data downloaded from the SILVA website, http://www.arb-silva.de, in July 2010.
Improved LCA algorithm
At startup, MEGAN4 loads the complete NCBI taxonomy, currently containing more than 670,000 nodes. The version used in this article was downloaded from NBCI in November 2010. To perform the taxonomic analysis of a data set, for each read, the program first collects all BLAST matches whose bit-score exceeds a user-set threshold, called the min-score, usually 35 for short reads (100 bp) or larger for longer reads, and whose bit score lies within a fixed percentage of the highest bit-score seen for the read. By default, this percentage, called the top-percent value, is set to 10%. All matches collected in this way are deemed significant, and it is assumed that each taxon that is involved in such a match is potentially the source of the sequencing read. In the case of coding sequences; this is essentially a gene content–based approach. The read is placed on the lowest node in the NCBI taxonomy that is above all taxa that are potential donors of the read, using a simple LCA algorithm.
MEGAN4 supports a third parameter, called the min-support threshold, that is applied to each taxon in the NCBI taxonomy, in a bottom-up fashion: if the number of reads assigned to the taxon is lower than the threshold, then all reads assigned to the current taxon are reassigned to the parent taxon. In this way, reads are passed up the NCBI taxonomy until they reach a node that has sufficient support. Nodes with insufficient support do not appear in the output. In previous versions of our software, the reads originally assigned to a taxon that did not meet the min-support criterion were simply move to a special unassigned category.
In some scenarios, the user many know that matches to certain taxa are incorrect. For example, when analyzing viruses, misleading matches to a host species are possible, usually due to integrated copies of the virus sequence. To address this, MEGAN4 allows one to disable selected taxa. For each read that is analyzed by the LCA algorithm, all matches to disabled taxa are ignored, unless all the matches are only to such taxa, in which case they are all used. The NCBI taxonomy contains a number of nodes named “environmental samples” that occur in different parts of the tree. These nodes are usually disabled by default.
Functional analysis
In preparation of performing a functional analysis using SEED, MEGAN4 first loads a file describing the SEED classification and then loads a file containing a mapping of NCBI RefSeq accession numbers to SEED functional roles, currently containing 1.3 million entries. All files required for SEED-based analysis were downloaded from ftp://ftp.theseed.org/subsystems/ in July 2010. For each read in the input data set, the program considers all matches whose bit-score exceeds a min-score threshold of 35 bits. Of these, MEGAN4 determines the highest-scoring match for which an assignment to a functional role exists and then assigns the read to that role. Each subsystem in the SEED classification contains one or more functional roles, and many of the functional roles appear in more than one subsystem. Hence, the same read may be assigned to more than one node in the SEED tree displayed by MEGAN4 when it is mapped to a functional role that appears in multiple subsystems.
In preparation of performing a functional analysis using KEGG, MEGAN4 first loads a file describing the KEGG classification and then loads a file containing a mapping of NCBI RefSeq accession numbers to KEGG orthology accession numbers (KO numbers), currently containing 2.1 million entries. All files required for KEGG-based analysis were downloaded from http://www.genome.jp/kegg/download/ in July 2010. For each read in the input data, the program considers all matches whose bit-score exceeds the min-score threshold. Of these, MEGAN4 determines the highest-scoring match for which an assignment to a KEGG group exists and then assigns the read to that group. Each pathway in the KEGG classification contains one or more KEGG groups, and many of the KEGG groups appear in more than one pathway. MEGAN4 comes with a complete set of KEGG pathway files, and when requested to show a pathway, MEGAN4 colors each of the enzymes in the pathway based on a mapping of KO identifiers to enzymes. As in the SEED classification, the same read may be assigned to multiple KEGG pathways.
NBC analysis
To compute the two NBC analyses shown in Figure 5, we first trained the NBC software (Rosen et al. 2010) on 1145 complete prokaryotic genomes, which were downloaded from NCBI in July 2010. We then ran NBC on the DNA-Time1-Bag1 data set. We produced two different result files. In a file called DNA-Time1-Bag1-NBC, we listed all assignments of reads to taxa represented in the training database. In a second file called DNA-Time1-Bag1-NBC-WithThreshold, we listed all assignments to reads who NBC score pass a “species threshold” of −23:7 × readlength + 490, as is described on the FAQ web page of NBC.
Comparison
To perform the comparisons of multiple data sets, each of the data sets was opened in MEGAN4, and then a new comparison document was generated to show all data sets simultaneously on one tree. Results obtained from NBC were imported using MEGAN4's importer for CSV files (comma-separated value files). To compare against the result of a classification obtained by some other tool, such as NBC, the results of the external method were imported using MEGAN4's import feature, which is based on a simple comma-separated file format. Analysis of 16S rRNA data using the RDP website (http://rdp.cme.msu.edu/) was performed by uploading a file containing the sequences to the RDP website for analysis and then downloading the resulting text file from the “Classifier:: Assignment detail” page. This file was then read into MEGAN4 using the standard import dialog. Analysis of 16S rRNA data using the SILVA website (http://www.arb-silva.de) was performed by uploading a file containing the sequences to the website and then running the website's aligner on the data. After the website completed its analysis, the produced “log file” was downloaded and then read into MEGAN4 using the standard import dialog.
Acknowledgments
We thank Daniel C. Richter, Mario Stärk, and Paul Rupek for helping to develop some of MEGAN4's new capabilities.
Footnotes
[Supplemental material is available for this article.]
Article published online before print. Article, supplemental material, and publication date are at http://www.genome.org/cgi/doi/10.1101/gr.120618.111. Freely available online through the Genome Research Open Access option.
References
- Altschul SF, Gish W, Miller W, Myers EW, Lipman DJ 1990. Basic local alignment search tool. J Mol Biol 215: 403–410 [DOI] [PubMed] [Google Scholar]
- Benson DA, Karsch-Mizrachi I, Lipman DJ, Ostell J, Wheeler DL 2005. GenBank. Nucleic Acids Res 33: D34–D38 [DOI] [PMC free article] [PubMed] [Google Scholar]
- Brady A, Salzberg SL 2009. Phymm and PhymmBL: metagenomic phylogenetic classification with interpolated Markov models. Nat Methods 6: 673–676 [DOI] [PMC free article] [PubMed] [Google Scholar]
- Caporaso JG, Kuczynski J, Stombaugh J, Bittinger K, Bushman FD, Costello EK, Fierer N, Pena AG, Goodrich JK, Gordon JI, et al. 2010. QIIME allows analysis of high-throughput community sequencing data. Nat Methods 7: 335–336 [DOI] [PMC free article] [PubMed] [Google Scholar]
- Chan CK, Hsu AL, Halgamuge SK, Tang SL 2008. Binning sequences using very sparse labels within a metagenome. BMC Bioinformatics 9: 215 doi: 10.1186/1471-2105-9-215 [DOI] [PMC free article] [PubMed] [Google Scholar]
- Cole JR, Wang Q, Cardenas E, Fish J, Chai B, Farris RJ, Kulam-Syed-Mohideen AS, McGarrell DM, Marsh T, Garrity GM, et al. 2009. The Ribosomal Database Project: improved alignments and new tools for rRNA analysis. Nucleic Acids Res 37: D141–D145 [DOI] [PMC free article] [PubMed] [Google Scholar]
- Colwell RK 2009. EstimateS 8.2 User's Guide: Statistical estimation of species richness and shared species from samples. http://purl.oclc.org/estimates
- Gerlach W, Junemann S, Tille F, Goesmann A, Stoye J 2009. WebCARMA: a web application for the functional and taxonomic classification of unassembled metagenomic reads. BMC Bioinformatics 10: 430 doi: 10.1186/1471-2105-10-430 [DOI] [PMC free article] [PubMed] [Google Scholar]
- Gilbert JA, Field D, Huang Y, Edwards R, Li W, Glina P, Joint I 2008. Detection of large numbers of novel sequences in the metatranscriptomes of complex marine microbial communities. PLoS ONE 3: e3042 doi: 10.1371/journal.pone.0003042 [DOI] [PMC free article] [PubMed] [Google Scholar]
- Glass EM, Wilkening J, Wilke A, Antonopoulos D, Meyer F 2010. Using the metagenomics RAST server (MG-RAST) for analyzing shotgun metagenomes. Cold Spring Harb Protoc 2010: prot5368 doi: 10.1101/pdb.prot5368 [DOI] [PubMed] [Google Scholar]
- Handelsman J, Rondon MR, Brady SF, Clardy J, Goodman RM 1998. Molecular biological access to the chemistry of unknown soil microbes: a new frontier for natural products. Chem Biol 5: R245–R249 [DOI] [PubMed] [Google Scholar]
- Huson DH, Auch AF, Qi J, Schuster SC 2007. MEGAN analysis of metagenomic data. Genome Res 17: 377–386 [DOI] [PMC free article] [PubMed] [Google Scholar]
- Kanehisa M, Goto S 2000. KEGG: kyoto encyclopedia of genes and genomes. Nucleic Acids Res 28: 27–30 [DOI] [PMC free article] [PubMed] [Google Scholar]
- Kosakovsky Pond S, Wadhawan S, Chiaromonte F, Ananda G, Chung WY, Taylor J, Nekrutenko A 2009. Windshield splatter analysis with the Galaxy metagenomic pipeline. Genome Res 19: 2144–2153 [DOI] [PMC free article] [PubMed] [Google Scholar]
- Lozupone C, Lladser ME, Knights D, Stombaugh J, Knight R 2010. UniFrac: an effective distance metric for microbial community comparison. ISME J 5: 169–172 [DOI] [PMC free article] [PubMed] [Google Scholar]
- Markowitz VM, Korzeniewski F, Palaniappan K, Szeto E, Werner G, Padki A, Zhao X, Dubchak I, Hugenholtz P, Anderson I, et al. 2006. The integrated microbial genomes (IMG) system. Nucleic Acids Res 34: D344–D348 [DOI] [PMC free article] [PubMed] [Google Scholar]
- Matsen FA, Kodner RB, Armbrust EV 2010. pplacer: linear time maximum-likelihood and Bayesian phylogenetic placement of sequences onto a fixed reference tree. BMC Bioinformatics 11: 538 doi: 10.1186/1471-2105-11-538 [DOI] [PMC free article] [PubMed] [Google Scholar]
- McHardy AC, Martin HG, Tsirigos A, Hugenholtz P, Rigoutsos I 2007. Accurate phylogenetic classification of variable-length DNA fragments. Nat Methods 4: 63–72 [DOI] [PubMed] [Google Scholar]
- Morris RM, Nunn BL, Frazar C, Goodlett DR, Ting YS, Rocap G 2010. Comparative metaproteomics reveals ocean-scale shifts in microbial nutrient utilization and energy transduction. ISME J 4: 673–685 [DOI] [PubMed] [Google Scholar]
- Overbeek R, Begley T, Butler RM, Choudhuri JV, Chuang HY, Cohoon M, de Crecy-Lagard V, Diaz N, Disz T, Edwards R, et al. 2005. The subsystems approach to genome annotation and its use in the project to annotate 1000 genomes. Nucleic Acids Res 33: 5691–5702 [DOI] [PMC free article] [PubMed] [Google Scholar]
- Pace N, Stahl D, Lane D, Olsen G 1985. Analyzing natural microbial populations by rRNA sequences. ASM News 51: 412 [Google Scholar]
- Poinar HN, Schwarz C, Qi J, Shapiro B, MacPhee RDE, Buigues B, Tikhonov A, Huson DH, Tomsho LP, Auch A, et al. 2006. Metagenomics to paleogenomics: Large-scale sequencing of mammoth DNA. Science 311: 392–394 [DOI] [PubMed] [Google Scholar]
- Pruesse E, Quast C, Knittel K, Fuchs BM, Ludwig W, Peplies J, Glockner FO 2007. SILVA: a comprehensive online resource for quality checked and aligned ribosomal RNA sequence data compatible with ARB. Nucleic Acids Res 35: 7188–7196 [DOI] [PMC free article] [PubMed] [Google Scholar]
- Qin J, Li R, Raes J, Arumugam M, Burgdorf KS, Manichanh C, Nielsen T, Pons N, Levenez F, Yamada T, et al. 2010. A human gut microbial gene catalogue established by metagenomic sequencing. Nature 464: 59–65 [DOI] [PMC free article] [PubMed] [Google Scholar]
- Rosen GL, Reichenberger ER, Rosenfeld AM 2010. NBC: the Naive Bayes Classification tool webserver for taxonomic classification of metagenomic reads. Bioinformatics 27: 127–129 [DOI] [PMC free article] [PubMed] [Google Scholar]
- Rusch DB, Halpern AL, Sutton G, Heidelberg KB, Williamson S, Yooseph S, Wu DY, Eisen JA, Hoffman JM, Remington K, et al. 2007. The Sorcerer II Global Ocean Sampling expedition: Northwest Atlantic through Eastern Tropical Pacific. PLoS Biol 5: 398–431 [DOI] [PMC free article] [PubMed] [Google Scholar]
- Schloss PD, Handelsman J 2005. Introducing DOTUR, a computer program for defining operational taxonomic units and estimating species richness. Appl Environ Microbiol 71: 1501–1506 [DOI] [PMC free article] [PubMed] [Google Scholar]
- Schloss PD, Westcott SL, Ryabin T, Hall JR, Hartmann M, Hollister EB, Lesniewski RA, Oakley BB, Parks DH, Robinson CJ, et al. 2009. Introducing mothur: open-source, platform-independent, community-supported software for describing and comparing microbial communities. Appl Environ Microbiol 75: 7537–7541 [DOI] [PMC free article] [PubMed] [Google Scholar]
- Seshadri R, Kravitz SA, Smarr L, Gilna P, Frazier M 2007. CAMERA: A community resource for metagenomics. PLoS Biol 5: e75 doi: 10.1371/journal.pbio.0050075 [DOI] [PMC free article] [PubMed] [Google Scholar]
- Stark M, Berger SA, Stamatakis A, von Mering C 2010. MLTreeMap—accurate Maximum Likelihood placement of environmental DNA sequences into taxonomic and functional reference phylogenies. BMC Genomics 11: 461 doi: 10.1186/1471-2164-11-461 [DOI] [PMC free article] [PubMed] [Google Scholar]
- Teeling H, Waldmann J, Lombardot T, Bauer M, Glockner FO 2004. TETRA: a web-service and a stand-alone program for the analysis and comparison of tetranucleotide usage patterns in DNA sequences. BMC Bioinformatics 5: 163 doi: 10.1186/1471-2105-5-163 [DOI] [PMC free article] [PubMed] [Google Scholar]
- Tringe SG, von Mering C, Kobayashi A, Salamov AA, Chen K, Chang HW, Podar M, Short JM, Mathur EJ, Detter JC, et al. 2005. Comparative metagenomics of microbial communities. Science 308: 554–557 [DOI] [PubMed] [Google Scholar]
- Turnbaugh PJ, Ley RE, Mahowald MA, Magrini V, Mardis ER, Gordon JI 2006. An obesity-associated gut microbiome with increased capacity for energy harvest. Nature 444: 1027–1031 [DOI] [PubMed] [Google Scholar]
- Turnbaugh PJ, Ley RE, Hamady M, Fraser-Liggett CM, Knight R, Gordon JI 2007. The human microbiome project. Nature 449: 804–810 [DOI] [PMC free article] [PubMed] [Google Scholar]
- Urich T, Lanzen A, Qi J, Huson DH, Schleper C, Schuster SC 2008. Simultaneous assessment of soil microbial community structure and function through analysis of the meta-transcriptome. PLoS ONE 3: e2527 doi: 10.1371/journal.pone.0002527 [DOI] [PMC free article] [PubMed] [Google Scholar]
- Wu D, Hugenholtz P, Mavromatis K, Pukall R, Dalin E, Ivanova NN, Kunin V, Goodwin L, Wu M, Tindall BJ, et al. 2009. A phylogeny-driven genomic encyclopaedia of Bacteria and Archaea. Nature 462: 1056–1060 [DOI] [PMC free article] [PubMed] [Google Scholar]
