Liver-specific Inducible Nitric-oxide Synthase Expression Is Sufficient to Cause Hepatic Insulin Resistance and Mild Hyperglycemia in Mice (original) (raw)
Abstract
Inducible nitric-oxide synthase (iNOS), a major mediator of inflammation, plays an important role in obesity-induced insulin resistance. Inhibition of iNOS by gene disruption or pharmacological inhibitors reverses or ameliorates obesity-induced insulin resistance in skeletal muscle and liver in mice. It is unknown, however, whether increased expression of iNOS is sufficient to cause insulin resistance in vivo. To address this issue, we generated liver-specific iNOS transgenic (L-iNOS-Tg) mice, where expression of the transgene, iNOS, is regulated under mouse albumin promoter. L-iNOS-Tg mice exhibited mild hyperglycemia, hyperinsulinemia, insulin resistance, and impaired insulin-induced suppression of hepatic glucose output, as compared with wild type (WT) littermates. Insulin-stimulated phosphorylation of insulin receptor substrate-1 (IRS-1) and -2, and Akt was significantly attenuated in liver, but not in skeletal muscle, of L-iNOS-Tg mice relative to WT mice without changes in insulin receptor phosphorylation. Moreover, liver-specific iNOS expression abrogated insulin-stimulated phosphorylation of glycogen synthase kinase-3β, forkhead box O1, and mTOR (mammalian target of rapamycin), endogenous substrates of Akt, along with increased _S_-nitrosylation of Akt relative to WT mice. However, the expression of insulin receptor, IRS-1, IRS-2, Akt, glycogen synthase kinase-3β, forkhead box O1, protein-tyrosine phosphatase-1B, PTEN (phosphatase and tensin homolog), and p85 phosphatidylinositol 3-kinase was not altered by iNOS transgene. Hyperglycemia was associated with elevated glycogen phosphorylase activity and decreased glycogen synthase activity in the liver of L-iNOS-Tg mice, whereas phosphoenolpyruvate carboxykinase, glucose-6-phosphatase, and proliferator-activated receptor γ coactivator-1α expression were not altered. These results clearly indicate that selective expression of iNOS in liver causes hepatic insulin resistance along with deranged insulin signaling, leading to hyperglycemia and hyperinsulinemia. Our data highlight a critical role for iNOS in the development of hepatic insulin resistance and hyperglycemia.
Keywords: Akt PKB, Diabetes, Insulin Resistance, Liver, Nitric-oxide Synthase
Introduction
The incidence of obesity and type 2 diabetes has been increasing in the United States and worldwide. Hepatic insulin resistance has a critical role in the progression of hyperglycemia in type 2 diabetes. Activation of inflammatory/stress signaling pathways have been recognized as a major culprit of hepatic insulin resistance (1, 2). These inflammatory/stress signaling pathways include the inhibitor of nuclear factor-κB (IκB) nuclear factor-κB (NF-κB),2 c-Jun N-terminal kinase (JNK), and endoplasmic reticulum stress signaling cascades (3–7). Liver-specific activation of nuclear factor-κB kinase causes hepatic insulin resistance in mice (8). Nonetheless, it remains to be determined how activation of inflammatory/stress signaling pathways induces hepatic insulin resistance.
We and others have shown that the inhibition of inducible nitric-oxide synthase (iNOS, also known as NOS2) by gene disruption or pharmacological inhibitors prevents or ameliorates obesity- and lipopolysaccharide-induced insulin resistance in skeletal muscle and liver of rodents (9–13). We have previously shown that iNOS inhibitor improves hepatic insulin signaling at the levels of insulin receptor substrate-1 (IRS-1) and -2 and Akt in liver of genetically obese, diabetic (ob/ob) mice (10). Conversely, iNOS and NO donors impair insulin signaling in cultured hepatocytes (10). Moreover, iNOS and NO donors reversibly inactivate Akt by _S_-nitrosylation in vitro and in intact cells without altering the phosphorylation status at threonine 308 and serine 473 (14). _S_-Nitrosylation of Akt is increased in skeletal muscle of obese, diabetic (db/db) mice as compared with lean wild-type mice (14). NF-κB and activator protein-1 are key transcription factors to induce iNOS expression. These data indicate, therefore, that NF-κB- and/or activator protein-1-mediated increased expression of iNOS play an important role in the pathogenesis of insulin resistance as a major mediator of inflammatory/stress signaling pathways. It is unknown, however, whether increased expression of iNOS is sufficient to cause insulin resistance in liver. To address this issue, we generated liver-specific iNOS transgenic (L-iNOS-Tg) mice.
EXPERIMENTAL PROCEDURES
Materials
Methyl methanethiosulfonate, ascorbate sodium, streptavidin-agarose, dithiothreitol (DTT), anti-FLAG (M2) antibody, rapamycin, human insulin (all from Sigma), _N_-(6-(biotinamido)hexyl)-3′-(2′-pyridyldithio)-propionamide (HPDP-biotin) (from Pierce), anti-Akt, anti-phospho-Akt (Ser-473), anti-phospho-Akt (Thr-308), anti-FoxO1, anti-phospho-FoxO1, anti-phospho-GSK-3β, anti-phospho-mTOR, anti-p70S6K, anti- phospho-p70S6K, anti-PTEN, anti-S6 ribosomal protein, anti-phospho-S6 ribosomal protein, anti-phospho-JNK, anti-c-Jun, anti-phospho-c-Jun, anti-glycogen synthase (all from Cell Signaling, Beverly, MA), anti-GSK-3β (all from BD Transduction Laboratories), anti-insulin receptor, anti-IRS-1, anti-phospho-IRS-1, anti-iNOS/NOS2, anti-mTOR, anti-PI3K p85, anti-PTP-1B, mouse normal IgG (all from Millipore, Billerica, MA), anti-phospho-insulin receptor (from Invitrogen), anti-GAPDH (from Trevigen, Gaithersburg, MD), anti-phospho-glycogen synthase (from NOVUS, Littleton, CO), anti-glycogen phosphorylase (from ProteinTech Group, Chicago, IL), anti-IRS-2, anti-phospho-IRS-1/2, anti-JNK, and anti-phosphotyrosine (PY99) antibodies (all from Santa Cruz Biotechnology, Santa Cruz, CA) were purchased commercially.
Animals
The study protocol was approved by the Institutional Animal Care Committee of Massachusetts General Hospital. The animal care facility is accredited by the Association for Assessment and Accreditation of Laboratory Animal Care. The mice were housed in a pathogen-free animal facility maintained at 25 °C and illuminated by 12:12-h light-dark cycles. The mice were provided with standard rodent chow and water ad libitum.
Generation of L-iNOS-Tg Mice
FLAG- and Myc-tagged cDNA for mouse iNOS was obtained by PCR using a plasmid carrying mouse iNOS cDNA (a kind gift of Dr. B. C. Kone) (15) as a template and primers (sense, 5′-gAg CTCg Agg CCg CCA CCA Tgg ATT ACA Agg ATg ACg ACg ATA Agg CTT gCC CCT ggA AgT TTC TC-3′; antisense, 5′-AgA TCT AgA gCC CTA CAg ATC CTC TTC AgA gAT gAg TTT CTg CTC gAg CTT CgT ggC TTT ggg CTC-3′). We subcloned cDNA for mouse iNOS into pGEM-Alb vector (a kind gift of Dr. G. Shiota), which contains a ∼2.7-kb fragment of the mouse albumin (Alb1) promoter and enhancer sequences (16). A 7.3-kb fragment containing the mouse albumin promoter/enhancer, cDNA for iNOS, and poly(A) sequence was excised with AatII and NsiI, purified, and microinjected into zygotes, and oviduct transfer was performed in pseudopregnant female FVB mice at the transgenic core of the Boston Area Diabetes and Endocrinology Research Center. To identify transgenic founders, tail DNA extraction and genotyping by PCR were performed using specific primers for pGEM-Alb/iNOS (sense, 5′-TCT TTC TgC ACA CAg ATC ACC T-3′; antisense, 5′-TCC TTT gTT ACA gCT TCC AgC C-3′). The liver-specific expression of the transgene was confirmed by immunoblot analysis with anti-FLAG and anti-iNOS antibodies. Male L-iNOS-Tg and WT littermates on FVB background were used in this study.
Glucose Tolerance Test
Glucose (1.5 g/kg of body weight) was intraperitoneally administered to WT and L-iNOS-Tg mice after 4 h of fasting at 8 weeks of age. Blood samples were collected just before and at 10, 20, 30, 60, and 120 min after the glucose injection. Blood glucose levels were measured by Contour® blood glucose tester (Bayer HealthCare, Mishawaka, IN).
Insulin Tolerance Test
Insulin (0.65 units/kg of body weight, Humulin R, Eli Lilly, Indianapolis, IN) was intraperitoneally administered to WT and L-iNOS-Tg mice after 4 h of fasting at 10 weeks of age. Blood samples were collected just before and at 30, 60, 90, and 120 min after the insulin injection to measure glucose levels.
Measurement of Insulin Concentration
Plasma insulin concentrations were measured by a mouse insulin ELISA kit (ALPCO, Salem, NH).
Assessment of Insulin Sensitivity by Homeostasis Model Assessment (HOMA) and Insulin Resistance Index
To assess whole-body insulin sensitivity of WT and L-iNOS-Tg mice, HOMA insulin resistance index were determined using the HOMA2 Calculator software (downloaded from OCDEM (Oxford Center for Diabetes, Endocrinology, and Metabolism)) (17) based on blood glucose and plasma insulin concentrations at 8 weeks of age.
Biotin-switch Assay for Detection of S-Nitrosylation of Insulin Signaling Molecules
_S_-Nitrosylation of IR, IRS-1, IRS-2, and Akt was evaluated by the biotin-switch assay as previously described (14, 18) with minor modifications. Briefly, liver tissues were rinsed with phosphate-buffered saline (PBS), powdered under liquid nitrogen, and homogenized in homogenization buffer (PBS-HCl, pH 3.5, 150 mm NaCl, 1 mm EDTA, 1 mm diethylenetriaminepentaacetic acid, 7.5% SDS, 2% CHAPS, 0.1 mm neocuproine, 80 μm carmustine, 1 mm PMSF, protease inhibitor mixture; Sigma). The homogenates were incubated at 50 °C for 20 min with vortex every 2 min, after the addition of 2 volume of blocking buffer (PBS-HCl, pH 3.5, 150 mm NaCl, 1 mm EDTA, 1 mm diethylenetriaminepentaacetic acid, 0.1 mm neocuproine, 30 mm methyl methanethiosulfonate). The proteins were precipitated with pre-chilled acetone, dissolved with modified HENS buffer (25 mm HEPES, pH 7.7, 1% SDS, 1 mm EDTA, 1 mm diethylenetriaminepentaacetic acid, 0.1 mm neocuproine), and neutralized with HEN buffer (25 mm HEPES, pH 7.7, 0.5% Triton X-100, 1 mm EDTA, 1 mm diethylenetriaminepentaacetic acid, 100 mm NaCl, 0.1 mm neocuproine). The samples were then incubated with 4 mm HPDP-biotin in the presence of 4 mm ascorbate sodium for 1 h at room temperature. After excess HPDP-biotin was removed by acetone precipitation, the samples were incubated with streptavidin-agarose beads for 1 h at room temperature. The beads were washed 3 times with wash buffer (25 mm HEPES, pH 7.7, 1 mm EDTA, 500 mm NaCl, 0.5% Nonidet P-40). Biotinylated proteins were then eluted by incubation with elution buffer (20 mm HEPES, pH 7.7, 1 mm EDTA, 100 mm NaCl, 200 mm DTT) for 30 min and separated by SDS-PAGE for immunoblotting with anti-IR, anti-IRS-1, anti-IRS-2, or anti-Akt antibodies.
Immunoblotting
Liver and skeletal muscle (gastrocnemius) samples were homogenized as described previously (19) with minor modifications. Briefly, tissues were homogenized in ice-cold homogenization buffer A (50 mm HEPES, pH 8.0, 150 mm NaCl, 2 mm EDTA, 7.5% lithium dodecylsulfate, 2% CHAPS, 10% glycerol, 10 mm sodium fluoride, 2 mm sodium vanadate, 1 mm PMSF, 10 mm sodium pyrophosphate, 1 mm DTT, protease inhibitor mixture). After incubation at 8 °C for 30 min, the homogenized samples were centrifuged at 13,000 × g for 10 min at 8 °C. Immunoblotting was performed as described previously (14). ECL advance reagent (GE Healthcare) was used to visualize the blots. Bands of interest were scanned by the use of ScanMaker (Microtek, Carson, CA) and quantified by NIH Image 1.62 software (NTIS, Springfield, VA).
Immunoprecipitation
Immunoprecipitation was performed as described previously (19). Briefly, tissues were homogenized in ice-cold homogenization buffer B (20 mm HEPES, pH 7.5, 150 mm NaCl, 1 mm EDTA, 1 mm EGTA, 1.0% Nonidet P-40, 1 mm β-glycerophospate,10 mm sodium fluoride, 2 mm sodium vanadate, 1 mm PMSF, 2.5 mm sodium pyrophosphate, protease inhibitor mixture). Equal amounts of tissue lysates were incubated with anti-insulin receptor, anti-IRS-1, or anti-phospho tyrosine antibody for overnight at 4 °C. Protein A/G-agarose beads (Santa Cruz Biotechnology) were then added for an additional 2 h. Immunocomplexes were washed 3 times with buffer (50 mm Tris-HCl, pH 7.6, 150 mm NaCl, 0.1% Nonidet P-40, 2 mm sodium vanadate, 10 mm sodium fluoride, 1 mm PMSF, protease inhibitor mixture).
Hyperinsulinemic Euglycemic Clamp Study
After 14 h of fasting, hyperinsulinemic euglycemic clamp study was conducted for 140 min with a primed/continuous infusion of human insulin (126 pmol/kg, bolus injection, 18 pmol/kg/min, continuous infusion) (Novo Nordisk) at 15 weeks of age as previously described (20, 21). During the clamp, plasma glucose was maintained at basal concentrations (∼6.7 mm). Rates of basal and insulin-stimulated whole-body glucose fluxes and tissue glucose uptake were determined as previously described (20, 21). Fat and lean body mass were assessed at 15 weeks of age by magnetic resonance spectrometry as previously described (20).
Mouse Primary Hepatocytes
Hepatocytes were isolated from mice at 8–10 weeks of age as described previously (22). Briefly, under anesthesia, the abdominal cavity was opened, and the liver was perfused via the portal vein first with a Ca2+/Mg2+-free Hanks' buffered salt solution (HBSS) with EDTA, second with a Ca2+/Mg2+-free HBSS (without EGTA), and perfusion with Ca2+/Mg2+-free HBSS containing 0.195 mg/ml of type I collagenase (Sigma). The hepatocytes were then gently shaken in the collagenase solution for 10 min. The digested tissue was run through, sequentially, 100-, 70-, and 40-μm nylon meshes. The suspension was centrifuge at 600 rpm (50 × g) for 5 min at 4 °C to wash and differentially sediment hepatocytes from other cell types. The resulting cell pellet was re-suspended, and an aliquot was taken to determine cell number and viability by the trypan blue exclusion test. The cells were plated at a density of 2.0 × 10⁵ cells/well onto collagen-coated 12-well plates (BD Biosciences) in DMEM supplemented with 10% FBS and 1% penicillin/streptomycin and allowed to adhere for 4 h. The media were then replaced with fresh ones with and without rapamycin (1 μm). At 16 h after the medium change, the cells were serum-starved for 3 h in the presence and absence of rapamycin (1 μm). Then the cells were stimulated with or without insulin (10 nm) for 1, 5, and 10 min for evaluation of IR and IRS-1/2 (1 min), Akt (5 min), and glycogen synthase kinase-3β (GSK-3β), p70S6K, and S6 (10 min) phosphorylation, respectively.
Evaluation of Plasma Lipid Profile
Blood samples were obtained after 4 h of fasting at 15 weeks of age. Plasma concentrations of triglycerides, total cholesterol, and non-esterified fatty acid and profiles of triglycerides and cholesterol were determined with FPLC fractionation system (GE Healthcare) as previously described (23).
Measurement of Liver Triglycerides
Liver sample was collected under anesthesia with pentobarbital sodium (50 mg/kg of body weight, immunoprecipitation) after 4-h or overnight fasting, hydrolyzed in 1.0 ml of 5% (w/v) Triton X-100 solution, and boiled for 5 min. Liver triglycerides content was determined using a kit (WAKO Chemicals USA, Richmond, VA) according to the manufacturer's instructions and normalized to the tissue weight.
Measurement of Liver Glycogen
Liver glycogen content was determined using anthrone reagent as previously described (24). Liver was excised under anesthesia after 4-h or overnight fasting and solubilized in 0.3 ml of 30% (w/v) KOH solution at 95 °C for 30 min with vortexing every 10 min. 0.1 ml of 1 m Na2SO4 and 0.8 ml of 100% ethanol were added to the sample. The mixture was centrifuged at 14,000 rpm for 5 min. After washing twice with 1 ml of 70% ethanol, the precipitate was dissolve in 0.4 ml of water. One milliliter of anthrone reagent (66% H2SO4, 0.05% anthrone, 1.0% thiourea) was added to 0.2 ml of the sample, and the mixture was boiled for 15 min. The concentrations of glycogen were determined by measuring absorbance at 620 nm and normalized to the tissue weight.
Measurement of Glycogen Phosphorylase Activity
The activity of glycogen phosphorylase (GP) was measured as described previously (13). Briefly, after the liver samples were homogenized in buffer containing 50 mm MES, 150 mm potassium fluoride, 5 mm EDTA, and protease inhibitor mixture, the homogenates were passed through the column (Micro Bio Spin Column, Bio-Rad) to remove AMP. Aliquots of the eluates (30 μl) were added to 30 μl of the assay buffer (50 mm MES, 50 mm sodium fluoride, 5 mm EDTA, 50 mm glucose 1-phosphate, 0.5 μCi/ml [14C]glucose 1-phosphate (PerkinElmer Life Sciences), 27 mm 2-mercaptethanol, and 10 mg/ml glycogen). Total GP activity was measured in the assay buffer containing 3 mm AMP glycogen phosphorylase a form (GP-a) activity was measured in the presence of 0.75 mm caffeine, an inhibitor of glycogen phosphorylase b form (GP-b) in the absence of AMP. After the incubation at room temperature for 30 min, 25 μl of aliquots were spotted on a Whatman GF/A filter (Whatman, Clifton, NJ). Then the filters were dropped into cold 66% ethanol for 30 min to precipitate glycogen and washed twice. The filters were then subjected to measurement of radioactivity with liquid scintillation counter.
Measurement of Glycogen Synthase Activity
The activity of glycogen synthase (GS) was measured as described previously (25). Briefly, after the frozen liver samples were homogenized in buffer containing 50 mm Tris-HCl, pH 7.4, 100 mm potassium fluoride, 10 mm EDTA, 1 mm DTT, and protease inhibitor mixture, the homogenates (30 μl) were added to 30 μl of the assay buffer (50 mm Tris-HCl, 50 mm sodium fluoride, 10 mm EDTA, 5 mm UDP-glucose, 1.5 μCi/ml UDP-[14C]glucose (American Radioactive Chemicals, St. Louis, MO), 5 mm DTT, 15 mg/ml glycogen) in the presence or absence of 10 mm glucose 6-phosphate, an allosteric activator of GS, at 37 °C for 15 min. 25-μl aliquots were spotted on a Whatman filter. Then the filters were dropped into cold 70% ethanol for 30 min to precipitate glycogen and washed twice. The filters were then subjected to measurement of radioactivity with liquid scintillation counter. The activity of GS was assessed by the ratio of 14C incorporation into glycogen in the absence of glucose 6-phosphate to that in the presence of glucose 6-phosphate (25, 26).
Phosphatidylinositol 3-Kinase (PI3K) Activity Assay
PI3K activities in liver lysates were assayed as described (19). Briefly, immunoprecipitates with anti-IRS-2 antibody (Santa Cruz Biotechnology) were resuspended in reaction buffer (25 μl of TNE buffer (100 mm Tris-HCl, 100 mm NaCl, 1 mm EDTA), 5 μl of 2 mg/ml phosphatidylinositol, 5 μl of 100 mm MgCl2). The PI3K reaction was initiated by adding 1.5 μl of 1.5 mm ATP and 1 μl of 10 mCi/ml [γ-32P]ATP. After 10 min of incubation at 37 °C, the reaction was stopped by the addition of 10 μl of 6 m HCl and 80 μl of chloroform/methanol (1:1). The phases were separated by centrifugation, and 7 μl of the lower organic phase containing the reaction products was spotted on a TCL plate (Whatman). The lipids were resolved by chromatography in chloroform:methanol:distilled water:ammonium hydroxide (60:47:11.3:2) and visualized by autoradiography. The incorporation of 32P in phosphatidylinositol was then measured by liquid scintillation counter.
Isolation of total RNA and Quantitative RT-PCR
Total RNA was isolated with an RNeasy Mini kit (Qiagen, Valencia, CA). The fist-strand cDNA was synthesized from 1 μg of total RNA using a High Capacity cDNA Reverse Transcription kit (Applied Biosystems, Carlsbad, CA). Real-time RT-PCR analyses were performed as previously described (27) using 10 ng of cDNA and TaqMan probes (Applied Biosystems) for fatty acid synthase, acetyl-CoA carboxylase, phosphoenolpyruvate carboxykinase (PEPCK), glucose-6-phosphatase (G-6-Pase), peroxisome proliferator-activated receptor γ coactivator-1α (PGC-1α), GS, GP, and 18 S ribosomal RNA, conducted with Mastercycler® ep realplex (Eppendorf, New York, NY). The gene expression of fatty acid synthase, acetyl-CoA carboxylase, PEPCK, G-6-Pase, PGC-1α, GS, and GP was normalized to 18 S ribosomal RNA. mRNA expression levels of mouse sterol regulatory element binding protein-1c (SREBP-1c) and glyceraldehyde-3-phosphate dehydrogenase (GAPDH) were evaluated as previously described (28, 29) with SYBR Green (Applied Biosystems). mRNA levels of SREBP-1c were normalized to those of GAPDH.
Statistical Analysis
The data were compared with one-way analysis of variance followed by Scheffe's multiple comparison test or Student's t test. A value of p < 0.05 was considered statistically significant. All values are expressed as the mean ± S.E.
RESULTS
Hyperglycemia, Hyperinsulinemia, and Insulin Resistance in L-iNOS-Tg Mice
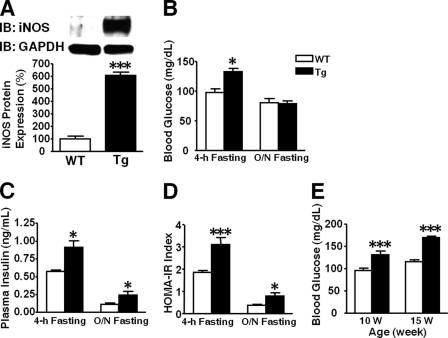
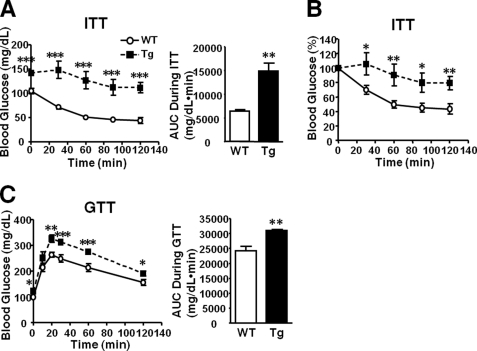
We generated two lines of L-iNOS-Tg mice. The protein expression of iNOS was increased 6.1- and 5.2-fold in liver of the lines 1 and 2 of L-iNOS-Tg mice, respectively, relative to WT littermates (Fig. 1A and data not shown). In skeletal muscle no difference was found in iNOS expression L-iNOS-Tg and WT mice (data not shown). Both lines of the L-iNOS-Tg mice exhibited similar increases in blood glucose levels and plasma insulin concentrations at 8 weeks of age after 4 h of fasting compared with WT littermates (Figs. 1, B and C, and data not shown). No significant differences were found in blood glucose and plasma insulin concentrations and iNOS expression between line 1 and line 2 of L-iNOS-Tg mice. In the following experiments, therefore, we evaluated the effects of liver-specific iNOS expression in line 1 of L-iNOS-Tg mice. Hyperglycemia persisted in L-iNOS-Tg mice at 10 and 15 weeks of age after 4 h of fasting as compared with WT littermates (Fig. 1E). On the other hand, after overnight fasting blood glucose levels did not differ between the two groups at 10 weeks of age (Fig. 1B), although L-iNOS-Tg mice displayed hyperinsulinemia relative to WT mice (Fig. 1C). The homeostasis model assessment insulin resistance (HOMA2-IR) index also indicates attenuated insulin sensitivity in L-iNOS-Tg mice relative to WT mice both after 4 h and overnight fasting (Fig. 1D). Insulin tolerance test and glucose tolerance test revealed insulin resistance and glucose intolerance in L-iNOS-Tg mice as compared with WT littermates (Fig. 2). No differences were found in body weight, fat mass, and lean body mass between WT and L-iNOS-Tg mice (supplemental Fig. 1). Food intake did not differ between the two groups (average food intake (g/day): WT, 3.4; Tg, 3.3).
FIGURE 1.
Hyperglycemia and hyperinsulinemia in L-iNOS-Tg mice. Immunoblot analysis (IB) showed that iNOS expression was increased in liver of L-iNOS-Tg mice compared with WT mice (A). Blood samples were collected after 4-h and overnight (O/N) fasting at 8 and 10 weeks of age, respectively. Blood glucose levels were significantly greater in L-iNOS-Tg mice than WT mice after 4-h, but not overnight, fasting (B). Plasma insulin concentrations were significantly greater in L-iNOS-Tg mice than WT mice after both 4-h and overnight fasting (C). Consistently, L-iNOS-Tg mice exhibited insulin resistance, as indicated by elevated HOMA insulin resistance index (D). Hyperglycemia after 4 h of fasting was observed in L-iNOS-Tg mice at 10 and 15 weeks of age as well (E). n = 7–9 per group. *, p < 0.05; ***, p < 0.005 versus WT.
FIGURE 2.
Insulin resistance and glucose intolerance in L-iNOS-Tg mice. A and B, an insulin tolerance test (ITT) revealed significantly attenuated hypoglycemic response to insulin injection (0.65 units/kg of body weight, intraperitoneal injection) in L-iNOS-Tg mice compared with WT littermates. The area under the curve (AUC) analysis showed increased blood glucose levels in L-iNOS-Tg mice during the insulin tolerance test. n = 5–8 per group. C, glucose tolerance tests (GTT, 1.5 g/kg of body weight, intraperitoneal injection) demonstrated glucose intolerance in L-iNOS-Tg mice compared with WT littermates. The area under the glucose curve was calculated during GTT. n = 8 per group. *p < 0.05; **p < 0.01; ***p < 0.005 versus WT.
Impaired Insulin-induced Suppression of Hepatic Glucose Output in L-iNOS-Tg Mice
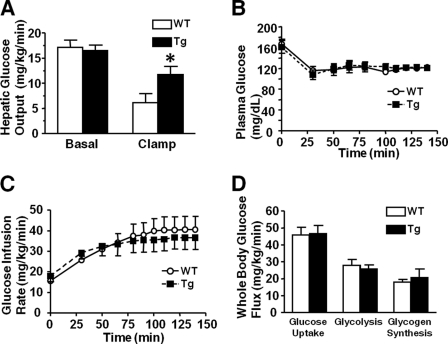
Hyperinsulinemic euglycemic clamp study after 14 h of fasting revealed that insulin-induced suppression of hepatic glucose output was significantly impaired in L-iNOS-Tg mice compared with WT mice. During the hyperinsulinemic euglycemic clamp, hepatic glucose output was reduced to 32 and 71% that of basal levels in WT and L-iNOS-Tg mice, respectively (Fig. 3A). Basal (exogenous insulin-naïve) hepatic glucose output did not differ between WT and L-iNOS-Tg mice. This finding is consistent with normal blood glucose level after overnight fasting in L-iNOS-Tg mice (Fig. 1B). There were no differences in glucose infusion rates to maintain euglycemia, plasma glucose levels during the clamp study, whole-body glucose uptake, glycolysis, and glycogen synthesis between L-iNOS-Tg and WT mice.
FIGURE 3.
Insulin-induced suppression of hepatic glucose output was impaired in L-iNOS-Tg mice. A hyperinsulinemic euglycemic clamp study revealed that hepatic glucose output during the clamp was significantly greater in iNOS-Tg mice than WT littermates (p < 0.05), although basal hepatic glucose output did not differ between the two groups (_A_). Insulin infusion remarkably suppressed hepatic glucose output in WT mice (_p_ < 0.0005). In L-iNOS-Tg mice, however, hepatic glucose output during the clamp was not significantly decreased compared with the basal level (_p_ > 0.10). During the clamp, there were no differences in plasma glucose levels (B), glucose infusion rates (C), and whole-body glucose uptake, glycolysis, and glycogen synthesis (D) between L-iNOS-Tg and WT mice. n = 7–8 per group. *, p < 0.05 versus WT during the clamp.
Impaired Hepatic Insulin Signaling in L-iNOS-Tg Mice
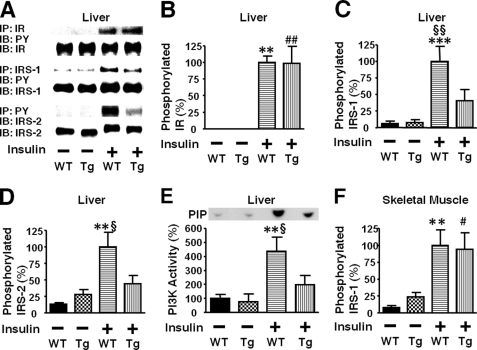
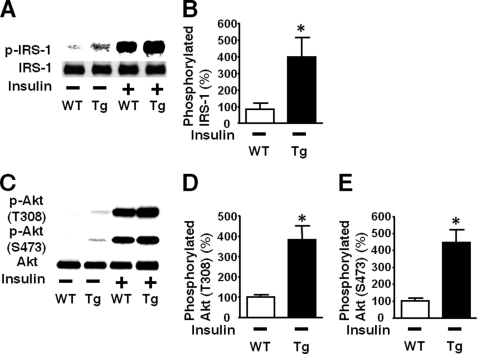
Next we examined the effects of liver-specific iNOS expression on insulin signaling. Insulin-stimulated tyrosine phosphorylation of IR was preserved in the liver of L-iNOS-Tg mice compared with WT littermates. In contrast, insulin-stimulated tyrosine phosphorylation of IRS-1 and IRS-2 was significantly attenuated in the liver of L-iNOS-Tg mice relative to WT littermates (Fig. 4). Likewise, insulin-stimulated PI3K activation was impaired in L-iNOS-Tg mice compared with WT littermates. The protein expression of IR, IRS-1, and IRS-2 was not affected by the iNOS transgene.
FIGURE 4.
Liver-specific iNOS expression inhibited insulin-stimulated tyrosine phosphorylation of IRS-1 and IRS-2 in mouse liver. At 10 weeks of age, after overnight fasting, insulin (0.65 units/kg of body weight) or saline was injected via the portal vein, and 5 min later liver (A–E) and muscle (F) was taken under anesthesia. IR-mediated signaling was evaluated by immunoprecipitation (IP) with anti-IR, anti-IRS-1, or anti-phospho tyrosine (PY) antibody followed by immunoblotting (IB) with anti-PY or IRS-2 antibody (A). Insulin-stimulated tyrosine phosphorylation of IR was not altered in L-iNOS-Tg compared with WT littermates (B). In contrast, insulin-stimulated tyrosine phosphorylation of IRS-1 and IRS-2 was significantly decreased in L-iNOS-Tg mice relative to WT littermates (C and D). Insulin markedly increased tyrosine phosphorylation of IRS-1 and IRS-2 in WT mice. In L-iNOS-Tg mice, however, insulin did not significantly increase tyrosine phosphorylation of IRS-1 and IRS-2. The protein expression of IR, IRS-1, and IRS-2 expression was not affected by the iNOS transgene. Consistently, IRS-2-associated PI3K activity was increased by insulin injection in WT, but not L-iNOS-Tg, mice, as determined by in vitro phosphorylation of phosphatidylinositol to phosphatidylinositol 3-phosphate (PIP; E). In skeletal muscle, however, insulin-stimulated tyrosine phosphorylation of IRS-1 did not differ between the two groups (F). **, p < 0.01; ***, p < 0.005 versus WT with saline; ##, p < 0.01 versus Tg with saline. §, p < 0.05; §§, p < 0.02 versus Tg with insulin.
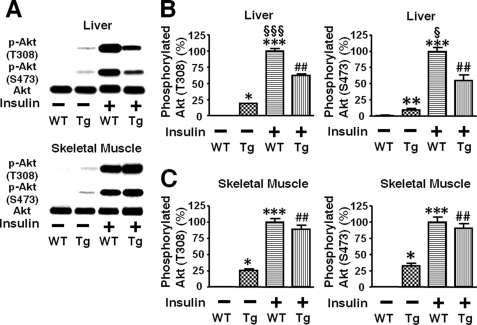
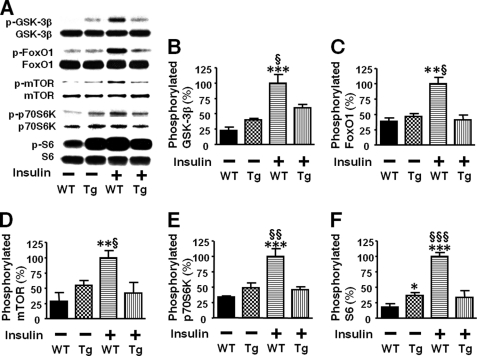
Consistently, insulin-stimulated phosphorylation of Akt at threonine 308 and serine 473 was significantly decreased in the liver of L-iNOS-Tg mice compared with WT littermates (Fig. 5B). In skeletal muscle, however, no difference was found in insulin-stimulated Akt phosphorylation between L-iNOS-Tg and WT mice (Fig. 5C). We further examined the effects of liver-specific iNOS expression on downstream insulin signaling components. Insulin failed to increase phosphorylation of GSK-3β, forkhead box O1 (FoxO1), and mammalian target of rapamycin (mTOR), endogenous substrates of Akt, in the liver of L-iNOS-Tg mice, whereas insulin induced robust phosphorylation of these signaling molecules in WT littermates (Fig. 6). Blockade of insulin-stimulated activation of the mTOR pathway by the iNOS transgene was corroborated by phosphorylation status of p70 S6 kinase (p70S6K) and S6. Insulin increased phosphorylation of p70S6K and S6 in liver of WT mice but not in L-iNOS-Tg mice.
FIGURE 5.
Insulin-stimulated phosphorylation of Akt was significantly impaired in liver, but not in skeletal muscle, of iNOS-Tg mice. At 10 weeks of age, insulin (0.65 units/kg of body weight) or saline was injected via the portal vein after overnight fasting (A). At 5 min after the injection, liver and skeletal muscle was taken under anesthesia. Insulin-stimulated phosphorylation of Akt at threonine 308 and serine 473 was significantly blunted in liver (B), but not in skeletal muscle (C), of iNOS-Tg mice as compared with WT littermates. Basal (exogenous insulin-naïve) Akt phosphorylation was slightly, but significantly increased in both liver and skeletal muscle of L-iNOS-Tg mice relative to WT mice. The protein expression of Akt did not differ between L-iNOS-Tg and WT littermates in liver and skeletal muscle. *, p < 0.05; **, p < 0.01; ***, p < 0.001 versus WT with saline; ##, p < 0.002 versus Tg with saline. §, p < 0.05, §§§, p < 0.0002 versus Tg with insulin.
FIGURE 6.
Liver-specific iNOS expression blocked insulin-stimulated phosphorylation of GSK-3β, FoxO1, and mTOR in mouse liver. At 10 weeks of age insulin (0.65 units/kg of body weight) or saline was injected via the portal vein after overnight fasting. Phosphorylation was evaluated by immunoblot analysis (A). At 5 min after the injection, liver was taken under anesthesia. In WT mice insulin markedly increased phosphorylation of GSK-3β (B), FoxO1 (C), mTOR (D), p70S6K (E), and S6 (F) in liver. However, insulin failed to increase phosphorylation of these signaling molecules in iNOS-Tg mice. Liver-specific iNOS expression did not alter the protein expression of GSK-3β, FoxO1, mTOR, p70S6K, and S6. *, p < 0.05; **, p < 0.01; ***, p < 0.005 versus WT with saline. §, p < 0.05; §§, p < 0.01; §§§, p < 0.005 versus Tg with insulin.
The protein expression of Akt, GSK-3β, FoxO1, mTOR, p70S6K, S6, protein-tyrosine phosphatase-1B (PTP-1B), phosphatase and tensin homolog (PTEN), p85 PI3K, and GAPDH did not differ between L-iNOS-Tg and WT mice (Figs. 5 and 6 and supplemental Fig. 2).
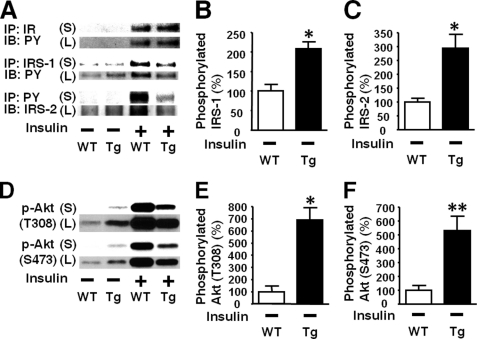
Basal (exogenous insulin-naïve) Akt phosphorylation were slightly but significantly greater in both liver and skeletal muscle of L-iNOS-Tg mice relative to WT littermates (Fig. 5). To further investigate the effects of the iNOS transgene on the basal (exogenous insulin-naïve) state of upstream signaling components, we analyzed the phosphorylation status in the immunoblots with longer exposure to the membranes because the intensities of the bands for basal phosphorylation were quite low in the immunoblots with short exposure as shown in Fig. 4. Immunoblot analysis with long exposure revealed that basal tyrosine phosphorylation of IRS-1 and IRS-2 was significantly greater in the liver of L-iNOS-Tg mice than WT littermate (Figs. 7, B and C). We evaluated tyrosine phosphorylation of IR by Western blotting with anti-phosphorylated IR antibody and by immunoprecipitation with anti-IR antibody followed by immunoblotting with anti-phosphotyrosine antibody. Basal tyrosine phosphorylation of IR was, however, below the detection limit in both WT and L-iNOS-Tg mice (Fig. 7A, supplemental Fig. 3), whereas insulin-stimulated phosphorylation of IR was clearly detected in both WT and L-iNOS-Tg mice.
FIGURE 7.
Increased basal phosphorylation of IRS-1, IRS-2, and Akt in liver of L-iNOS-Tg mice. A modest but significant increase in basal (exogenous insulin-naïve, namely saline-injected) Akt phosphorylation in L-iNOS-Tg mice (Fig. 5) motivated us to further investigate basal phosphorylation status in L-iNOS-Tg mice in the immunoblots with long exposure (L) to the membranes (A). PY, phosphotyrosine. Insulin-stimulated phosphorylation was evaluated in the immunoblots with short exposure (S) as shown in Figs. 4–6. Immunoblot analysis with long exposure showed that basal (exogenous insulin-naïve, insulin −) tyrosine phosphorylation of IRS-1 and IRS-2 was significantly increased in L-iNOS-Tg mice relative to WT mice (B and C), although we did not find significant differences in the immunoblots with short exposure (Figs. 4, C and D). However, tyrosine phosphorylation of IR was undetectable both in L-iNOS-Tg and WT mice (A and supplemental Fig. 3). Consistent with the data in the immunoblots with short exposure shown in Fig. 5, basal phosphorylation of Akt at threonine 308 and serine 473 was increased in L-iNOS-Tg mice than WT littermates in the immunoblots with long exposure (E and F) as well. *, p < 0.05; **, p < 0.01 versus WT with saline (insulin −). S, short exposure; L, long exposure.
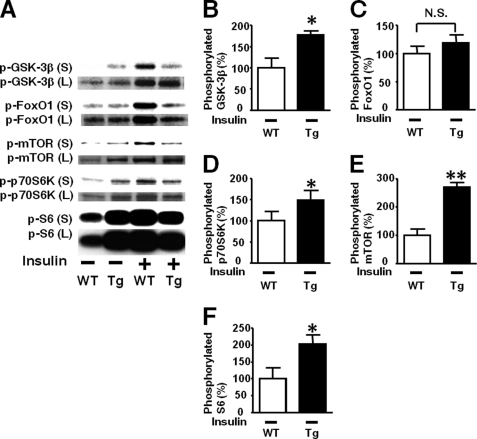
Immunoblotting with long exposure showed a marked increase in basal Akt phosphorylation in L-iNOS-Tg mice compared with WT mice (Figs. 7, E and F). Likewise, basal phosphorylation of GSK-3β, mTOR, p70S6K, and S6, but not FoxO1, was significantly increased in liver by iNOS transgene (Fig. 8).
FIGURE 8.
Effects of liver-specific iNOS expression on basal phosphorylation of downstream signaling molecules of the Akt pathway in mouse liver. Immunoblot analysis with long exposure (L) to the membranes revealed that basal (exogenous insulin-naïve, insulin −) phosphorylation of GSK-3β, mTOR, p70S6K, and S6 was significantly increased in L-iNOS-Tg mice compared with WT littermates, although no statistical difference was found in basal phosphorylation of these proteins in the immunoblots with short exposure (S) as shown in Fig. 6. No difference was found in basal phosphorylation of FoxO1 between the two groups even in the immunoblots with long exposure (C) as well as those with short exposure (Fig. 6C). *, p < 0.05; **, p < 0.01 versus WT with saline (insulin −). S, short exposure; L, long exposure., not significant.
Increases in basal phosphorylation of Akt and IRS-1 were observed in skeletal muscle as well as liver of L-iNOS-Tg mice (Fig. 9). This is a stark contrast to the liver-specific impairment in insulin-stimulated phosphorylation of IRS-1 and Akt (Figs. 4 and 5). These findings indicate that hepatocyte-specific expression of iNOS resulted in increased basal phosphorylation of the Akt pathway in both liver and muscle in contrast to the insulin-stimulated phosphorylation attenuated in liver but not skeletal muscle of L-iNOS-Tg mice.
FIGURE 9.
Increased basal phosphorylation of IRS-1 and Akt in skeletal muscle of L-iNOS-Tg mice. Basal (exogenous insulin-naïve, insulin −) phosphorylation was evaluated by immunoblot analysis with long exposure to the membranes (A and C). Immunoblots with short exposure showed that there was no significant difference in insulin-stimulated phosphorylation of IRS-1 between L-iNOS-Tg and WT mice (Fig. 4F), although there was a trend of increased basal phosphorylation of IRS-1 in L-iNOS-Tg mice relative to WT mice. When the results were further analyzed in the immunoblots with longer exposure, we found a significantly increased basal phosphorylation of IRS-1 in skeletal muscle of L-iNOS-Tg mice (B). The protein expression of IRS-1 did not differ between the two groups. Similar to the results in the immunoblots with short exposure (Fig. 5C), immunoblot analysis with long exposure demonstrated that basal phosphorylation of Akt was significantly increased in skeletal muscle of L-iNOS-Tg mice compared with WT littermates (D and E), whereas no difference was found in insulin-stimulated Akt phosphorylation (Fig. 5C). n = 6 per group. *, p < 0.05; **, p < 0.01 versus WT with saline (insulin −).
Impairment in insulin-stimulated phosphorylation of the substrates of Akt (i.e. GSK-3β, FoxO1, and mTOR) was apparently more profound compared with that of Akt itself (Figs. 5 and 6). Conversely, an increase in basal phosphorylation of Akt seems more prominent compared with that of the substrates of Akt (Figs. 7 and 8). These findings raise the possibility that there might be a mechanism by which the iNOS transgene could impair insulin signal transduction at the level of Akt in liver.
S-Nitrosylation of IR, IRS-1, IRS-2, and Akt in L-iNOS-Tg Mice
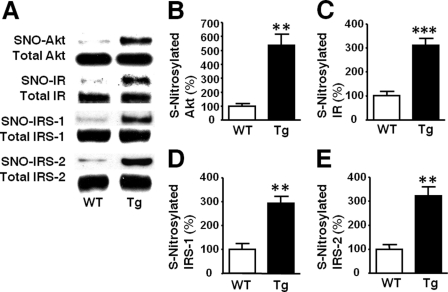
Apart from the reduction in Akt phosphorylation, aberrant insulin signaling may be associated with Akt _S_-nitrosylation, a post-translational modification that directly inactivates Akt without affecting phosphorylation status of Akt (14). We, therefore, evaluated the _S_-nitrosylation status of Akt and found that _S_-nitrosylated Akt was markedly increased in liver of L-iNOS-Tg mice compared with WT littermates (Fig. 10). Similarly, _S_-nitrosylation of IR, IRS-1, and IRS-2 was also increased in the liver of L-iNOS-Tg mice, consistent with previous studies in skeletal muscle of obese, diabetic mice (9, 30, 31).
FIGURE 10.
Increased _S_-nitrosylation of Akt and upstream insulin signaling molecules in liver of L-iNOS-Tg mice. _S_-Nitrosylation was evaluated by biotin switch analysis (A). _S_-Nitrosylated Akt (SNO-Akt) was markedly increased in liver of L-iNOS-Tg mice relative to WT littermates at 15 weeks of age (B). Similarly, _S_-nitrosylation of IR, IRS-1, and IRS-2 was also increased in L-iNOS-Tg mice compared with WT littermates (C–E). The protein expression of Akt, IR, IRS-1, and IRS-2 did not differ between the two groups. **, p < 0.01; ***, p < 0.005 versus WT.
Increased Triglycerides Levels and Reduced Hepatic Glycogen Content in L-iNOS-Tg Mice
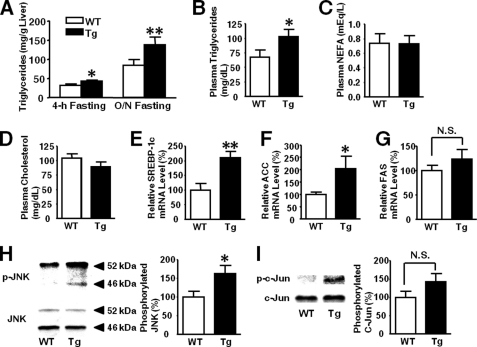
Triglyceride content was greater in the liver of L-iNOS-Tg mice than WT mice (Fig. 11A). Likewise, plasma triglycerides levels were elevated in L-iNOS-Tg mice, culminating in the induction of plasma triglyceride-rich very low density lipoprotein. In contrast, no significant differences were observed in plasma non-esterified fatty acid, total cholesterol, and HDL-cholesterol in L-iNOS-Tg versus WT mice (Fig. 11; supplemental Figs. 4 and 5). mRNA levels of SREBP-1c and acetyl-CoA carboxylase were significantly greater in the liver of L-iNOS-Tg mice than WT mice (Figs. 11, E and F). mRNA expression of fatty acid synthase appeared to be increased in L-iNOS-Tg mice relative to WT mice, but no significant difference was found between the two groups.
FIGURE 11.
Increases in triglycerides levels, expression of lipogenic genes, and JNK activity in L-iNOS-Tg mice. Triglycerides content in liver (A) were significantly greater in L-iNOS-Tg mice than WT mice after 4-h and overnight (O/N) fasting at 15 weeks of age. Plasma triglycerides concentrations were significantly greater in L-iNOS-Tg mice than WT mice (B). Plasma non-esterified fatty acid (NEFA; C) and total cholesterol (D) concentrations, however, did not significantly differ between the two groups. Consistent with increased triglycerides levels, mRNA expression levels of SREBP-1c (E) and acetyl-CoA carboxylase (ACC; F) were significantly elevated in liver of L-iNOS-Tg mice compared with WT littermates after 4 h of fasting. Fatty acid synthase (FAS) mRNA levels appear to be increased in L-iNOS-Tg mice relative to WT mice, but there was no significant difference between the two groups (G). Lipid accumulation can increase JNK activity. As expected, phosphorylation of JNK was significantly increased in liver of L-iNOS-Tg mice relative to WT littermates (H). Phosphorylation of c-Jun and endogenous substrate of JNK appeared to be greater in L-iNOS-Tg mice, but there was no significant difference (I). n = 6 per group. *, p < 0.05; **, p < 0.005 versus WT; N.S., not significant.
Fatty liver is associated with activation of JNK. We, therefore, assessed activation status of JNK. Phosphorylation (activation) of JNK was modestly but significantly increased in the liver of L-iNOS-Tg mice relative to WT mice (Fig. 11H). There was a trend of increased phosphorylation of c-Jun, an endogenous substrate of JNK, but no statistical difference was achieved.
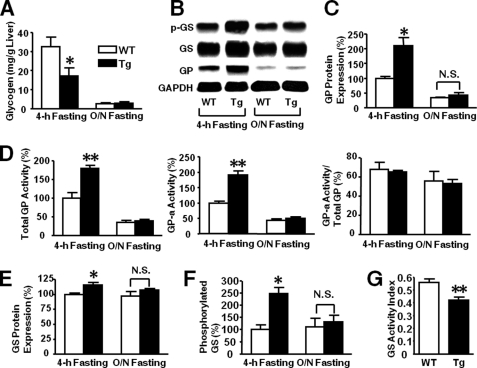
Glycogen content was significantly decreased after 4 h of fasting in the liver of L-iNOS-Tg mice relative to WT mice (see Fig. 13A). After overnight fasting, however, glycogen content was markedly reduced in both WT and L-iNOS-Tg mice as expected, and there was no difference in hepatic glycogen content between the two groups.
FIGURE 13.
Effects of liver-specific iNOS expression on glycogen metabolism in liver. Glycogen content was significantly decreased in the liver of L-iNOS-Tg mice compared with WT mice after 4 h of fasting at 15 weeks of age (A). After overnight (O/N) fasting, hepatic glycogen content was remarkably decreased in both WT and L-iNOS-Tg mice, and no significant difference was found between the two groups. GP protein expression was significantly increased in L-iNOS-Tg mice relative to WT littermates after 4 h of fasting (B and C). After overnight fasting, however, GP expression was decreased both in L-iNOS-Tg and WT mice, and there was no significant difference between the two groups. Likewise, the activities of total GP and GP-a were greater in L-iNOS-Tg mice than WT littermates after 4 h of fasting (D). After overnight fasting, GP activities were decreased both in L-iNOS-Tg and WT mice, and there was no significant difference between the two groups. The ratio of total GP to GP-a activity did not differ between the two groups. GS protein expression was significantly increased in L-iNOS-Tg mice after 4-h, but not overnight fasting, as compared with WT mice (B and E). Inhibitory phosphorylation of GS was elevated in L-iNOS-Tg mice after 4-h, but not overnight fasting, relative to WT littermates (F). Consistent with increased inhibitory phosphorylation of GS, GS activity was significantly decreased in L-iNOS-Tg mice compared with WT littermates after 4 h of fasting (G). n = 6 per group. *, p < 0.05; **, p < 0.01 versus WT; N.S., not significant.
Increased Glycogenolysis in Liver of L-iNOS-Tg Mice
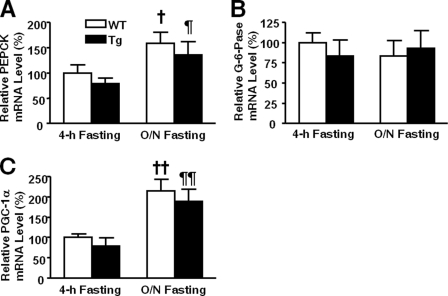
To investigate the mechanisms underlying hyperglycemia in L-iNOS-Tg mice, we evaluated the expression of genes important for gluconeogenesis, glycogenolysis, and glycogen synthesis in liver after 4 h of fasting. Unexpectedly, mRNA expression levels of gluconeogenic genes, PEPCK, G-6-Pase, and PGC-1α, did not differ between the two groups (Fig. 12).
FIGURE 12.
Expression of gluconeogenic genes was not increased in liver of L-iNOS-Tg mice. mRNA levels of PEPCK (A), G-6-Pase (B), and PGC-1α (C) did not differ in liver between L-iNOS-Tg and WT littermates after 4-h and overnight (O/N) fasting. mRNA expression of PEPCK and PGC-1α increased after overnight fasting compared with 4 h of fasting both in L-iNOS-Tg and WT mice. †, p < 0.05; ††, p < 0.01 versus WT after 4 h of fasting; ¶, p < 0.05; ¶¶, p < 0.01 versus Tg after 4 h of fasting.
In contrast, the protein expression of GP was significantly greater in the liver of L-iNOS-Tg mice relative to WT littermate after 4 h of fasting (Figs. 13, B and C), whereas no significant difference was found in the mRNA expression (supplemental Fig. 6). Consistently, the activity of GP was increased in L-iNOS-Tg mice after 4 h of fasting (Fig. 13D). After overnight fasting, however, there was no difference in GP activity between the two groups. The protein expression of GS was slightly but significantly increased in L-iNOS-Tg mice (Figs. 13, B and E). The mRNA expression of GS did not significantly differ between the two groups (supplemental Fig. 6). However, phosphorylation of GS, which inhibits GS activity, was markedly up-regulated in L-iNOS-Tg mice (Fig. 13F). The activity of GS was significantly decreased in L-iNOS-Tg mice relative to WT mice after 4 h of fasting, presumably reflecting a more pronounced increase in inhibitory phosphorylation of GS compared with the slight increase in GS expression. The combination of increased GP activity with decreased GS activity indicates elevation in net glycogen breakdown in L-iNOS-Tg mice relative to WT littermates.
Unlike 4 h of fasting, after overnight fasting there was no significant difference in the expression of GP and GS and phosphorylation of GS (Figs. 13, C and F) or in the expression of PEPCK, G-6-Pase, PGC-1α (Fig. 12), and blood glucose levels (Fig. 1B) between L-iNOS-Tg and WT mice.
Impaired Insulin Signaling in Primary Hepatocytes Isolated from L-iNOS-Tg Mice
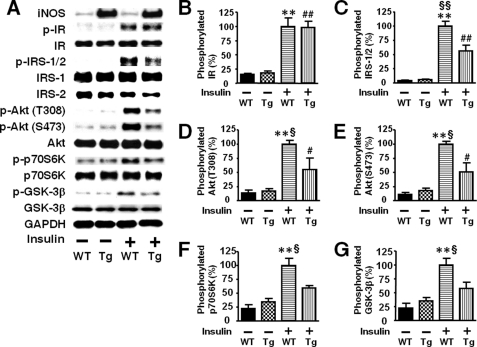
To further investigate the effects of iNOS transgene on insulin signaling, we evaluated insulin-stimulated phosphorylation in primary culture of hepatocytes. Similar to the in vivo attenuated response to insulin in liver of L-iNOS-Tg mice (Figs. 4–6), insulin-stimulated phosphorylation of IRS-1/2, Akt, GSK-3β, and p70S6K was decreased in hepatocytes isolated from L-iNOS-Tg mice compared with WT mice, whereas insulin-stimulated phosphorylation of IR did not differ between the groups (Fig. 14). The protein expression of these insulin signaling molecules was not altered by iNOS transgene in primary hepatocytes.
FIGURE 14.
Impaired insulin signaling in primary hepatocytes isolated from L-iNOS-Tg mice. Insulin-stimulated phosphorylation of IR did not differ in primary hepatocytes between L-iNOS-Tg and WT littermates. In contrast, insulin-stimulated phosphorylation of IRS-1/2, Akt, p70S6K, and GSK-3β was significantly decreased in hepatocytes from L-iNOS-Tg mice compared with WT mice. The protein expression of these molecules and GAPDH was not altered by the iNOS transgene. n = 4 per group. **, p < 0.005 versus WT without insulin; #, p < 0.05; ##, p < 0.01 versus Tg without insulin. §, p < 0.05; §§, p < 0.01 versus Tg with insulin.
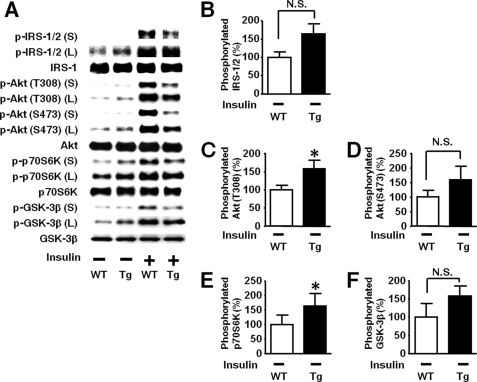
We analyzed basal phosphorylation status of the insulin-signaling molecules in the immunoblots with longer exposure. In the absence of insulin, phosphorylation of Akt at threonine 308 and p70S6K was significantly greater in primary hepatocytes from L-iNOS-Tg mice than those from WT mice (Fig. 15, A, C, and E). There were trends of increased phosphorylation of IRS-1/2, Akt at serine 473, and GSK-3β, but there was no statistical significance. Phosphorylation of IR was undetectable in the absence of insulin regardless of the genotype.
FIGURE 15.
Effects of the iNOS transgene on basal phosphorylation of insulin signaling molecules in primary hepatocytes. Basal (insulin-unstimulated, insulin −) phosphorylation was evaluated by immunoblot analysis with long exposure (L) to the membranes (A). Immunoblots with short exposure (S) showed that there was no significant difference in insulin-stimulated phosphorylation of IRS-1/2. Akt, p70S6K, and GSK-3β between L-iNOS-Tg and WT mice is shown in Fig. 14. When the results were further analyzed in the immunoblots with longer exposure, we found a significantly increased basal phosphorylation of Akt at threonine 308 and p70S6K in primary hepatocytes from L-iNOS-Tg mice (C and E). Basal phosphorylation of IRS-1/2, Akt at serine 473, and GSK-3β appeared to be increased by the iNOS transgene, but there were no significant differences (B, D, and F). n = 4 per group. *, p < 0.05, versus WT without insulin; N.S., not significant.
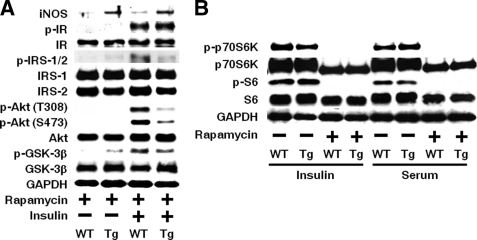
Previous studies have shown that activation of the mTOR-complex 1 (mTORC1) pathway can cause insulin resistance (32, 33). Increased basal phosphorylation of p70S6K is an indicator of activation of mTORC1 (Fig. 15E). We, therefore, examined the effects of rapamycin, an inhibitor of mTORC1, in primary hepatocytes. If any, there was little preventive effect of the 19-h treatment with rapamycin (1 μm) on the impaired insulin-stimulated phosphorylation of IRS1/2, Akt, and GSK-3β in primary hepatocytes from L-iNOS-Tg mice compared with WT mice (Fig. 16A). The effective inhibition of mTORC1 was confirmed by suppressed phosphorylation of p70S6K and S6 by rapamycin in the presence of insulin (10 nm) and 10% FBS (Fig. 16B).
FIGURE 16.
Effects of rapamycin on impaired insulin signaling in primary hepatocytes from L-iNOS-Tg mice. Treatment with rapamycin (1 μm) for 19 h did not block the decreased insulin-stimulated phosphorylation of IRS-1/2, Akt, and GSK-3β in primary hepatocytes from L-iNOS-Tg mice relative to those from WT littermates (A). Rapamycin treatment effectively suppressed phosphorylation of p70S6K and S6 even in the presence of insulin (10 nm) and 10% FBS (Serum) in primary hepatocytes from both L-iNOS-Tg and WT mice (B).
DISCUSSION
Here, we show that increased iNOS expression is sufficient to cause insulin resistance in mouse liver. NF-κB plays a critical role in obesity-induced hepatic insulin resistance (3, 4, 8). It remains unclear which target genes of NF-κB mediate hepatic insulin resistance. NF-κB is a key up-regulator/enhancer of iNOS transcription. Combined, our results highlight a role for iNOS as a major mediator of NF-κB activation-involved hepatic insulin resistance.
Hepatocyte-specific iNOS expression impaired insulin signaling at multiple levels, including IRS-1/IRS-2 and Akt (Figs. 4 and 5). In contrast, insulin-stimulated phosphorylation of IR was not attenuated by the iNOS transgene. These observations are reminiscent of our previous results in genetically obese, diabetic (ob/ob) mice that iNOS inhibitor, L-NIL, did not alter insulin-stimulated phosphorylation of IR but up-regulated insulin-stimulated phosphorylation of IRS-1/IRS-2 and Akt (10).
The reduction in insulin-stimulated Akt phosphorylation is conceivably attributable to impairment in the upstream components of the insulin signaling pathway, namely attenuated phosphorylation of IRS-1 and IRS-2. iNOS transgene decreased insulin-stimulated phosphorylation of IRS-1/IRS-2 and Akt to a comparable extent in liver (Figs. 4 and 5). Of note, the inhibitory effects of liver-specific iNOS expression seem more pronounced on phosphorylation of GSK-3β, FoxO1, and mTOR, substrates of Akt, compared with those on insulin-stimulated phosphorylation of Akt itself (Figs. 5 and 6). In the liver of L-iNOS-Tg mice, insulin-stimulated Akt phosphorylation was significantly attenuated relative to WT mice, but it was not fully abrogated. In contrast, insulin failed to increase phosphorylation of GSK-3β, FoxO1, and mTOR in L-iNOS-Tg mice, whereas it induced robust phosphorylation of these proteins in WT littermates. These findings raise the possibilities that abrogation of insulin-stimulated phosphorylation of GSK-3β, FoxO1, and mTOR by the iNOS transgene might not be fully accounted for by decreased Akt phosphorylation alone and that there might be additional molecular mechanism(s) by which iNOS inhibits insulin signaling at the level of Akt independent of Akt phosphorylation status. We found that liver-specific iNOS expression was associated with increased _S_-nitrosylation of Akt (Fig. 10), which leads to inactivation of Akt regardless of phosphorylation status (14).
These results are consistent with previous studies by us and others that _S_-nitrosylation of Akt is elevated in skeletal muscle of ob/ob mice and high fat diet-fed insulin-resistant rodents (9, 14, 30, 31). Carvalho-Filho et al. (30) have shown that treatment with aspirin, an inhibitor of the NF-κB pathway, ameliorates high fat diet-induced insulin resistance by inhibiting iNOS expression, which paralleled reversal of increased _S_-nitrosylation of Akt. Moreover, a recent study has shown that a disproportionate decrease in mTOR phosphorylation relative to Akt phosphorylation is attributable to a concomitant increase in _S_-nitrosylation of Akt in skeletal muscle of aged rats, as compared with young counterparts (34). We have previously shown that treatment with NO donor for 1 h blocks insulin-stimulated phosphorylation of FoxO1 but does not affect Akt phosphorylation in cultured cells (14), whereas treatment with NO donor for 6 h or more impairs insulin signaling at the level of IRS-1 and IRS-2 as well (10, 19). Moreover, a NO donor effectively inactivates mutated Akt, in which threonine 308 and serine 473 were substituted by glutamic acid, mimicking phosphorylation, as well as wild-type Akt in cultured cells (14). These results in cultured cells corroborated that NO donor can inactivate Akt independent of its phosphorylation status (14). Together, these findings support the notion that _S_-nitrosylation-mediated inactivation of Akt, which can occur without alterations in Akt phosphorylation, may work in concert with decreased insulin-stimulated Akt phosphorylation to contribute to hepatic insulin resistance in L-iNOS-Tg mice. One can speculate that the effects of the iNOS transgene may resemble the effects of chronic or subacute exposure to NO donor that impairs insulin signaling at IRS-1/2 as well as Akt (10, 19), whereas a 1-h treatment with NO donor directly inactivates Akt but does not affect IRS-1/2-mediated upstream insulin signaling in cultured cells (14).
Moreover, _S_-nitrosylation of IR, IRS-1, and IRS-2 was also increased in liver of L-iNOS-Tg mice. These results are in accord with previous studies in skeletal muscle of obese, diabetic mice (9, 30, 31). It is possible, therefore, that _S_-nitrosylation of these insulin signaling molecules might be involved in impaired insulin signaling at IRS-1 and IRS-2.
Non-alcoholic fatty liver disease is associated with the induction of iNOS expression and insulin resistance (35), although the role of iNOS in liver steatosis remains to be defined. Our results demonstrated that liver-specific iNOS expression per se increases hepatic triglyceride content along with elevation in lipogenic gene expression, SREBP-1c and acetyl-CoA carboxylase, in mice (Fig. 11).
In contrast to liver-specific impairment in insulin-stimulated phosphorylation of IRS-1, IRS-2, and Akt in L-iNOS-Tg mice, basal (exogenous insulin-naïve) phosphorylation of Akt was significantly increased after overnight fasting by the iNOS transgene. This seems most likely attributable to some secondary systemic effects, including hyperinsulinemia, rather than the primary local actions of the iNOS transgene in liver, because basal phosphorylation of IRS-1 and Akt was increased both in skeletal muscle and liver to a comparable extent (Figs. 7 and 9). It is important to note that our findings are consistent with previous studies showing that basal Akt phosphorylation at threonine 308 and serine 473 is increased in skeletal muscle and liver of high fat diet-induced diabetic rodents (36, 37) and Zucker (fa/fa) rats (38), although insulin-stimulated Akt phosphorylation is attenuated in these animals. The authors argued that increased basal Akt phosphorylation in insulin-resistant rodents might result from hyperinsulinemia (37, 38), although tyrosine phosphorylation of IR, IRS-1, or IRS-2 was not examined in their studies. However, our data do not exclude the possibility that as yet unclarified factors other than hyperinsulinemia may also contribute in concert to the increased basal phosphorylation of IRS-1 and Akt in both liver and muscle of L-iNOS-Tg mice, based on the following observations. We could not detect basal tyrosine phosphorylation of IR in vivo in L-iNOS-Tg or WT mice (Fig. 7A, supplemental Fig. 3). In addition, a modest but significant increase in basal (insulin-unstimulated) phosphorylation of Akt at threonine 308 and p70S6K was observed in primary hepatocytes from L-iNOS-Tg mice (Fig. 15), although it seemed less prominent compared with the increased basal phosphorylation of Akt in liver in vivo (Fig. 7E). Further studies are required to clarify the mechanisms and biological significance of increased basal phosphorylation of the insulin signaling molecules in the development of insulin resistance.
Increased basal phosphorylation of the mTOR pathway and GSK-3β (Fig. 8) corroborate that insulin resistance in L-iNOS-Tg mice is associated with increase in basal activity of the Akt pathway, as in obesity-induced diabetic rodents (36–38). It is important to note, however, that _S_-nitrosylation-mediated inactivation of Akt seems operative under basal as well as insulin-stimulated condition in L-iNOS-Tg mice, based on the more pronounced increase in basal phosphorylation of Akt compared with that of GSK-3β and mTOR (Figs. 7 and 8). Overall, our data argue that phosphorylation-dependent activation of Akt under basal conditions was attenuated but not fully negated by _S_-nitrosylation of Akt in liver of L-iNOS-Tg mice.
Impaired insulin-stimulated phosphorylation of IRS-1/2, Akt, GSK-3β, and p70S6K was observed in primary hepatocytes as well as the liver of L-iNOS-Tg mice compared with wild-type mice, whereas insulin-stimulated phosphorylation of IR did not differ between the groups (Fig. 14). Treatment of the cultured hepatocytes with rapamycin failed to reverse the impaired insulin signaling by the iNOS transgene (Fig. 16). These findings suggest that the activation of mTORC1 may not play an essential role in insulin resistance in L-iNOS-Tg mice. In line with this, basal p70S6K was not increased in L-iNOS-Tg mice relative to WT mice at 4 weeks of age when the phenotype was not yet fully developed in L-iNOS-Tg mice (supplemental Fig. 7). At 4 weeks of age L-iNOS-Tg exhibited mild hyperinsulinemia, but not hyperglycemia, after 4 h of fasting. This contrasts with increased basal phosphorylation of p70S6K in 10-week old L-iNOS-Tg mice in which hyperglycemia and more pronounced hyperinsulinemia were observed. Taken together, it seems unlikely that mTORC1 is a primary target of the iNOS transgene in mediation of hepatic insulin resistance, although it is possible that activation of the mTORC1 pathway may be an additional contributor to hepatic insulin resistance in L-iNOS-Tg mice.
Recently, increased basal Akt phosphorylation and activation of the mTOR pathway has been proposed as an inducer and/or enhancer of lipid accumulation, which in turn leads to exacerbation of insulin resistance in liver (39–41). Akt is required for SREBP-1c induction and enhanced lipogenesis in liver (39–41). Previous studies have shown the important role of chronic Akt activity in obesity-associated non-alcoholic liver steatosis (40, 42). As proposed in obesity-related liver steatosis, it is possible that the increase in basal activity of the Akt-mTOR pathway might contribute to the induction of SREBP-1c and lipogenic genes, leading to elevation in triglycerides in L-iNOS-Tg mice relative to WT mice. Further studies are required to clarify the mechanisms of increased basal phosphorylation of IRS-1, IRS-2, and Akt in L-iNOS-Tg mice and its biological impact in the paradigm of obesity and insulin resistance.
Lipid accumulation in the cells can increase activity of JNK, whereas JNK promotes the development of liver steatosis (43). As expected, phosphorylation of JNK was increased in L-iNOS-Tg mice relative to WT mice (Fig. 11H). Activation of JNK plays a critical role in obesity and insulin resistance (5, 44). Moreover, basal activation of the mTOR pathway causes insulin resistance (36, 45), although controversial results were also reported (46). Combined, one can reasonably speculate that a cascade of orchestrated events may be involved in the development of hepatic insulin resistance in vivo in L-iNOS-Tg mice. These events include not only _S_-nitrosylation of insulin signaling molecules, which is presumably one of the primary events initiated by the iNOS transgene, but also secondary hyperinsulinemia, increased basal activity of the Akt-mTOR pathway, lipid accumulation, and JNK activation.
It is noteworthy that iNOS induction in liver seems to correlate with the degree of hyperglycemia. In a previous study gene disruption of iNOS reverts impaired insulin signaling in skeletal muscle in high fat diet-induced insulin resistance in mice, but iNOS deficiency failed to ameliorate attenuated insulin signaling in liver (12). When a high fat diet fails to induce overt hyperglycemia in mice, iNOS is induced in skeletal muscle but not in liver (12). In contrast, leptin mutation elicits both overt hyperglycemia and elevated iNOS expression in liver of ob/_o_b mice (10). In aggregate, our data suggest that iNOS induction in liver may play a key role in the development of hyperglycemia.
Gluconeogenesis and glycogenolysis, namely glucose production from amino acids and glycogen, are the determinants of hepatic glucose output. The expression of genes critical for gluconeogenesis, PEPCK, G-6-Pase, and PGC-1α, did not differ between L-iNOS-Tg and WT mice (Fig. 12). These findings are in accord with a recent study that hyperglycemia is not associated with increased expression of PEPCK or G-6-Pase in liver of patients with type 2 diabetes and high fat diet-fed diabetic rodents, although the expression of PEPCK and G-6-Pase is elevated in Zucker (fa/fa) rats and db/db mice (47).
In contrast, the protein expression and activity of GP were significantly elevated after 4 h of fasting by hepatocyte-specific iNOS expression (Figs. 13, C and D). The activity of GS was reduced in L-iNOS-Tg mice along with increased inhibitory phosphorylation of GS (Figs. 13, F and G). These data suggest that an increase in glycogenolysis, rather than gluconeogenesis, may be important for the hyperglycemia observed after 4 h of fasting in L-iNOS-Tg mice and that further studies with tracers would clarify the source of the hyperglycemia.
Unlike hyperglycemia after 4 h of fasting, L-iNOS-Tg mice had normal blood glucose levels when fasted overnight. There was no difference in protein expression and activity of GP between L-iNOS-Tg and WT mice after overnight fasting, in opposition to the increased GP expression and activity in L-iNOS-Tg mice after 4 h of fasting. Thus, euglycemia and unaltered hepatic glucose output after overnight fasting in L-iNOS-Tg mice were associated with reduction in GP expression and activity. These findings, therefore, seem consistent with the notion that enhanced glycogenolysis may contribute to hyperglycemia after 4 h of fasting in L-iNOS-Tg mice.
Increased activity of GP in L-iNOS-Tg mice is in agreement with previous studies (13, 48–50). NO increases glycogenolysis in perfused liver and cultured hepatocytes, although the underlying molecular basis is unclear (48–50). We have demonstrated that iNOS inhibitor prevents lipopolysaccharide-induced activation of GP in rat liver (13). A study on the mechanisms by which NO activates GP in hepatocytes is in progress.
In conclusion, liver-specific increased iNOS expression caused hyperglycemia, hyperinsulinemia, and hepatic insulin resistance in mice. Increased expression of iNOS induced hepatic insulin resistance and hyperglycemia at least in part by impairing insulin signaling at multiple levels, including IRS-1/IRS-2 and Akt, and activation of glycogenolysis in mouse liver. Our findings also suggest that hepatocyte-specific iNOS expression causes a cascade of events that are presumably interrelated to each other and might work in concert to the development of the metabolic phenotype of L-iNOS-Tg mice in vivo. These pathophysiological events include _S_-nitrosylation, impaired insulin signaling, hyperinsulinemia, elevated basal activities of the Akt-mTOR pathway, enhanced lipogenesis, elevated glycogenolysis, and increased JNK activity.
Supplementary Material
Supplemental Data
Acknowledgments
We are grateful to Drs. B. C. Kone and G. Shiota for providing cDNA for iNOS and pGEM/Alb vector, respectively. We thank Drs. B. Lowell and J. Lawitts for helpful advice and technical assistance to generate the L-iNOS-Tg mice at the Boston Area Diabetes and Endocrinology Research Center. We also thank Dr. J. Avruch and K. Shinozaki for helpful discussion and technical assistance, respectively.
*
This work was supported, in whole or in part, by National Institutes of Health Grants R01DK05827 (to M. K.) and R01DK066301 (to H. H. D.). This work was also supported by American Diabetes Association Grants 7-08-RA-77 (to Y.-B. K.) and 1-09-RA-87 (to H. H. D.), and Korea Healthcare Technology R&D Project, Republic of Korea Grant A084651 (to C. S. C.).
2
The abbreviations used are:
NF-κB
nuclear factor κB
iNOS
inducible nitric-oxide synthase
L-iNOS-Tg
liver-specific-iNOS transgenic (Tg)
IRS
insulin receptor substrate
HPDP-biotin
_N_-(6-(biotinamido)hexyl)-3′-(2′-pyridyldithio)-propionamide
HOMA
homeostasis model assessment
PEPCK
phosphoenolpyruvate carboxykinase
G-6-Pase
glucose-6-phosphatase
PGC-1α
peroxisome proliferator-activated receptor γ coactivator-1α
SREBP-1c
sterol regulatory element-binding protein-1c
IR
insulin receptor
GS
glycogen synthase
GSK-3β
glycogen synthase kinase-3β
FoxO1
forkhead box O1
mTOR
mammalian target of rapamycin
mTORC1
mTOR-complex 1
p70S6K
p70 S6 kinase
PTP-1B
protein-tyrosine phosphatase-1B
PTEN
phosphatase and tensin homolog
GP
glycogen phosphorylase.
REFERENCES
- 1.Kaneki M., Shimizu N., Yamada D., Chang K. (2007) Antioxid. Redox. Signal 9, 319–329 [DOI] [PubMed] [Google Scholar]
- 2.Martyn J. A., Kaneki M., Yasuhara S. (2008) Anesthesiology 109, 137–148 [DOI] [PMC free article] [PubMed] [Google Scholar]
- 3.Kim J. K., Kim Y. J., Fillmore J. J., Chen Y., Moore I., Lee J., Yuan M., Li Z. W., Karin M., Perret P., Shoelson S. E., Shulman G. I. (2001) J. Clin. Invest. 108, 437–446 [DOI] [PMC free article] [PubMed] [Google Scholar]
- 4.Arkan M. C., Hevener A. L., Greten F. R., Maeda S., Li Z. W., Long J. M., Wynshaw-Boris A., Poli G., Olefsky J., Karin M. (2005) Nat. Med. 11, 191–198 [DOI] [PubMed] [Google Scholar]
- 5.Hirosumi J., Tuncman G., Chang L., Görgün C. Z., Uysal K. T., Maeda K., Karin M., Hotamisligil G. S. (2002) Nature 420, 333–336 [DOI] [PubMed] [Google Scholar]
- 6.Ozcan U., Cao Q., Yilmaz E., Lee A. H., Iwakoshi N. N., Ozdelen E., Tuncman G., Görgün C., Glimcher L. H., Hotamisligil G. S. (2004) Science 306, 457–461 [DOI] [PubMed] [Google Scholar]
- 7.Nakamura T., Furuhashi M., Li P., Cao H., Tuncman G., Sonenberg N., Gorgun C. Z., Hotamisligil G. S. (2010) Cell 140, 338–348 [DOI] [PMC free article] [PubMed] [Google Scholar]
- 8.Cai D., Yuan M., Frantz D. F., Melendez P. A., Hansen L., Lee J., Shoelson S. E. (2005) Nat. Med. 11, 183–190 [DOI] [PMC free article] [PubMed] [Google Scholar]
- 9.Carvalho-Filho M. A., Ueno M., Hirabara S. M., Seabra A. B., Carvalheira J. B., de Oliveira M. G., Velloso L. A., Curi R., Saad M. J. (2005) Diabetes 54, 959–967 [DOI] [PubMed] [Google Scholar]
- 10.Fujimoto M., Shimizu N., Kunii K., Martyn J. A., Ueki K., Kaneki M. (2005) Diabetes 54, 1340–1348 [DOI] [PubMed] [Google Scholar]
- 11.Noronha B. T., Li J. M., Wheatcroft S. B., Shah A. M., Kearney M. T. (2005) Diabetes 54, 1082–1089 [DOI] [PubMed] [Google Scholar]
- 12.Perreault M., Marette A. (2001) Nat. Med. 7, 1138–1143 [DOI] [PubMed] [Google Scholar]
- 13.Sugita H., Kaneki M., Tokunaga E., Sugita M., Koike C., Yasuhara S., Tompkins R. G., Martyn J. A. (2002) Am. J. Physiol. Endocrinol. Metab. 282, E386–E394 [DOI] [PubMed] [Google Scholar]
- 14.Yasukawa T., Tokunaga E., Ota H., Sugita H., Martyn J. A., Kaneki M. (2005) J. Biol. Chem. 280, 7511–7518 [DOI] [PubMed] [Google Scholar]
- 15.Kone B. C., Higham S. (1999) Am. J. Physiol. 276, F614–F621 [DOI] [PubMed] [Google Scholar]
- 16.Yanagitani A., Yamada S., Yasui S., Shimomura T., Murai R., Murawaki Y., Hashiguchi K., Kanbe T., Saeki T., Ichiba M., Tanabe Y., Yoshida Y., Morino S., Kurimasa A., Usuda N., Yamazaki H., Kunisada T., Ito H., Murawaki Y., Shiota G. (2004) Hepatology 40, 366–375 [DOI] [PubMed] [Google Scholar]
- 17.Geloneze B., Vasques A. C., Stabe C. F., Pareja J. C., Rosado L. E., Queiroz E. C., Tambascia M. A. (2009) Arq. Bras. Endocrinol. Metabol. 53, 281–287 [DOI] [PubMed] [Google Scholar]
- 18.Jaffrey S. R., Erdjument-Bromage H., Ferris C. D., Tempst P., Snyder S. H. (2001) Nat. Cell Biol. 3, 193–197 [DOI] [PubMed] [Google Scholar]
- 19.Sugita H., Fujimoto M., Yasukawa T., Shimizu N., Sugita M., Yasuhara S., Martyn J. A., Kaneki M. (2005) J. Biol. Chem. 280, 14203–14211 [DOI] [PubMed] [Google Scholar]
- 20.Choi C. S., Savage D. B., Abu-Elheiga L., Liu Z. X., Kim S., Kulkarni A., Distefano A., Hwang Y. J., Reznick R. M., Codella R., Zhang D., Cline G. W., Wakil S. J., Shulman G. I. (2007) Proc. Natl. Acad. Sci. U. S. A. 104, 16480–16485 [DOI] [PMC free article] [PubMed] [Google Scholar]
- 21.Furukawa N., Ongusaha P., Jahng W. J., Araki K., Choi C. S., Kim H. J., Lee Y. H., Kaibuchi K., Kahn B. B., Masuzaki H., Kim J. K., Lee S. W., Kim Y. B. (2005) Cell Metab. 2, 119–129 [DOI] [PubMed] [Google Scholar]
- 22.Kamagate A., Kim D. H., Zhang T., Slusher S., Gramignoli R., Strom S. C., Bertera S., Ringquist S., Dong H. H. (2010) Endocrinology 151, 3521–3535 [DOI] [PMC free article] [PubMed] [Google Scholar]
- 23.Perdomo G., Kim D. H., Zhang T., Qu S., Thomas E. A., Toledo F. G., Slusher S., Fan Y., Kelley D. E., Dong H. H. (2010) J. Lipid Res. 51, 1298–1311 [DOI] [PMC free article] [PubMed] [Google Scholar]
- 24.Tajima T., Goda N., Fujiki N., Hishiki T., Nishiyama Y., Senoo-Matsuda N., Shimazu M., Soga T., Yoshimura Y., Johnson R. S., Suematsu M. (2009) Biochem. Biophys. Res. Commun. 387, 789–794 [DOI] [PubMed] [Google Scholar]
- 25.Lazar D. F., Wiese R. J., Brady M. J., Mastick C. C., Waters S. B., Yamauchi K., Pessin J. E., Cuatrecasas P., Saltiel A. R. (1995) J. Biol. Chem. 270, 20801–20807 [DOI] [PubMed] [Google Scholar]
- 26.Thomas J. A., Schlender K. K., Larner J. (1968) Anal. Biochem. 25, 486–499 [DOI] [PubMed] [Google Scholar]
- 27.Pfaffl M. W. (2001) Nucleic Acids Res. 29, e45 [DOI] [PMC free article] [PubMed] [Google Scholar]
- 28.Kammoun H. L., Chabanon H., Hainault I., Luquet S., Magnan C., Koike T., Ferré P., Foufelle F. (2009) J. Clin. Invest. 119, 1201–1215 [DOI] [PMC free article] [PubMed] [Google Scholar]
- 29.Shinozaki S., Chiba T., Kokame K., Miyata T., Ai M., Kawakami A., Kaneko E., Yoshida M., Shimokado K. (2007) Horm. Metab. Res. 39, 192–196 [DOI] [PubMed] [Google Scholar]
- 30.Carvalho-Filho M. A., Ropelle E. R., Pauli R. J., Cintra D. E., Tsukumo D. M., Silveira L. R., Curi R., Carvalheira J. B., Velloso L. A., Saad M. J. (2009) Diabetologia 52, 2425–2434 [DOI] [PubMed] [Google Scholar]
- 31.Pauli J. R., Ropelle E. R., Cintra D. E., Carvalho-Filho M. A., Moraes J. C., De Souza C. T., Velloso L. A., Carvalheira J. B., Saad M. J. (2008) J. Physiol. 586, 659–671 [DOI] [PMC free article] [PubMed] [Google Scholar]
- 32.Tremblay F., Marette A. (2001) J. Biol. Chem. 276, 38052–38060 [DOI] [PubMed] [Google Scholar]
- 33.Yu Y., Yoon S. O., Poulogiannis G., Yang Q., Ma X. M., Villén J., Kubica N., Hoffman G. R., Cantley L. C., Gygi S. P., Blenis J. (2011) Science 332, 1322–1326 [DOI] [PMC free article] [PubMed] [Google Scholar]
- 34.Wu M., Katta A., Gadde M. K., Liu H., Kakarla S. K., Fannin J., Paturi S., Arvapalli R. K., Rice K. M., Wang Y., Blough E. R. (2009) PLoS One 4, e6430 [DOI] [PMC free article] [PubMed] [Google Scholar]
- 35.Fujita K., Nozaki Y., Yoneda M., Wada K., Takahashi H., Kirikoshi H., Inamori M., Saito S., Iwasaki T., Terauchi Y., Maeyama S., Nakajima A. (2010) Alcohol Clin. Exp. Res. 34, S18–S24 [DOI] [PubMed] [Google Scholar]
- 36.Khamzina L., Veilleux A., Bergeron S., Marette A. (2005) Endocrinology 146, 1473–1481 [DOI] [PubMed] [Google Scholar]
- 37.Liu H. Y., Hong T., Wen G. B., Han J., Zuo D., Liu Z., Cao W. (2009) Am. J. Physiol. Endocrinol. Metab. 297, E898–E906 [DOI] [PMC free article] [PubMed] [Google Scholar]
- 38.Katta A., Kakarla S., Wu M., Paturi S., Gadde M. K., Arvapalli R., Kolli M., Rice K. M., Blough E. R. (2009) Exp. Diabetes Res. 384683 [DOI] [PMC free article] [PubMed] [Google Scholar]
- 39.Fleischmann M., Iynedjian P. B. (2000) Biochem. J. 349, 13–17 [DOI] [PMC free article] [PubMed] [Google Scholar]
- 40.Leavens K. F., Easton R. M., Shulman G. I., Previs S. F., Birnbaum M. J. (2009) Cell Metab. 10, 405–418 [DOI] [PMC free article] [PubMed] [Google Scholar]
- 41.Li S., Brown M. S., Goldstein J. L. (2010) Proc. Natl. Acad. Sci. U. S. A. 107, 3441–3446 [DOI] [PMC free article] [PubMed] [Google Scholar]
- 42.He L., Hou X., Kanel G., Zeng N., Galicia V., Wang Y., Yang J., Wu H., Birnbaum M. J., Stiles B. L. (2010) Am. J. Pathol. 176, 2302–2308 [DOI] [PMC free article] [PubMed] [Google Scholar]
- 43.Schattenberg J. M., Singh R., Wang Y., Lefkowitch J. H., Rigoli R. M., Scherer P. E., Czaja M. J. (2006) Hepatology 43, 163–172 [DOI] [PubMed] [Google Scholar]
- 44.Tuncman G., Hirosumi J., Solinas G., Chang L., Karin M., Hotamisligil G. S. (2006) Proc. Natl. Acad. Sci. U. S. A. 103, 10741–10746 [DOI] [PMC free article] [PubMed] [Google Scholar]
- 45.Um S. H., Frigerio F., Watanabe M., Picard F., Joaquin M., Sticker M., Fumagalli S., Allegrini P. R., Kozma S. C., Auwerx J., Thomas G. (2004) Nature 431, 200–205 [DOI] [PubMed] [Google Scholar]
- 46.Miller A. M., Brestoff J. R., Phelps C. B., Berk E. Z., Reynolds T. H., 4th (2008) Am. J. Physiol. Regul. Integr. Comp. Physiol. 295, R1431–R1438 [DOI] [PMC free article] [PubMed] [Google Scholar]
- 47.Samuel V. T., Beddow S. A., Iwasaki T., Zhang X. M., Chu X., Still C. D., Gerhard G. S., Shulman G. I. (2009) Proc. Natl. Acad. Sci. U. S. A. 106, 12121–12126 [DOI] [PMC free article] [PubMed] [Google Scholar]
- 48.Borgs M., Bollen M., Keppens S., Yap S. H., Stalmans W., Vanstapel F. (1996) Hepatology 23, 1564–1571 [DOI] [PubMed] [Google Scholar]
- 49.Farghali H., Hodis J., Kutinová-Canová N., Potmesil P., Kmonícková E., Zídek Z. (2008) Physiol. Res. 57, 569–575 [DOI] [PubMed] [Google Scholar]
- 50.Hodis J., Kutinová-Canová N., Potmesil P., Kameníková L., Kmonícková E., Zídek Z., Farghali H. (2007) Physiol. Res. 56, 419–425 [DOI] [PubMed] [Google Scholar]
Associated Data
This section collects any data citations, data availability statements, or supplementary materials included in this article.
Supplementary Materials
Supplemental Data
