Identification of an imprinted master trans-regulator at the KLF14 locus related to multiple metabolic phenotypes (original) (raw)
. Author manuscript; available in PMC: 2011 Dec 1.
Published in final edited form as: Nat Genet. 2011 May 15;43(6):561–564. doi: 10.1038/ng.833
Abstract
Genome-wide association studies have identified many genetic variants associated with complex traits. However, at only a minority of loci have the molecular mechanisms mediating these associations been characterized. In parallel, whilst _cis_-regulatory patterns of gene expression have been extensively explored, the identification of _trans_-regulatory effects in humans has attracted less attention. We demonstrate that the Type 2 diabetes and HDL-cholesterol associated _cis_-acting eQTL of the maternally-expressed transcription factor KLF14 acts as a master _trans_-regulator of adipose gene expression. Expression levels of genes regulated by this _trans_-eQTL are highly-correlated with concurrently-measured metabolic traits, and a subset of the _trans_-genes harbor variants directly-associated with metabolic phenotypes. This _trans_-eQTL network provides a mechanistic understanding of the effect of the KLF14 locus on metabolic disease risk, providing a potential model for other complex traits.
Variants near the maternally-expressed transcription factor KLF14 (Kruppel-like factor 14) are robustly associated with both Type 2 Diabetes (T2D) and HDL-cholesterol levels in large-scale genome-wide association studies (GWAS)1,2. These studies have implicated a group of highly-correlated SNPs including rs4731702 and rs972283 ~14kb upstream of KLF141,2. KLF14 is the regional gene most likely to be mediating these effects since the same SNPs show adipose-specific, maternally-restricted _cis_-regulatory associations with KLF14 expression levels, a pattern which mirrors the parent-of-origin effects for T2D-susceptibility at this locus3.
Since transcription factors such as KLF14 typically modulate expression of other genes in trans, we tested for association between rs4731702 and expression levels of ~24K probes (16,663 genes) on the Illumina Human HT12 array in subcutaneous adipose tissue biopsies from a cohort of 776 healthy female twins4. The enrichment of rs4731702 _trans_-associations for low p-values (Figure 1, Supplemental Figure 1) suggests that KLF14 is a master-regulator of gene expression in adipose tissue. The pattern of _trans_-associations at KLF14 mirrors the GWAS associations (Fig 2, Suppl Fig 2), and conditioning the trans associations on rs4731702 abolishes the signal at all other SNPs. These findings indicate that the same set of SNPs (and presumably the same causal variant) underlies the _cis_-, _trans_- and metabolic trait-associations at this locus.
Figure 1. KLF14 is a master regulator of gene expression in adipose tissue.
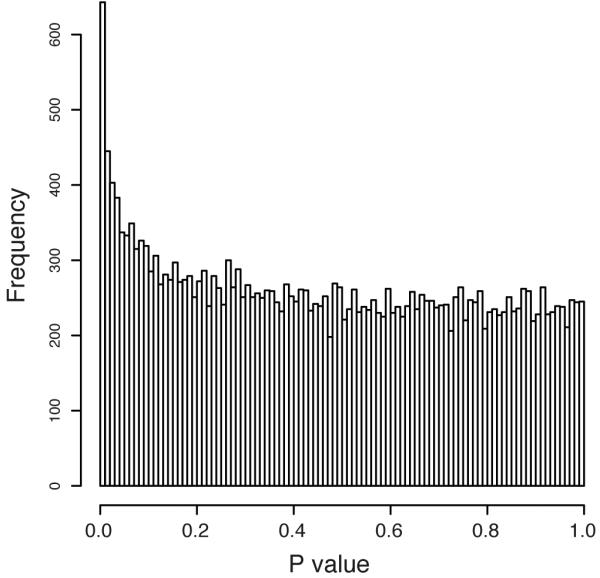
p-value distribution of association between the _KLF14 cis_-eQTL rs4731702 and expression levels of ~24K probes in adipose tissue.
Figure 2. Regional signal plots of the KLF14 locus.

Left: signal plot of a representative trans -regulated gene in the MuTHER samples (N = 776). Middle: signal plot for the Type 2 Diabetes GWA meta-analysis performed by the DIAGRAM consortium1 (stage 1 data only, effective sample size 22,044: rs972283 reached genome-wide significance after further replication). Right: signal plot for the HDL-cholesterol GWA meta-analysis performed by the Lipid Consortium (N = 99,900)2. Signal plots of all 10 genome-wide significant _trans_-regulated genes are included in Supplementary Figure 2
We focused on the ten genes (TPMT, ARSD, SLC7A10, C8orf82, APH1B, PRMT2, NINJ2, KLF13, GNB1, MYL5) showing genome-wide significant trans (GWST) associations (p < 5×10⁻⁸) driven by rs4731702. First, we sought replication of the _trans_-associations in an independent set of adipose tissue samples (deCODE Genetics; N= 589)5. As previously reported3, the deCODE data revealed a strong maternally-specific _cis_-association between rs4731702 and KLF14 expression in adipose tissue (p = 1×10⁻¹⁹) (Table1). This cis effect was not detected in the MuTHER data due to apparent problems with the KLF14 probe represented on the Illumina HT12 array used for MuTHER (See methods). Seven of the GWST genes from the MuTHER analysis had a directionally-consistent _trans_-association with p-value <0.05 in the deCODE replication set (Table 1), and we were able to show parent-of-origin effects for the _trans_-associations consistent with the maternally-specific _cis_-effects for KLF14 expression and T2D-risk3. In the deCODE replication data maternally inherited _trans_-associations were markedly more significant than general analyses and no paternally-inherited _trans_-associations were seen (Table 1).
Table 1.
Genome-wide significant (p< 5 ×10⁻⁸) associations of gene expression levels with rs4731702 at 130,083,924 (build 36) on chromosome 7. The effect allele is the Type 2 Diabetes risk allele C, which has a frequency of 55% in the HapMap CEU population.
| MuTHER Data | Decode All | DecodeMaternal | DecodePaternal | Combined MuTHER +Decode Maternal | ||||||||
|---|---|---|---|---|---|---|---|---|---|---|---|---|
| Gene | Chr | Effect(se) | Pvalue | Effect(se) | Pvalue | Effect(se) | Pvalue | Effect(se) | Pvalue | Zscore | Pvalue | Direction |
| APH1B | 15 | 0.08(0.013) | 6.2E-10 | 0.11(0.059) | 0.08 | 0.17(0.085) | 0.07(0.083) | 0.07 | 0.44 | 6.2 | 5.5E-10 | + + |
| ARSD | X | 0.08(0.012) | 0.24(0.059) | 9.4E-12 | 2.2E-04 | 0.51(0.083) | 2.6E-08 | −0.004(0.083) | 0.96 | 8.7 | 2.6E-18 | + + |
| C8orf82 | 8 | 0.09(0.014) | 2.4E-10 | 0.28(0.058) | 8.9E-06 | 0.69(0.080) | 2.1E-14 | −0.09(0.082) | 0.28 | 9.4 | 4.8E-21 | + + |
| GNB1 | 1 | 0.05(0.009) | 2.0E-08 | 0.23(0.059) | 1.8E-04 | 0.42(0.085) | 1.6E-06 | 0.06(0.084) | 0.51 | 7.3 | 3.0E-13 | + + |
| KLF13 | 15 | 0.10(0.017) | 1.1E-08 | −0.01(0.060) | 0.94 | 0.01(0.086) | 0.89 | −0.02(0.084) | 0.80 | 4.9 | 8.5E-07 | + + |
| MYL5 | 4 | 0.09(0.017) | 2.3E-08 | 0.20(0.059) | 1.3E-03 | 0.45(0.083) | 1.3E-07 | −0.04(0.083) | 0.60 | 7.5 | 5.0E-14 | + + |
| NINJ2 | 12 | 0.08(0.013) | 4.3E-09 | 0.14(0.060) | 0.03 | 0.24(0.087) | 0.01 | 0.05(0.085) | 0.59 | 6.3 | 2.2E-10 | + + |
| PRMT2 | 21 | 0.06(0.010) | 3.6E-09 | 0.18(0.060) | 0.01 | 0.27(0.087) | 6.7E-03 | 0.09(0.085) | 0.33 | 6.4 | 1.2E-10 | + + |
| SLC7A10 | 19 | −0.27(0.042) | 1.4E-10 | −0.21(0.057) | 7.4E-04 | −0.31(0.082) | 3.3E-04 | −0.11(0.081) | 0.18 | −7.3 | 2.0E-13 | − − |
| TPMT | 6 | 0.10(0.013) | 8.0E-15 | −0.04(0.060) | 0.49 | −0.03(0.087) | 0.78 | −0.06(0.084) | 0.49 | 6.4 | 1.1E-10 | + − |
The _trans_-effects explain a substantial portion of the genetically-regulated variation in GWST expression levels. Our heritability estimates of GWST-gene expression levels ranged from 0.13 to 0.79: the rs4731702 _trans_-eQTL explained between 3-7.8% of the variance in expression, corresponding to 6-25% of the heritability (Table 2). Expression levels of the ten GWST genes are moderately-correlated in adipose tissue, with a mean ∣pairwise rho∣ of 0.29 (stdev = 0.15). SLC7A10 is the only GWST gene down-regulated by the T2D-risk allele (and hence the only transcript showing anti-correlated expression levels within the GWST genes). This pattern is consistent with the known ability of the KLF family of transcription factors to act as both transcription activators and repressors6.
Table 2.
Heritability and trans-eQTL variance of GWST gene expression
| Probe ID | Gene | CHR | Transcriptionstart site(b36) | %varianceexplainedin trans | h2 | %h2 explainedin trans |
|---|---|---|---|---|---|---|
| ILMN_1767816 | APH1B | 15 | 61356801 | 3.1% | 0.13 | 23.2% |
| ILMN_1684873 | ARSD | X | 2832010 | 6.6% | 0.52 | 12.6% |
| ILMN_1693862 | C8orf82 | 8 | 145722410 | 6.9% | 0.27 | 25.4% |
| ILMN_1760320 | GNB1 | 1 | 1706588 | 4.1% | 0.19 | 21.3% |
| ILMN_1679929 | KLF13 | 15 | 29406374 | 4.3% | 0.70 | 6.2% |
| ILMN_1746948 | MYL5 | 4 | 661710 | 4.0% | 0.40 | 10.0% |
| ILMN_1731745 | NINJ2 | 12 | 543722 | 4.7% | 0.48 | 9.8% |
| ILMN_1675038 | PRMT2 | 21 | 46879954 | 4.9% | 0.55 | 8.9% |
| ILMN_1681087 | SLC7A10 | 19 | 38391409 | 5.4% | 0.79 | 6.8% |
| ILMN_1740185 | TPMT | 6 | 18236523 | 7.8% | 0.48 | 16.4% |
Further support for the hypothesis that the _trans_-effects are mediated by KLF14 expression comes from analysis of transcription-factor binding-sites in _trans_-associated genes using PSCAN7 with the JASPAR database8. KLF14 itself is not represented in JASPAR, but other KLF family members have closely related binding sites (and in some cases have been shown to compete for the same binding site)9, and KLF4 (the only KLF family member in the JASPAR database) and KLF14 share highly similar DNA binding C-terminal regions10. Though we found no evidence for enrichment after correction for multiple-testing when examining the 10 GWST genes alone, inclusion of a larger number of _trans_-associated genes (46 with trans p < 10−4 or 121 with trans p < 10−3) revealed strong evidence of enrichment for KLF4 binding sites. KLF4 was the most over-represented binding site in the former set (Bonferroni-corrected p = 0.01) and the second most over-represented site in the latter set (Bonferroni corrected p = 1.3 ×10⁻⁷) after EGR1. These data indicate that one feature of the transcripts showing trans-associations with the KLF14 SNPs is enrichment for KLF binding sites.
Having demonstrated that the same set of SNPs influences _cis_-expression of _KLF14, trans_-expression of members of the GWST-gene network, and a variety of metabolic traits including T2D and HDL-cholesterol, we sought to clarify the causal connections between these effects, and in particular to establish whether or not the _trans_-effects were likely to be mediating the metabolic associations at KLF14. First, we examined the correlations between _trans_-gene expression and concurrently-measured metabolic phenotypes. At an array-wide Bonferroni threshold of p< 1.9×10⁻⁶, expression levels of six of the ten GWST genes are associated with BMI and HDL-cholesterol, five each with triglycerides and fasting insulin levels, four with HOMA-IR (an index of insulin sensitivity) and two each with fasting glucose and adiponectin (Table 3). Compared to all genes on the array, this represents an enrichment for expression/metabolic phenotype associations, with significance ranging from p = 0.001 to p = 3.3 ×10⁻⁵. The strength of these associations is consistent with a causal link between trans gene expression and metabolic phenotypes, and provides clues to the biological processes in which these genes may participate.
Next we examined large-scale association data made available by trait-specific GWAS meta-analysis consortia, focusing on SNPs in the 250kb surrounding each GWST gene. The rs4731702 T2D risk-allele is associated with higher fasting insulin1, indicating that the primary effect on diabetes-risk is mediated by decreased peripheral insulin sensitivity. Accordingly, we focused on a set of insulin-resistance related traits including fasting insulin11, fasting glucose11, HOMA-IR11, T2D1, lipids (HDL, LDL, triglycerides)2, body fat distribution (BMI-adjusted WHR)12 and BMI13. In GWAS datasets ranging in size from 22,044-123,865 individuals, we found eight associations in five genes at a study-wide significance threshold of 1.03 ×10⁻⁴ (Table 4). (See methods for threshold determination). For example, SNPs near APH1B are associated with HDL (rs2729787; p=9.8 ×10⁻⁹) and triglycerides (rs17184382; p=1.5 ×10⁻⁵), and SNPs near KLF13 with BMI-adjusted WHR (rs4779526; p=1.8 ×10⁻⁵) and LDL (rs8034505; p=5.8 ×10⁻⁵). In addition, SNPs in MSRA (expression levels of which marginally failed to reach genome-wide significance: _trans_-association p=5.1 ×10⁻⁸) have been previously associated with waist circumference10, and are here associated with triglycerides (rs615171; p=7.5 ×10⁻⁷). This pattern of association signals reveals that variation involving GWST-genes has the potential to impact on insulin-resistance related traits, and thereby supports the notion that a subset of these genes are directly implicated in mediating the effects of KLF14 variation on disease-susceptibility.
Table 4.
GWA meta-analysis signals (p < 1.03× 10⁻⁴) within 250KB of genome-wide significant trans genes. This table also includes the results for MSRA for which the trans association marginally failed to reach genome-wide significance (p = 5.1×10⁻⁸).
| Gene | Trait | SNP | EffectAllele | Zscore | Pvalue |
|---|---|---|---|---|---|
| APH1B | HDL | rs2729787 | T | 5.73 | 9.81E-09 |
| APH1B | Triglycerides | rs17184382 | A | 4.32 | 1.58E-05 |
| C8orf82 | Type 2 Diabetes | rs2294120 | A | 1.14 (Oddsratio) | 8.43E-05 |
| NINJ2 | LDL | rs2302408 | T | 3.91 | 9.06E-05 |
| SLC7A10 | HDL | rs8182584 | T | −5.11 | 3.19E-07 |
| SLC7A10 | Waist-Hip Ratio | rs7251505 | A | −4.85 | 3.21E-06 |
| KLF13 | LDL | rs8034505 | A | 4.02 | 5.85E-05 |
| KLF13 | Waist-Hip Ratio | rs4779526 | A | 4.50 | 1.79E-05 |
| MSRA | Triglycerides | rs615171 | T | −4.95 | 7.50E-07 |
| MSRA | Waist Circumference | rs7826222 | G | 5.75 | 8.89E-09 |
One of the more interesting transcripts revealed by these analyses is SLC7A10, a member of the solute carrier family that mediates transport of neutral amino acids. Adipose expression of SLC7A10 is highly heritable (h2=0.79) and is down-regulated by the KLF14 T2D risk-allele. SLC7A10 expression is strongly-associated with diverse metabolic phenotypes; negatively correlated with BMI (p = 3×10−48), insulin (p=1.1×10−51), HOMA-IR (p=7 ×10−48), glucose (p=6×10⁻⁷), and triglycerides (p =1 ×10⁻³⁴) and positively correlated with HDL (p=7×10⁻³⁰) and adiponectin (p= 1 ×10⁻¹²) levels (Table 3). The SLC7A10 locus contains independent (r2=0.03) SNPs associated with HDL (rs8182584; p=3.2×10⁻⁷), and BMI-adjusted WHR (rs7251505; p=3.2×10⁻⁶). The former SNP (rs8182584) is weakly associated to insulin (p=0.002) and BMI (p =1.4 ×10⁻³) suggesting that this gene has a wide-ranging role in metabolism.
Table 3.
Association between expression of GWST genes and concurrently measured metabolic phenotypes. Values in each cell represent p value and (beta value).
| Gene | Adiponectin | HDL | LDL | Trigylcerides | BMI | FastingInsulin | FastingGlucose | HOMA-IR |
|---|---|---|---|---|---|---|---|---|
| APH1B | 7.7E-07 (−0.02) | 1.9E-08 (−0.11) | 0.01 (0.02) | 5.2E-17 (0.13) | 5.2E-15 (0.01) | 6.7E-18 (0.002) | 0.001 (0.05) | 1.2E-12 (0.05) |
| ARSD | 0.02 (−0.008) | 6.8E-09 (−0.10) | 0.02 (0.02) | 3.6E-11 (0.09) | 5.3E-11 (0.01) | 4.3E-16 (0.002) | 4.2E-10 (0.07) | 2.1E-11 (0.04) |
| C8orf82 | 2.8E-05 (0.02) | 4.4E-08 (0.11) | 0.008 (−0.03) | 4.1E-05 (−0.07) | 2.4E-14 (−0.01) | 6.0E-05 (−0.001) | 0.52 (−0.009) | 0.0003 (−0.02) |
| GNB1 | 0.004 (−0.008) | 6.1E-10 (−0.08) | 0.03 (0.01) | 2.1E-12 (0.08) | 2.9E-21 (0.01) | 8.4E-08 (0.001) | 0.00053 (0.03) | 9.8E-06 (0.02) |
| KLF13 | 0.17 (0.005) | 0.11 (−0.04) | 0.86 (−0.002) | 0.33 (0.02) | 0.93 (0) | 0.87 (0) | 0.02 (0.04) | 0.48 (−0.0002) |
| MYL5 | 0.00075 (0.02) | 0.00053 (0.10) | 0.19 (−0.02) | 0.8 (−0.005) | 8.4E-05 (−0.009) | 0.007 (−0.001) | 0.47 (−0.01) | 0.001 (−0.02) |
| NINJ2 | 0.85 (−0.002) | 0.03 (−0.04) | 0.03 (0.02) | 0.00012 (0.06) | 0.003 (0.005) | 0.0006 (0.001) | 0.51 (0.009) | 0.05 (0.02) |
| PRMT2 | 0.04 (0.005) | 0.06 (0.03) | 0.56 (−0.004) | 0.21 (−0.015) | 1.1E-05 (−0.006) | 0.008 (−0.0004) | 0.3 (−0.01) | 0.002 (−0.01) |
| SLC7A10 | 1.6E-14 (0.07) | 7.8E-30 (0.65) | 2.7E-05 (−0.12) | 1.7E-34 (−0.55) | 3.6E-48 (−0.08) | 1.2E-51 (−0.01) | 6.7E-07 (−0.21) | 5.3E-45 (−0.27) |
| TPMT | 0.0003 (−0.01) | 2.3E-09 (−0.11) | 0.01 (0.023) | 4.9E-16 (0.12) | 7.5E-24 (0.02) | 7.3E-21 (0.002) | 0.00057 (0.05) | 6.7E-15 (0.06) |
Our data provide convincing evidence of a bona fide adipose _trans_-eQTL and implicate this _trans_-expression network in the link between KLF14 variation and risk of metabolic disease. The _trans_-regulation uncovers novel biological links between previously-identified genome-wide significant associations at KLF14 (HDL; T2D), APH1B (HDL) and MRSA (Waist circumference) and to additional signals where metabolic trait associations have not yet been established to genome-wide significance (SLC7A10, KLF13, C8orf82, NINJ2). These links provide a framework for hypothesis-directed investigation of genetic interactions among GWAS loci and provide an example of the power of ‘integrative genomics’ to leverage ‘omics data from multiple sources to discover new biological and functional insights.
Supplementary Material
1
02
ACKNOWLEDGEMENTS
The MuTHER study was funded by the Wellcome Trust Program grant # 081917. Genotyping of TwinsUK samples was provided by the Wellcome Trust Sanger Institute and the National Eye Institute via an NIH/CIDR genotyping project. TwinsUK also receives support from the ENGAGE project grant agreement HEALTH□F4□2007□201413 and from the Dept of Health via the National Institute for Health Research (NIHR) comprehensive Biomedical Research Centre award to Guy′s & St Thomas′ NHS Foundation Trust in partnership with King′s College London. TDS is an NIHR senior Investigator and ERC senior investigator. MIMcC is supported by the Oxford NIHR Biomedical Research Centre. Additional support was provided by the Louis-Jeantet Foundation to ETD and ACN and via NIH-NIMH grant R01 MH090941 to ETD and MIMcC.
Footnotes
Competing financial interests The authors declare no competing financial interests
REFERENCES
- 1.Voight BF, et al. Twelve type 2 diabetes susceptibility loci identified through large-scale association analysis. Nat Genet. 42:579–89. doi: 10.1038/ng.609. [DOI] [PMC free article] [PubMed] [Google Scholar]
- 2.Teslovich TM, et al. Biological, clinical and population relevance of 95 loci for blood lipids. Nature. 466:707–13. doi: 10.1038/nature09270. [DOI] [PMC free article] [PubMed] [Google Scholar]
- 3.Kong A, et al. Parental origin of sequence variants associated with complex diseases. Nature. 2009;462:868–74. doi: 10.1038/nature08625. [DOI] [PMC free article] [PubMed] [Google Scholar]
- 4.Nica AC, et al. The Architecture of Gene Regulatory Variation across Multiple Human Tissues: The MuTHER Study. PLoS Genet. 7:e1002003. doi: 10.1371/journal.pgen.1002003. [DOI] [PMC free article] [PubMed] [Google Scholar]
- 5.Emilsson V, et al. Genetics of gene expression and its effect on disease. Nature. 2008;452:423–8. doi: 10.1038/nature06758. [DOI] [PubMed] [Google Scholar]
- 6.Dang DT, Pevsner J, Yang VW. The biology of the mammalian Kruppel-like family of transcription factors. Int J Biochem Cell Biol. 2000;32:1103–21. doi: 10.1016/s1357-2725(00)00059-5. [DOI] [PMC free article] [PubMed] [Google Scholar]
- 7.Zambelli F, Pesole G, Pavesi G. Pscan: finding over-represented transcription factor binding site motifs in sequences from co-regulated or co-expressed genes. Nucleic Acids Res. 2009;37:W247–52. doi: 10.1093/nar/gkp464. [DOI] [PMC free article] [PubMed] [Google Scholar]
- 8.Portales-Casamar E, et al. JASPAR 2010: the greatly expanded open-access database of transcription factor binding profiles. Nucleic Acids Res. 38:D105–10. doi: 10.1093/nar/gkp950. [DOI] [PMC free article] [PubMed] [Google Scholar]
- 9.Kaczynski J, Cook T, Urrutia R. Sp1- and Kruppel-like transcription factors. Genome Biol. 2003;4:206. doi: 10.1186/gb-2003-4-2-206. [DOI] [PMC free article] [PubMed] [Google Scholar]
- 10.McConnell BB, Yang VW. Mammalian Kruppel-like factors in health and diseases. Physiol Rev. 90:1337–81. doi: 10.1152/physrev.00058.2009. [DOI] [PMC free article] [PubMed] [Google Scholar]
- 11.Dupuis J, et al. New genetic loci implicated in fasting glucose homeostasis and their impact on type 2 diabetes risk. Nat Genet. 42:105–16. doi: 10.1038/ng.520. [DOI] [PMC free article] [PubMed] [Google Scholar]
- 12.Heid IM, et al. Meta-analysis identifies 13 new loci associated with waist-hip ratio and reveals sexual dimorphism in the genetic basis of fat distribution. Nat Genet. 42:949–60. doi: 10.1038/ng.685. [DOI] [PMC free article] [PubMed] [Google Scholar]
- 13.Speliotes EK, et al. Association analyses of 249,796 individuals reveal 18 new loci associated with body mass index. Nat Genet. 42:937–48. doi: 10.1038/ng.686. [DOI] [PMC free article] [PubMed] [Google Scholar]
- 14.Spector TD, Williams FM. The UK Adult Twin Registry (TwinsUK) Twin Res Hum Genet. 2006;9:899–906. doi: 10.1375/183242706779462462. [DOI] [PubMed] [Google Scholar]
- 15.Skidmore PM, et al. Relation of birth weight, body mass index, and change in size from birth to adulthood to insulin resistance in a female twin cohort. J Clin Endocrinol Metab. 2008;93:516–20. doi: 10.1210/jc.2007-1424. [DOI] [PubMed] [Google Scholar]
- 16.Aulchenko YS, et al. Loci influencing lipid levels and coronary heart disease risk in 16 European population cohorts. Nat Genet. 2009;41:47–55. doi: 10.1038/ng.269. [DOI] [PMC free article] [PubMed] [Google Scholar]
- 17.Richards JB, Valdes AM, Burling K, Perks UC, Spector TD. Serum adiponectin and bone mineral density in women. J Clin Endocrinol Metab. 2007;92:1517–23. doi: 10.1210/jc.2006-2097. [DOI] [PubMed] [Google Scholar]
- 18.Prokopenko I, et al. Variants in MTNR1B influence fasting glucose levels. Nat Genet. 2009;41:77–81. doi: 10.1038/ng.290. [DOI] [PMC free article] [PubMed] [Google Scholar]
- 19.Falchi M, Wilson SG, Paximadas D, Swaminathan R, Spector TD. Quantitative linkage analysis for pancreatic B-cell function and insulin resistance in a large twin cohort. Diabetes. 2008;57:1120–4. doi: 10.2337/db07-0708. [DOI] [PubMed] [Google Scholar]
- 20.Li H, Ruan J, Durbin R. Mapping short DNA sequencing reads and calling variants using mapping quality scores. Genome Res. 2008;18:1851–8. doi: 10.1101/gr.078212.108. [DOI] [PMC free article] [PubMed] [Google Scholar]
- 21.Aulchenko YS, Ripke S, Isaacs A, van Duijn CM. GenABEL: an R library for genome-wide association analysis. Bioinformatics. 2007;23:1294–6. doi: 10.1093/bioinformatics/btm108. [DOI] [PubMed] [Google Scholar]
- 22.Aulchenko YS, Struchalin MV, van Duijn CM. ProbABEL package for genome-wide association analysis of imputed data. BMC Bioinformatics. 11:134. doi: 10.1186/1471-2105-11-134. [DOI] [PMC free article] [PubMed] [Google Scholar]
- 23.Barrett T, et al. NCBI GEO: archive for functional genomics data sets--10 years on. Nucleic Acids Res. 39:D1005–10. doi: 10.1093/nar/gkq1184. [DOI] [PMC free article] [PubMed] [Google Scholar]
- 24.Visscher PM, Benyamin B, White I. The use of linear mixed models to estimate variance components from data on twin pairs by maximum likelihood. Twin Res. 2004;7:670–4. doi: 10.1375/1369052042663742. [DOI] [PubMed] [Google Scholar]
- 25.de Bakker PI, et al. Efficiency and power in genetic association studies. Nat Genet. 2005;37:1217–23. doi: 10.1038/ng1669. [DOI] [PubMed] [Google Scholar]
- 26.Teo YY, et al. A genotype calling algorithm for the Illumina BeadArray platform. Bioinformatics. 2007;23:2741–6. doi: 10.1093/bioinformatics/btm443. [DOI] [PMC free article] [PubMed] [Google Scholar]
- 27.Howie BN, Donnelly P, Marchini J. A flexible and accurate genotype imputation method for the next generation of genome-wide association studies. PLoS Genet. 2009;5:e1000529. doi: 10.1371/journal.pgen.1000529. [DOI] [PMC free article] [PubMed] [Google Scholar]
Associated Data
This section collects any data citations, data availability statements, or supplementary materials included in this article.
Supplementary Materials
1
02