Microarray analysis of peripheral blood lymphocytes from ALS patients and the SAFE detection of the KEGG ALS pathway (original) (raw)
Abstract
Background
Sporadic amyotrophic lateral sclerosis (sALS) is a motor neuron disease with poorly understood etiology. Results of gene expression profiling studies of whole blood from ALS patients have not been validated and are difficult to relate to ALS pathogenesis because gene expression profiles depend on the relative abundance of the different cell types present in whole blood. We conducted microarray analyses using Agilent Human Whole Genome 4 × 44k Arrays on a more homogeneous cell population, namely purified peripheral blood lymphocytes (PBLs), from ALS patients and healthy controls to identify molecular signatures possibly relevant to ALS pathogenesis.
Methods
Differentially expressed genes were determined by LIMMA (Linear Models for MicroArray) and SAM (Significance Analysis of Microarrays) analyses. The SAFE (Significance Analysis of Function and Expression) procedure was used to identify molecular pathway perturbations. Proteasome inhibition assays were conducted on cultured peripheral blood mononuclear cells (PBMCs) from ALS patients to confirm alteration of the Ubiquitin/Proteasome System (UPS).
Results
For the first time, using SAFE in a global gene ontology analysis (gene set size 5-100), we show significant perturbation of the KEGG (Kyoto Encyclopedia of Genes and Genomes) ALS pathway of motor neuron degeneration in PBLs from ALS patients. This was the only KEGG disease pathway significantly upregulated among 25, and contributing genes, including SOD1, represented 54% of the encoded proteins or protein complexes of the KEGG ALS pathway. Further SAFE analysis, including gene set sizes >100, showed that only neurodegenerative diseases (4 out of 34 disease pathways) including ALS were significantly upregulated. Changes in UBR2 expression correlated inversely with time since onset of disease and directly with ALSFRS-R, implying that UBR2 was increased early in the course of ALS. Cultured PBMCs from ALS patients accumulated more ubiquitinated proteins than PBMCs from healthy controls in a serum-dependent manner confirming changes in this pathway.
Conclusions
Our study indicates that PBLs from sALS patients are strong responders to systemic signals or local signals acquired by cell trafficking, representing changes in gene expression similar to those present in brain and spinal cord of sALS patients. PBLs may provide a useful means to study ALS pathogenesis.
Background
Amyotrophic lateral sclerosis (ALS) is a progressive neurodegenerative disease causing muscle weakness and wasting resulting from the loss of motor neurons in brain and spinal cord characterized by ubiquitinated inclusions in brain and spinal cord of post mortem ALS patients [1]. Several genome-wide association studies (GWAS) have shown evidence of genetic heterogeneity underlying disease susceptibility [2]. Single nucleotide polymorphisms were found in the ITPR2 (inositol 1,4,5-triphosphate receptor, type 2) [3], FGGY (FGGY carbohydrate kinase domain containing) [4], DPP6 (dipeptidyl-peptidase 6) [5], with variable strength of association with ALS and limited replication. None of these genes has been proven relevant to the pathogenesis of ALS. More recently, mutations were found in the UNC13A (unc-13 homolog A) gene [6] and in the 9p21 chomosomal locus [7]. To overcome challenges in the interpretation of results from GWAS and data from the world of "omics" in general, ALS researchers are actively engaged in integrative global bioinfomatics and the creation of ALS models for development of new ALS therapies (Euro-MOTOR project) [8]. Despite genetic heterogeneity underlying disease susceptibility, the clinical manifestations of the ALS phenotype are relatively homogeneous; suggesting that at the cellular and molecular levels there may be a convergence of a limited number of pathways that could lead to the ALS phenotype.
Gene expression profiling studies using microarrays and/or real time quantitative RT-PCR have been conducted on various tissues from rodent models for ALS such as muscle or brain tissues, lumbar spinal anterior horn tissues, spinal cord motor neurons isolated by laser capture microdissection (LCM), whole blood or peripheral blood mononuclear cells (PBMCs). Similar studies were performed on spinal cord tissues or LCM-isolated motor neurons obtained post mortem from ALS patients. Roughly, ~1000 unique genes were found differentially expressed but only ~5% differentially expressed in the same direction in more than one study [9], indicating little reproducibility. Poor reproducibility may be due to the use of different gene expression profiling methods or platforms, tissue of different origin, methods used for biological sample preparation, time of tissue collection at pre-symptomatic or symptomatic stage, and use of a particular batch of rodents or human cohort. Rather, one may find greater commonalities at the pathway alteration level with regard to apoptosis regulation, calcium regulation, oxidative stress and mitochondrial function, ER-stress and unfolded protein response (UPR), UPS and autophagy, RNA processing, DNA metabolism, axonal transport, integrity of the neuromuscular junction, muscle atrophy, and direct/indirect interactions with astrocytes, microglia and T-cells. Within these biological processes, genes of importance are those with mutations or polymorphisms shown to confer susceptibility to or cause ALS; or genes playing a critical role in the pathways that involve susceptibility genes.
A number of studies have sought blood biomarkers that may be useful to detect early signs of ALS, assess disease progression, monitor treatment effects, or track down the cause(s) of the disease, in a minimally-invasive fashion in ALS patients. Using qRT-PCR, Lin et al. (2009) have shown subtle transcriptional down-regulation of mitochondrial electron-transfer chain genes in whole blood from ALS patients [10]. Saris et al. (2009) have identified co-expressed gene modules (clusters) in total blood from sporadic ALS (sALS) patients [11]. These findings resulted from subtle differential expression of 2300 probe-encoded genes and were related to biological/disease categories such as post-translational modification, infection mechanism, inflammatory disease, neurological disorder, and skeletal and muscular disorder. Gagliardi et al. (2010) showed increased SOD1 mRNA expression in spinal cord, brain stem and lymphocytes of sporadic ALS (sALS) patients [12]. Zhang et al. (2011) identified gene expression profiles of short-term cultured PBMCs from ALS patients, demonstrating the activation of monocytes/macrophages via the LPS/TLR4 neuroinflammatory pathway [13]. Lincecum et al. (2010) demonstrated the activation in ALS pathogenesis of a co-stimulatory pathway bridging the activation of T-cell responses and the amplification of the innate immune response, based on gene expression profiles obtained from whole blood of the G93A SOD1 mouse model and ALS patients [14]. Circulating white blood cells might acquire certain properties from long distance signals mediated by small metabolites or macromolecules circulating in peripheral blood. They might also acquire novel properties from trafficking at sites of neurodegeneration associated with rupture of the blood brain barrier or blood-spinal cord barrier in early and late ALS to a variable degree. Further investigation in this area of ALS research is critically needed [15].
In the current work, we analyzed RNA extracted from PBLs of ALS patients and control subjects, thereby reducing some of the complexity of mixed expression patterns generated by RNA from reticulocytes, granulocytes, monocytes, thrombocytes and plasma, normally present in whole blood. Indeed, gene expression profiles of blood-derived samples are strongly dependent on the predominant constituent cell type(s) [16,17]. Analyses of mRNA expression data by LIMMA [18], SAM [19] and SAFE [20], revealed alterations of the ubiquitin/proteasome system (UPS). Using proteasome inhibition assays, parallel changes of UPS activity at the protein level were determined in subcultured PBMCs (mainly composed of lymphocytes) from ALS patients, by Western blot analysis.
Methods
Isolation of peripheral blood lymphocytes from ALS patients and controls
During year 2007 until March 2008, blood samples to be used for microarray analysis were collected at Carolinas Neuromuscular/ALS-MDA Center with approval by the IRB at Carolinas Medical Center. Informed consent was obtained from all participants to this study. ALS diagnosis was determined according to the El Escorial Criteria for "definite" ALS after exclusion of other conditions [21]. Disease onset was defined as time of initial weakness, dysarthria or dysphagia. Blood samples (~18 mL) were drawn from sporadic definite ALS patients and healthy control (HC) subjects by venipuncture into tubes adequate for either serum or lymphocyte isolation. The healthy controls (HCs) consisted of 9 white females (mean age 51.4 ± 11 (standard deviation) years) and 2 white males (64, 65). The sALS patients consisted of one black male (49), one black female (69), 5 white females (mean age 59 ± 20 years), and 4 white males (mean age 47 ± 9 years). Table 1 presents the clinical characteristics of the enrolled patients and healthy controls subjected to microarray analysis. PBMCs were isolated using Histopaque™-1077 density gradient centrifugation method. Using this procedure, yields were generally 1-2 × 10⁶ PBMCs per mL of blood. Lymphocytes were further enriched to over 90% purity from the PBMC fraction by subsequent PERCOLL gradient centrifugation [22]. Blood samples were processed immediately upon reception in the lab within 30 minutes after blood draw.
Table 1.
Demographic and clinical data for ALS patients (n = 11) and healthy controls (n = 11) enrolled for Agilent Human Whole Genome 4 × 44k Array analysis
| Clinical Data at Time of Collection | ALS patients | Healthy controls |
|---|---|---|
| Mean age ± SD | 53.8 ± 13 | 52.2 ± 11 |
| Female | 6 | 9 |
| Male | 5 | 2 |
| Bulbar onset | 2 | - |
| Limb onset | 8 | - |
| Generalized | 1 | - |
| ALSFRS-R <24 | 5 | - |
| ALSFRS-R >24 | 6 | - |
| Onset of weakness ≤1 yr | 4 | - |
| Onset of weakness 1-5 yrs | 4 | - |
| Onset of weakness >5 yrs | 3 | - |
| Mean age of onset ± SD | 47.2 ± 18 | - |
| Death <3 yrs post-onset | 3 | - |
| Death >5 yrs post-onset | 2 | - |
| Mean age of death (n = 5) ± SD | 62.2 ± 12 | - |
RNA extraction, amplification, and dual mode reference design microarrays
The common reference design [23] was used for sample assignment in the dual color mode of expression assay on the Agilent Human Whole Genome 4 × 44k Microarrays to analyze ~40000 transcripts. Microarray experiments were performed, in which each of the 22 RNA samples (HC and sALS) was co-hybridized with RNA from the HC reference pool that was constituted with equal amounts of each of the 11 RNA samples from healthy controls. Total RNA stored in TRIzol (Invitrogen) at -80°C, was extracted from the lymphocyte samples at Cogenics, Inc. (Morrisville, NC) by standard procedures. The quantity of each of the total RNA samples and determination of the A260/280 nm ratio was determined by spectrophotometry and the size distribution was assessed using an Agilent Bioanalyzer. Fifty nanograms of total RNA was converted into labelled cRNA with nucleotides coupled to a fluorescent dye (either Cy3 or Cy5) using the Quick Amp Kit (Agilent Technologies, Palo Alto, CA) following the manufacturer's protocol. The A260/280 nm ratio and yield of each of the cRNAs were determined and a quality assessment was done using an Agilent Bioanalyzer. Equal amounts of Cy3 and Cy5-labeled cRNA (825 ng) from two different samples were hybridized to Agilent Human Whole Genome 4 × 44k Microarrays. The hybridized array was washed and scanned and data were extracted from the scanned image using Feature Extraction version 10.2 (Agilent Technologies). The non-normalized and normalized microarray datasets have been deposited in the NCBI Gene Expression Omnibus [24] as series GSE28253.
Statistical analyses and SAFE data mining
Raw data .txt files in Agilent format were converted to .MEV files using ExpressConverter™ v2.1 of the TM4 Microarray Suite (TIGR Genomics, Rockville, CA). Background-subtracted raw data were normalized using the MIDAS pipeline (TM4, TIGR Genomics, Rockville, MD) according to Sioson et al. (2006) with the following steps: total intensity normalization, LocFit (LOWESS), standard deviation regularization and low intensity trim [25]. Filtering stringencies requiring that the integrated signal intensities (ISI) for each Cy3 and Cy5 channels were more than two standard deviation(s) of the Cy3 and Cy5 background (ISI = 7000), generated the dataset DS7000 [7199 probes, 5540 unique genes]. DS7000 was subjected to LIMMA [18] and SAM [19] analyses using TMeV v4.5.1 program (TM4, TIGR Genomics, Rockville, MD) to determine differentially expressed genes. The false discovery rate (FDR) was 1.17% (delta = 0.90) for DS7000. SAFE analysis was performed with Bioconductor 2.5 according to Barry, Nobel, and Wright (2005) [20] to identify gene sets demonstrating different expression levels between classes of comparison. Default settings for local (t-test) and global (Wilcoxon) statistics were used. Comparisons were based on gene ontology databases for biological processes, molecular functions, cellular components, and the protein families (Pfam) and KEGG databases.
Total ubiquitination and proteasome inhibition assays with PBMCs from ALS patients and healthy controls
Freshly isolated PBMCs (composed of ~80% lymphocytes and ~20% of monocytes per flow cytometry analysis) from ALS patients and healthy controls, were subcultured overnight (O.N.) for 18 hr at 37°C in RPMI (Invitrogen) supplemented with 10% FCS (Invitrogen) and supplemented or not with added-back matched autologous serum that had been prepared in parallel. These PBMCs were treated, or not treated, for 1.5 hrs at 37°C with the reversible proteasome inhibitor MG132 (Sigma). For each patient or healthy control, serum was prepared separately from PBMCs from the same blood draw. Matched serum was supplemented at a concentration of 20% to the O.N. cultures. A total of 750000 cells were seeded per well of a 48-well plate. Cells were treated with 10 μM proteasome inhibitor MG132 or DMSO vehicle at 0.09% for 1.5 hrs. Cells were collected and snap frozen until Western blot analysis. Cells were lysed into RIPA buffer (150 mM NaCl, 1.0% IGEPAL® CA-630, 0.5% sodium deoxycholate, 0.1% SDS, 50 mM Tris, pH 8.0) including protease inhibitor cocktails [complete Mini EDTA-free protease inhibitor cocktail tablets (Roche) and Protease Inhibitor cocktail P8340 (Sigma)]. Total protein was quantified using BioRad Dc protein assay. An aliquot (20 μg total protein) was supplemented with 2x Laemmli's sample buffer and boiled for 5 minutes prior to separation by sodium dodecyl sulfate (SDS)-12.5% polyacrylamide gel electrophoresis for 130 min at 100V. Proteins were transferred to polyvinylidene difluoride membranes (Millipore) and quenched with blocking buffer containing 10% non-fat milk in PBS-0.1 Tween 20 for 1 hr at room temperature. The membranes were incubated overnight at 4°C with primary monoclonal anti-ubiquitin sc-8017 antibody (1/1000 dilution; Santa Cruz) diluted in the blocking buffer. Membranes were subsequently incubated with goat anti-mouse human absorbed HRP-secondary sc-2055 antibody (1/10000 dilution; Santa Cruz) for 30 minutes and assayed using the Super Signal Pico chemiluminescence detection system (Thermo Fisher Scientific). Subsequent reprobing with anti-beta-actin antibody sc-81178 (Santa Cruz) was performed by stripping membranes of bound antibodies in stripping buffer (62.5 mM Tris HCL, 2% SDS, and 100 mM 2-mercaptoethanol [pH 6.7]) at 56°C for 20 minutes. ECL films and a LAS3000 imaging system (Fuji) were used for detection of the chemiluminescence. Silver staining was used to confirm loading homogeneity in the PAGEs post-electrotransfer using SilverSNAP stain (Thermo Fisher Scientific), in addition to reprobing of the membranes for beta-actin.
Semi-quantitative analysis of the Western blot data
Raw images were processed in ImageJ program (Dr. Wayne Rasband, wayne@codon.nih.gov, National Institute of Mental Health, Bethesda, Maryland, USA). The accumulated HMW ubiquitinated protein forms were delineated by a rectangular area, for which the background subtracted integrated density could be measured. The integrated density could then be measured for same area below the accumulated forms at a level of the blotting membrane demonstrating consistency of staining throughout the lanes, thereby providing a contrast reference area per lane. Calculation of a signal-to-noise (S/N) ratio for the accumulated forms was then determined independently from the detection of beta-actin that was achieved by stripping and reprobing the Western blot membranes.
Results
We studied gene expression profiles of lymphocytes isolated from 11 patients diagnosed with definite sporadic ALS (sALS) and 11 healthy control subjects. Clinical characteristics for this cohort are described in Table 1. Figure 1 summarizes results from microarray data normalization and LIMMA, SAM and SAFE analyses.
Figure 1.
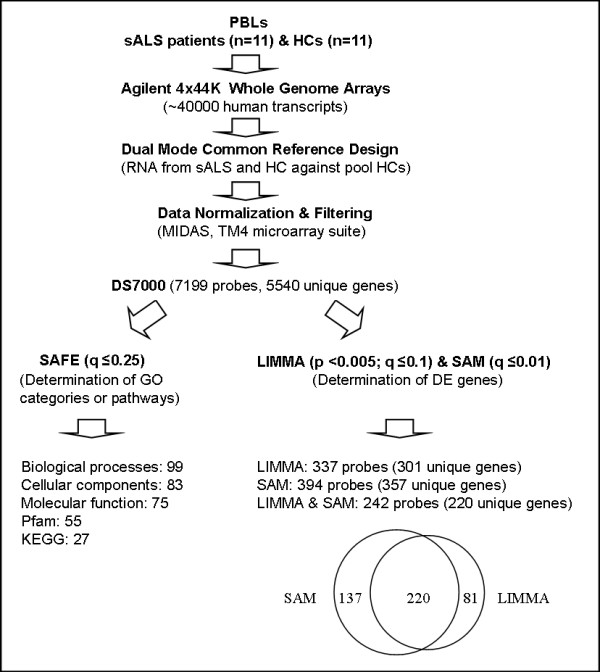
Normalization, filtering, SAFE, LIMMA and SAM analyses of lymphocyte-derived microarray data from ALS patients and healthy controls. Microarray analyses were performed on purified PBLs isolated from patients affected by sporadic amyotrophic lateral sclerosis (sALS) (n = 11) and healthy control subjects (HCs) (n = 11). The dual color mode in the common reference design was used to interrogate the expression of ~40000 transcripts (~30000 unique genes) using Agilent Human Whole Genome 4 × 44k Microarrays. Raw expression data were normalized and filtered using the MIDAS pipeline in the TM4 microarray suite (TIGR Genomics, Rockville, MD) to generate the dataset DS7000. SAFE was used for testing enrichment of functional gene ontology (GO) categories related to biological processes, molecular functions, cellular components, protein families (Pfam) and the KEGG databases. DS7000 was subjected to LIMMA and SAM analyses using TM4/TMeV v4.5.1 to determine differentially expressed (DE) genes. The online tool Data Overlapping and Area-Proportional Venn Diagram (http://bioinforx.com/free/bxarrays/overlap.php) was used to generate the Venn diagram.
LIMMA and SAM analyses
Differentially expressed genes between ALS patients and healthy controls were determined using LIMMA (pLIMMA < 0.001, qLIMMA ≤ 10%) and SAM (qSAM ≤ 1%) in TM4/TMeV v4.5.1 program [25] for the dataset DS7000 (Figure 1). A significant overlap was found by comparing LIMMA and SAM results (Figure 1, Additional File 1). Table 2 presents the 24 most differentially expressed genes (qSAM = 0%, pLIMMA < 0.0005, qLIMMA ≤ 10%). Five genes (C12orf35, DYNLT1, IRS2, SKIV2L2, and TARDBP) were significant at high stringency (qSAM = 0%, pLIMMA < 0.001, qLIMMA < 5%). C12orf35, DYNLT1, SKIV2L2, and TARDBP were upregulated 1.5-1.8 fold change (FC), while IRS2 was downregulated by two fold. DYNLT1 (dynein, light chain, Tctex-type 1) encodes a component of the dynein-dynactin complex composed of dynactin (DCTN1), those mutations have been involved in ALS [26], while TARDBP encodes TAR DNA binding protein 43 (TDP-43), those mutations may cause ALS [27]. TIA-1, a marker of stress granules that colocalizes with TDP-43 inclusions in frontotemporal lobar degeneration (FTLD-U) and ALS [28], is also upregulated (FC = 1.4, qSAM = 0%, pLIMMA < 0.005, qLIMMA~10%; Additional File 1. SKIV2L2 encodes a DEAD-box RNA helicase which is part of the exosome and spliceosome complexes [29,30] and it is known, for example, that some DEAD-box RNA helicases interact with FUS/TLS to control pre-mRNA splicing [31]. Defects or deregulation in RNA processing are a hallmark in the pathogenesis of motor neuron diseases, since motor neurons may be uniquely sensitive to perturbations in RNA processing pathways [32]. We also note that IL7R (interleukin-7 receptor subunit alpha), polymorphisms of which have been associated with risk in multiple sclerosis [33], is upregulated (FC = 1.7, qSAM = 0%, p < 0.005, Additional File 1). In addition, we identified upregulation (FC = 1.4, qSAM~0.5%, pLIMMA < 0.005, qLIMMA~10%) of RTN4IP1 (reticulon 4 interacting protein alias NOGO-interacting mitochondrial protein), a mitochondrial protein that interacts with reticulon 4, a potent inhibitor of regeneration following spinal cord injury [34]. We also identified upregulation of SOD1 (FC = 1.3, q~1%, pLIMMA<0.05, qLIMMA~10%), confirming the work by Gagliardi et al. (2010) [12].
Table 2.
Differentially expressed genes in peripheral blood lymphocytes from ALS patients by SAM (q = 0) ranked by independent LIMMA (p < 0.0005)
| α Probe | β Symbol | γ Gene Description | δ p value | ε q value | χ FC |
|---|---|---|---|---|---|
| A23P8185 | DYNLT1 | dynein, light chain, Tctex-type 1 | 0.000004 | 0.028 | 1.5 |
| A24P154037 | IRS2 | insulin receptor substrate 2 | 0.000015 | 0.048 | 0.5 |
| A32P234935 | TARDBP | TAR DNA binding protein | 0.000024 | 0.048 | 1.6 |
| A23P98930 | C12orf35 | chromosome 12 open reading frame 35 | 0.000031 | 0.048 | 1.6 |
| A23P110661 | SKIV2L2 | superkiller viralicidic activity 2-like 2 | 0.000033 | 0.048 | 1.8 |
| A23P104624 | ENDOD1 | endonuclease domain containing 1 | 0.000069 | 0.083 | 1.5 |
| A23P317800 | ANAPC4 | anaphase promoting complex subunit 4 | 0.000106 | 0.100 | 1.4 |
| A23P21673 | KIAA1797 | KIAA1797 | 0.000150 | 0.100 | 1.5 |
| A23P145437 | PHIP | pleckstrin homology domain interacting protein | 0.000185 | 0.100 | 1.4 |
| A23P15714 | NSF | N-ethylmaleimide-sensitive factor | 0.000210 | 0.100 | 1.6 |
| A23P82588 | C7orf55 | chromosome 7 open reading frame 55 | 0.000234 | 0.100 | 1.6 |
| A23P120153 | RNF149 | ring finger protein 149 | 0.000290 | 0.100 | 1.7 |
| A23P70998 | tcag7.903 | full-length cDNA clone CS0DF028YG12 | 0.000308 | 0.100 | 1.5 |
| A23P145874 | SAMD9L | sterile alpha motif domain containing 9-like | 0.000310 | 0.100 | 2.1 |
| A24P172481 | TRIM22 | tripartite motif-containing 22 | 0.000319 | 0.100 | 1.5 |
| A23P42664 | SHFM1 | split hand/foot malformation (ectrodactyly) type 1 | 0.000328 | 0.100 | 1.6 |
| A23P156355 | TMEM161B | transmembrane protein 161B | 0.000340 | 0.100 | 1.5 |
| A23P129925 | SLFN11 | schlafen family member 11 | 0.000364 | 0.100 | 1.5 |
| A24P209455 | GIMAP4 | GTPase, IMAP family member 4 | 0.000383 | 0.100 | 1.8 |
| A23P84775 | PLRG1 | pleiotropic regulator 1 | 0.000386 | 0.100 | 1.5 |
| A23P213255 | SMARCAD1 | SWI/SNF-related, matrix-associated actin-dependent regulator of chromatin, subfamily a, containing 1 DEAD/H box 1 | 0.000445 | 0.100 | 1.6 |
| A23P19565 | ASCC3 | activating signal cointegrator 1 complex subunit 3 | 0.000457 | 0.100 | 1.4 |
| A23P61854 | KIAA0372 | tetratricopeptide repeat protein 37 | 0.000461 | 0.100 | 1.4 |
| A23P91891 | COPB2 | coatomer protein complex, subunit beta 2 | 0.000471 | 0.100 | 1.9 |
SAFE identification of molecular signatures in lymphocytes from ALS patients
SAFE [20] is a resampling-based procedure that is similar to GSEA (Gene Set Enrichment Analysis) [35], but with more flexible choices of test statistics. SAFE was used to obtain information on unifying biological themes from databases specific for (i) gene ontology (GO) pathways/categories (biological process, cellular component and molecular function), (ii) pathways/categories defined by the KEGG (Kyoto Encyclopedia of Genes and Genomes) and (iii) Pfam (protein families). Such resampling procedures have been shown to provide more accurate control of false positives than simpler enrichment-test methods using only lists of p-values [36].
Following determination of local (t-test) and global (Wilcoxon test) statistics using SAFE default settings, the significance for each gene set category was determined by bootstrap re-sampling and multiple test correction (for the multiple categories examined) by an FDR procedure with qSAFE < 25% considered significant (similarly to GSEA). This relatively liberal threshold was intended to avoid false negatives, although many of the findings presented here achieve more striking significance. For SAFE gene ontology category analysis, gene sets of 5-100 genes were examined, similar to restrictions used by others (e.g., Barry et al., 2005) [20]. This approach ensures that gene sets were not so small as to call into question a "pathway" interpretation, and not so large as to defy biological interpretation. In addition, the approach helps to manage the multiple testing penalties across numerous categories. To simplify overall interpretation, we only reported "upregulated" categories to highlight pathway activations caused by the disease rather than pathway inhibitions.
Significant upregulated categories representing gene sets associated with "biological processes", "cellular components", and "KEGG pathways" are shown in Tables 3, 4 and 5. We used same gene set size restriction (5-100 genes) for SAFE analysis of KEGG gene ontology groups including the KEGG Human Disease pathways, of which 25 were annotated in Bioconductor 2.5 for the Agilent platform. We identified that the KEGG ALS pathway was significant (qSAFE = 18%). The KEGG ALS pathway was the only significantly upregulated disease pathway among the 25 disease pathways (Additional File 2). In addition, we considered all 34 KEGG Human Disease pathways annotated in Bioconductor 2.5 for the Agilent platform among 55 total represented in the KEGG database (http://www.genome.jp/kegg-bin/get_htext?htext=br08901&query=%22Human%20Diseases%22&option=-s) [37] by including gene set sizes >100 in a secondary analysis.
Table 3.
SAFE gene ontology pathways related to Biological Processes affected in peripheral blood lymphocytes from ALS patients
| α Pathway | β Sizes | δ q-value | ε GO Term |
|---|---|---|---|
| DNA Metabolism | |||
| GO:0006310 | 54/71 | 0 | DNA recombination |
| GO:0006302 | 27/50 | 0.003 | double-strand break repair |
| GO:0000718 | 12/21 | 0.0414 | nucleotide-excision repair DNA damage removal |
| ER and Golgi | |||
| GO:0006895 | 6/7 | 0.0071 | Golgi to endosome transport |
| GO:0006888 | 26/43 | 0.1127 | ER to Golgi vesicle-mediated transport |
| GO:0006904 | 10/19 | 0.0071 | vesicle docking during exocytosis |
| GO:0006892 | 11/41 | 0.0471 | post-Golgi vesicle-mediated transport |
| GO:0007041 | 7/6 | 0.1885 | lysosomal transport |
| Mitochondrial Function | |||
| GO:0022904 | 53/98 | 0.0558 | mitochondrial ATP synthesis coupled electron transport |
| respiratory electron transport chain | |||
| GO:0006120 | 44/43 | 0.0523 | mitochondrial electron transport NADH to ubiquinone |
| GO:0006626 | 17/25 | 0.0972 | protein targeting to mitochondrion |
| GO:0006119 | 81/8 | 0.1 | oxidative phosphorylation |
| Neurological Function | |||
| GO:0010001 | 8/13 | 0.1 | glial cell differentiation |
| GO:0042552 | 8/30 | 0.1138 | myelination |
| Oxidation | |||
| GO:0019395 | 19/6 | 0.2252 | fatty acid oxidation |
| RNA Metabolism | |||
| GO:0000387 | 25/26 | 0.003 | spliceosomal snRNP biogenesis |
| GO:0033119 | 10/3 | 0.0071 | negative regulation of RNA splicing |
| GO:0051028 | 81/62 | 0.0644 | mRNA transport |
| PTM | |||
| GO:0070206 | 7/7 | 0 | protein trimerization |
| GO:0018279 | 8/47 | 0.0071 | protein amino acid N-linked glycosylation via asparagine |
| GO:0051262 | 10/12 | 0.0644 | protein tetramerization |
| GO:0006465 | 7/9 | 0.0835 | signal peptide processing |
| GO:0045116 | 8/7 | 0.0644 | protein neddylation |
| GO:0016925 | 15/11 | 0.0627 | protein sumoylation |
| UPS | |||
| GO:0051443 | 62/6 | 0.0644 | positive regulation of ubiquitin-protein ligase activity |
| GO:0051444 | 59/4 | 0.0644 | negative regulation of ubiquitin-protein ligase activity |
| GO:0043161 | 79/43 | 0.0644 | proteasomal ubiquitin-dependent protein catabolic process |
| Viral Infection | |||
| GO:0019047 | 11/8 | 0.044 | provirus integration |
| GO:0019059 | 18/12 | 0.0852 | initiation of viral infection |
| GO:0019058 | 41/92 | 0.0644 | viral infectious cycle |
Table 4.
SAFE gene ontology pathways related to Cellular Components affected in peripheral blood lymphocytes from ALS patients
| α Pathway | β Sizes | δ q-value | ε GO Term |
|---|---|---|---|
| Cytoskeleton | |||
| GO:0005868 | 6/10 | 0.001 | cytoplasmic dynein complex |
| GO:0005885 | 8/7 | 0.0322 | Arp2/3 protein complex |
| ER and Golgi | |||
| GO:0030130 | 9/9 | 0.0001 | clathrin coat of trans-Golgi network vesicle |
| GO:0008250 | 8/10 | 0.0001 | oligosaccharyltransferase complex |
| GO:0030660 | 23/6 | 0.0001 | Golgi-associated vesicle membrane |
| GO:0030134 | 7/3 | 0.0057 | ER to Golgi transport vesicle |
| GO:0005791 | 12/20 | 0.0613 | rough endoplasmic reticulum |
| GO:0030131 | 18/19 | 0.024 | clathrin adaptor complex |
| GO:0030119 | 18/5 | 0.024 | AP-type membrane coat adaptor complex |
| GO:0001669 | 8/34 | 0.2372 | acrosomal vesicle |
| GO:0030127 | 6/8 | 0.0122 | COPII vesicle coat |
| GO:0030126 | 8/12 | 0.003 | COPI vesicle coat |
| Mitochondria | |||
| GO:0005758 | 22/30 | 0.0004 | mitochondrial intermembrane space |
| GO:0005763 | 20/18 | 0.0002 | mitochondrial small ribosomal subunit |
| GO:0000276 | 7/8 | 0.0006 | mitochondrial proton-transporting ATP synthase complex coupling factor F(o) |
| GO:0005747 | 44/44 | 0.0126 | mitochondrial respiratory chain complex I |
| GO:0005742 | 6/6 | 0.024 | mitochondrial outer membrane translocase complex |
| Motor Neuron | |||
| GO:0031594 | 8/25 | 0.028 | neuromuscular junction |
| GO:0030424 | 21/133 | 0.1525 | axon |
| Nucleus | |||
| GO:0005680 | 12/24 | 0.0167 | anaphase-promoting complex |
| GO:0000777 | 18/61 | 0.1854 | condensed chromosome kinetochore |
| GO:0000779 | 20/4 | 0.1989 | condensed chromosome centromeric region |
| GO:0000783 | 9/9 | 0.1197 | nuclear telomere cap complex |
| GO:0005643 | 51/67 | 0.2084 | nuclear pore |
| GO:0005637 | 10/28 | 0.1318 | nuclear inner membrane |
| Transcriptional Complexes | |||
| GO:0016591 | 43/6 | 0.001 | DNA-directed RNA polymerase II holoenzyme |
| GO:0000178 | 11/9 | 0.0025 | exosome (RNase complex) |
| GO:0016580 | 10/8 | 0.0712 | sin3 complex |
| GO:0005669 | 11/20 | 0.1817 | transcription factor TFIID complex |
| UPS | |||
| GO:0005832 | 5/7 | 0.0001 | chaperonin-containing T-complex |
| GO:0000151 | 57/57 | 0.0003 | ubiquitin ligase complex |
| GO:0000152 | 14/2 | 0.024 | nuclear ubiquitin ligase complex |
| GO:0031461 | 10/8 | 0.0012 | cullin-RING ubiquitin ligase complex |
| GO:0005839 | 20/14 | 0.0167 | proteasome core complex |
| GO:0016272 | 8/10 | 0.0402 | prefoldin complex |
| GO:0008180 | 8/10 | 0.003 | signalosome |
Table 5.
SAFE analysis of the KEGG pathway database
| α Pathway (UP) | β Size | δ q-value | ε GO Term |
|---|---|---|---|
| Disease | |||
| KEGG:05014 | 92/54 | 0.1831 | Amyotrophic lateral sclerosis |
| DNA Metabolism | |||
| KEGG:03030 | 35/36 | 0.2048 | DNA replication |
| KEGG:03410 | 46/34 | 0.0003 | Base excision repair |
| KEGG:03420 | 42/44 | 0.0758 | Nucleotide excision repair |
| KEGG:03430 | 36/23 | 0.1367 | Mismatch repair |
| KEGG:03440 | 13/28 | 0.0003 | Homologous recombination |
| RNA Metabolism | |||
| KEGG:03018 | 55/54 | 0.0007 | RNA degradation |
| KEGG:03020 | 16/29 | 0.0296 | RNA polymerase |
| KEGG:00970 | 18/63 | 0.005 | Aminoacyl-tRNA biosynthesis |
| Mitochondrial Function | |||
| KEGG:00062 | 5/8 | 0.0381 | Fatty acid elongation in mitochondria |
| KEGG:00071 | 17/44 | 0.1726 | Fatty acid metabolism |
| Amino acid Metabolism | |||
| KEGG:00270 | 22/36 | 0.0261 | Cysteine and methionine metabolism |
| KEGG:00280 | 24/44 | 0.025 | Valine leucine and isoleucine degradation |
| KEGG:00290 | 7/11 | 0.0072 | Valine leucine and isoleucine biosynthesis |
| KEGG:00310 | 24/44 | 0.0385 | Lysine degradation |
| KEGG:00450 | 13/26 | 0.2048 | Selenoamino acid metabolism |
| Carbohydrate Metabolism | |||
| KEGG:00632 | 8/33 | 0.0003 | Benzoate degradation via CoA ligation |
| KEGG:00640 | 18/32 | 0.0381 | Propanoate metabolism |
| KEGG:00650 | 13/30 | 0.0003 | Butanoate metabolism |
| KEGG:00670 | 8/18 | 0.0177 | One carbon pool by folate |
| KEGG:00903 | 7/32 | 0.0425 | Limonene and pinene degradation |
| KEGG:00510 | 31/49 | 0.2155 | N-Glycan biosynthesis |
| Cell-Cell Communication | |||
| KEGG:04330 | 35/47 | 0.2288 | Notch signaling pathway |
| Chaperone-dependent protein transport | |||
| KEGG:03060 | 13/23 | 0.0573 | Protein export |
| Neuromuscular | |||
| KEGG:04260 | 46/77 | 0.1493 | Cardiac muscle contraction |
| UPS | |||
| KEGG:03050 | 42/45 | 0.032 | Proteasome |
| KEGG:04120 | 93/138 | 0.032 | Ubiquitin mediated proteolysis |
We found that only neurodegenerative disease pathways (4 in total) were significantly upregulated (Additional File 2). In this latter analysis, ALS was less significant than the other three neurodegenerative diseases (Huntington's disease, Parkinson's disease, Alzheimer's disease), suggesting that neurodegeneration affects lymphocytes to a greater extent than ALS-specific biological processes. Nevertheless, such interpretation has to be taken with caution. Indeed, some genes represented on the pathway maps of these other three neurodegenerative diseases are related to the UPS, cytoskeleton or dynein-dynactin complex, and therefore should be represented on the KEGG ALS pathway. However, ALS, Alzheimer's, Huntington's and Parkinson's are all neurodegenerative diseases related to aging and/or associated with mitochondrial dysfunction. For this reason, results are in alignment with the results of Saris et al. (2009) [11]. Prion disease, generally thought to be less related to the other neurodegenerative disorders, was found not significant (Additional File 2).
A total of 54 unique gene IDs (including the pseudogene caspase 12) constitute the KEGG ALS pathway (hsa05014) [37] and correspond to 36 protein entities defining unique proteins or protein complexes (Figure 2). A total of 35 protein entities corresponding to 53 genes represented on the KEGG ALS pathway map (pseudogene CASP12 excluded) include membrane receptors, cytosolic or secreted proteins, kinases, phosphatases, proteases, and protein channels, which are likely to play a direct/indirect role in ALS pathogenesis to a variable degree at different stages that lead to motor neuron degeneration. Some protein entities may correspond to different isoforms represented by unique gene IDs. For example, calcineurin (CaN entity) may be composed by three catalytic isoforms (α,β,γ) encoded by three different chromosomes and many types of glutamate receptors may represent the GluR entity (Figure 2).
Figure 2.

Genes from lymphocytes of ALS patients contributing to the perturbation of the KEGG ALS pathway per SAFE analysis. The KEGG (Kyoto Encyclopedia of Genes and Genomes) ALS pathway map relates to motor neuron degeneration in the context of a microenvironment represented by glial cells and can be found online at http://www.genome.jp/kegg/pathway/hsa/hsa05014.html. There are 54 unique gene entries (including CASP12 pseudogene) defined by ENTREZ identities. There are 36 protein entities represented on the map that are not all designated by official HUGO gene symbols. Red dashed areas represent subpathway modules affected by differentially expressed genes. Up or down-regulations determined following SAFE for DS7000 are shown by (↑) or (↓), unchanged is shown by (=) (fold changes in expression and HUGO gene symbols are reported in Table 6). HUGO aliases for protein entities represented on the map are as follows: ALS2 [_ALS2_], Apaf1 [_APAF1_], ASK1 [_MAP3K5_], Bad [_BAD_], Bax [_BAX_], Bcl2 [_BCL2_], Bcl-XL [_BCL2L1_], Bid [_BID_], CaN [CHP, CHP2, PPP3CA, PPP3CB, PPP3CC, PPP3R1, _PPP3R2_], CASP1 [_CASP1_], CASP3 [_CASP3_], CASP9 [_CASP9_], CASP12 [_CASP12_], CAT [_CAT_], CCS [_CCS_], CytC [_CYCS_], Daxx [_DAXX_], Derlin-1 [_DERL1_], EAAT2 [_SLC1A2_], GPX1 [_GPX1_], GluR [GRIA1, GRIA2, GRIN1, GRIN2A, GRIN2B, GRIN2C, _GRIN2D_], MKK3 [_MAP2K3_], MKK6 [_MAP2K6_], p38 [MAPK11, MAPK12, MAPK13, _MAPK14_], NEFH [_NEFH_], NEFL [_NEFL_], NEFM [_NEFM_], NOS1 [_NOS1_], p53 [_TP53_], PRPH [PRPH, _PRPH2_], Rab5 [_RAB5A_], Rac1 [_RAC1_], SOD1 [_SOD1_], TNF-α [_TNF_], TNFR [TNFRSF1A, _TNFRSF1B_], and Tom [TOMM40, _TOMM40L_].
There were 23 unique genes (43%, 81 probes), the aggregate expression pattern of which contributes to the perturbation of the KEGG ALS pathway (Table 6). The number of protein entities defined by these genes and represented on the KEGG ALS pathway map was 19 out of 35 (54%) (Table 6, Figure 2). The dynamics of up- and down-regulations, assuming they are functionally effective, may be interpreted as responses to signals originating from serum or cell-cell interactions. For example upregulation of ASK1 (alias MAP3K5) may be associated with an ER-stress response that correlates with ALS progression (Figure 2). Also, assuming that transcriptional regulation produces more or less active protein with appropriate subcellular localization and in a timely manner, about half of the genes would have a negative effect on motor neuron survival while the rest would have a positive effect according to current ALS literature. This said contribution of aggregate expression to a pathway does not necessarily signify differential expression of each participant gene in terms of differences between the mean expression levels in lymphocytes from ALS vs. healthy controls. One limitation is that individual protein entities of the UPS, the dynein-dynactin complex, and TARDBP/TDP43 pathway and other elements of ALS pathogenesis are not represented on the KEGG ALS pathway, so that other potential aggregate effects relevant of ALS pathogenesis cannot be determined using the current gene set. However, pathway perturbations were determined by SAFE for genes belonging to the UPS both in terms of "biological process" and "cellular components" affected (Tables 3 and 4). Gene ontology categories corresponding to gene sets related to the UPS (AmiGO database) [38] included the following: positive or negative regulation of ubiquitin-protein ligase, proteasomal ubiquitin-dependent proteins [GO:0051443, 6 proteins; GO:0051444, 4 proteins; GO:0043161, 43 proteins] (Table 3); chaperonin-containing T-complex, ubiquitin ligase complex, nuclear ubiquitin ligase complex, cullin-RING ubiquitin ligase complex, proteasome core complex, prefoldin complex, and signalosome [GO:0005832, 7 proteins; GO:0000151, 57 proteins; GO:0000152, 2 proteins; GO:0031461, 8 proteins; GO:0005839, 14 proteins, GO:0016272, 10 proteins; GO:0008180, 10 proteins] (Table 4). Considering gene listing overlaps, UPS GO categories for biological processes and cellular components found significant by SAFE, represent altogether 234 unique proteins defined by official HUGO (Human Genome Organization) gene nomenclature. Among 220 unique genes that were differentially expressed, as determined by SAM and LIMMA, (Figure 1, Additional File 1), nine are related to the UPS, including four E3 ubiquitin ligases (RNF149, TRIM22, UBR1, and UBR2) (Table 7). Also, ANAPC4, SHFM1, SUGT1, UBR1 and UBR2 were represented by the UPS GO groups found significant by SAFE.
Table 6.
Genes differentially expressed in lymphocytes from ALS patients compared to healthy controls and contributing to the KEGG ALS pathway as determined by SAFE
| α Entrez Gene ID | β Symbol | γ Description | δ SAFE | ε PS/PT | λ FC | κ Effect in ALS | τ LR | ||
|---|---|---|---|---|---|---|---|---|---|
| 57679 | ALS2 | amyotrophic lateral sclerosis 2 (juvenile) | - | n.d. | < | ↓ | - | [11586298] | n.d. |
| 317 | APAF1 | apoptotic peptidase activating factor 1 | - | n.d. | < | ↑ | - | [16046141] | n.d. |
| 572 | BAD | BCL2-associated agonist of cell death | + | 1/1 | 1.38 ↓ | ↑ | - | [19043451] | + |
| 581 | BAX | BCL2-associated X protein | + | 10/11 | 1.11 ↓ | ↑ | - | [17171827] | + |
| 596 | BCL2 | apoptosis regulator B-cell CLL/lymphoma 2 | + | 10/11 | 1.07 ↑ | ↑ | + | [20460269] | + |
| 598 | BCL2L1 | inhibitor of cell death BCL2-like 1 | - | n.d. | < | ↑ | + | [12097494] | n.d. |
| 637 | BID | BH3 interacting domain death agonist | + | 1/2 | < | ↑ | - | [12213439] | n.d. |
| 834 | CASP1 | caspase 1, apoptosis-related cysteine peptidase | + | 1/1 | 1.54 ↑ | ↑ | - | [10764647] | - |
| 836 | CASP3 | caspase 3, apoptosis-related cysteine peptidase | + | 10/10 | 1.20 ↑ | ↑ | - | [10764647] | - |
| 842 | CASP9 | caspase 9, apoptosis-related cysteine peptidase | - | 2/2 | 1.07 ↑ | ↑ | - | [14657037] | - |
| 847 | CAT | catalase (heme containing) | + | 1/1 | 1.46 ↑ | ↑ | + | [8731383] | + |
| 9973 | CCS | copper chaperone for superoxide dismutase | - | 1/1 | 1.08 ↓ | ↓ | - | [17389365] | - |
| 11261 | CHP | calcineurin B homolog | + | 1/1 | 1.16 ↑ | ↑ | + | [11350981] | + |
| 63928 | CHP2 | calcineurin B homologous protein 2 | - | n.d. | < | ↑ | + | [12226101] | n.d. |
| 54205 | CYCS | cytochrome c, somatic | + | 2/3 | 1.10 ↑ | ↓ | - | [17454840] | + |
| 1616 | DAXX | death-domain associated protein | - | n.d. | < | ↑ | - | [12354397] | n.d. |
| 79139 | DERL1 | degradation in endoplasmic reticulum protein 1 | + | 1/1 | < | ↑ | - | [18519638] | n.d. |
| 2876 | GPX1 | glutathione peroxidase 1 | + | 1/1 | 1.22 ↓ | ↓ | - | [9335008] | - |
| 2890 | GRIA1 | glutamate receptor, ionotropic, AMPA 1 | - | n.d. | < | ↓ | - | [8981413] | n.d. |
| 2891 | GRIA2 | glutamate receptor, ionotropic, AMPA 2 | - | n.d. | < | ↓ | - | [8981413] | n.d. |
| 2902 | GRIN1 | glutamate receptor, ionotropic, N-methyl D-aspartate 1 | + | 2/2 | 1.44 ↓ | ↓ | - | [1320444] | - |
| 2903 | GRIN2A | glutamate receptor, ionotropic, N-methyl D-aspartate 2A | - | n.d. | < | ↓ | - | [8842405] | n.d. |
| 2904 | GRIN2B | glutamate receptor, ionotropic, N-methyl D-aspartate 2B | - | n.d. | < | ↓ | + | [16490316] | n.d. |
| 2905 | GRIN2C | glutamate receptor, ionotropic, N-methyl D-aspartate 2C | - | n.d. | < | ↓ | + | [11717388] | n.d. |
| 2906 | GRIN2D | glutamate receptor, ionotropic, N-methyl D-aspartate 2D | + | 1/1 | 1.58 ↓ | ↑ | + | [15152019] | - |
| 5606 | MAP2K3 | mitogen-activated protein kinase kinase 3 | + | 1/1 | 1.34 ↓ | ↑ | - | [17686961] | + |
| 5608 | MAP2K6 | mitogen-activated protein kinase kinase 6 | - | 1/1 | 1.32 ↑ | ↑ | - | [16219474] | - |
| 4217 | MAP3K5 | mitogen-activated protein kinase kinase kinase 5 | + | 1/1 | 1.10 ↑ | ↑ | - | [15910777] | - |
| 5600 | MAPK11 | mitogen-activated protein kinase 11 | - | n.d. | < | ↑ | - | [9218798] | n.d. |
| 6300 | MAPK12 | mitogen-activated protein kinase 12 | - | n.d. | < | ↑ | - | [9169156] | n.d. |
| 5603 | MAPK13 | mitogen-activated protein kinase 13 | - | n.d. | < | ↑ | - | [9218798] | n.d. |
| 1432 | MAPK14 | mitogen-activated protein kinase 14 | + | 10/10 | 1.26 ↑ | ↑ | - | [15910777] | - |
| 4744 | NEFH | neurofilament, heavy polypeptide | - | n.d. | < | ↓ | - | [7849698] | n.d. |
| 4747 | NEFL | neurofilament, light polypeptide | - | n.d. | < | ↓ | - | [15207859] | n.d. |
| 4741 | NEFM | neurofilament, medium polypeptide | - | n.d. | < | ↓ | - | [11732278] | n.d. |
| 4842 | NOS1 | nitric oxide synthase 1 (neuronal) | - | n.d. | < | ↑ | - | [15033415] | n.d. |
| 5530 | PPP3CA | protein phosphatase 3, catalytic subunit, alpha isozyme | + | 3/3 | 1.06 ↑ | ↓ | - | [11701756] | + |
| 5532 | PPP3CB | protein phosphatase 3, catalytic subunit, beta isozyme | + | 1/1 | 1.28 ↑ | ↓ | - | [15312178] | + |
| 5533 | PPP3CC | protein phosphatase 3, catalytic subunit, gamma isozyme | + | 1/1 | < | ↓ | - | [15312178] | n.d. |
| 5534 | PPP3R1 | protein phosphatase 3, regulatory subunit B, alpha | - | n.d. | < | ↓ | - | [11754729] | n.d. |
| 5535 | PPP3R2 | protein phosphatase 3, regulatory subunit B, beta | - | n.d. | < | ↓ | - | [11754729] | n.d. |
| 5630 | PRPH | peripherin | - | n.d. | < | ↓ | - | [20363051] | n.d. |
| 5961 | PRPH2 | peripherin 2 | - | n.d. | < | ↓ | - | [8125718] | n.d. |
| 5868 | RAB5A | ras-related protein Rab-5A | + | 1/1 | 1.11 ↓ | ↓ | + | [11316809] | + |
| 5879 | RAC1 | ras-related C3 botulinum toxin substrate 1 | + | 12/12 | 1.08 ↓ | ↓ | - | [18219391] | - |
| 6506 | SLC1A2 | sodium-dependent glutamate/aspartate transporter 2 | - | n.d. | < | ↑ | + | [14530974] | n.d. |
| 6647 | SOD1 | superoxide dismutase 1, soluble | + | 11/11 | 1.24 ↑ | ↓ | - | [20644736] | + |
| 7124 | TNF | tumor necrosis factor alpha | + | 1/1 | 1.15 ↑ | ↑ | + | [18823372] | + |
| 7132 | TNFRSF1A | tumor necrosis factor receptor superfamily, member 1A | - | n.d. | < | ↑ | - | [11917000] | n.d. |
| 7133 | TNFRSF1B | tumor necrosis factor receptor superfamily, member 1B | - | n.d. | < | ↓ | + | [11917000] | n.d. |
| 10452 | TOMM40 | mitochondrial import receptor subunit TOM40 homolog | - | n.d. | < | ↓ | - | [20797528] | n.d. |
| 84134 | TOMM40L | mitochondrial import receptor subunit TOM40B | - | 1/1 | 1.23 ↓ | ↓ | - | [20797528] | - |
| 7157 | TP53 | tumor protein p53 | - | n.d. | < | ↑ | - | [8609941] | n.d. |
Table 7.
Differentially expressed genes related to the UPS, as determined by SAM and LIMMA
| α Probe | β Symbol | γ Accession | δ FC | ε Functional Description |
|---|---|---|---|---|
| A_23_P317800 | ANAPC4 | NM_013367 | 1.40 | anaphase promoting complex subunit 4: Component of the anaphase promoting complex/cyclosome (APC/C), a cell cycle-regulated E3 ubiquitin ligase that controls progression through mitosis and the G1 phase of the cell cycle. The APC/C complex acts by mediating ubiquitination and subsequent degradation of target proteins: it mainly mediates the formation of 'Lys-11'-linked polyubiquitin chains and, to a lower extent, the formation of 'Lys-48'- and 'Lys-63'-linked polyubiquitin chains |
| A_23_P106741 | PSMD7 | NM_002811 | 1.41 | proteasome (prosome, macropain) 26S subunit, non-ATPase, 7: Acts as a regulatory subunit of the 26S proteasome which is involved in the ATP-dependent degradation of ubiquitinated proteins |
| A_23_P120153 | RNF149 | NM_173647 | 1.67 | E3 ubiquitin-protein ligase RNF149: Unknown |
| A_23_P42664 | SHFM1 | NM_006304 | 1.63 | split hand/foot malformation (ectrodactyly) type 1: Subunit of the 26S proteasome which plays a role in ubiquitin-dependent proteolysis |
| A_24_P172481 | TRIM22 | NM_006074 | 1.55 | E3 ubiquitin-protein ligase TRIM22: Interferon-induced antiviral protein involved in cell innate immunity. The antiviral activity could in part be mediated by TRIM22-dependent ubiquitination of viral proteins. Plays a role in restricting the replication of HIV-1, encephalomyocarditis virus (EMCV) and hepatitis B virus (HBV). Acts as a transcriptional repressor of HBV corepromoter. May have E3 ubiquitin-protein ligase activity. |
| A_23_P203137 | UBE4A | NM_004788 | 1.34 | ubiquitin conjugation factor E4 A: Binds to the ubiquitin moieties of preformed conjugates and catalyzes ubiquitin chain assembly in conjunction with E1, E2, and E3. |
| A_23_P152066 | UBR1 | NM_174916 | 1.33 | ubiquitin protein ligase E3 component n-recognin 1: E3 ubiquitin-protein ligase which is a component of the N-end rule pathway. Recognizes and binds to proteins bearing specific N-terminal residues that are destabilizing according to the N-end rule, leading to their ubiquitination and subsequent degradation. Plays a critical role in chromatin inactivation and chromosome-wide transcriptional silencing during meiosis via ubiquitination of histone H2A. Binds leucine and is a negative regulator of the leucine-mTOR signaling pathway, thereby controlling cell growth. |
| A_23_P362637 | UBR2 | NM_015255 | 1.25 | ubiquitin protein ligase E3 component n-recognin 2: Same as for UBR1 |
| A_32_P178945 | YOD1 | NM_018566 | 1.52 | YOD1 OTU deubiquinating enzyme 1 homolog alias HIV-1-induced protease: Hydrolase that can remove conjugated ubiquitin from proteins and participates in endoplasmic reticulum-associated degradation (ERAD) for misfolded lumenal proteins. May act by triming the ubiquitin chain on the associated substrate to facilitate their threading through the VCP/p97 pore. Ubiquitin moieties on substrates may present a steric impediment to the threading process when the substrate is transferred to the VCP pore and threaded through VCP's axial channel. Mediates deubiquitination of both 'Lys-48'- and 'Lys-63'-linked polyubiquitin chains. Able to cleave both polyubiquitin and di-ubiquitin. |
Assessment of alteration of UPS-related gene expression in lymphocytes from ALS patients based on microarray data
Correlation of ANAPC4, SHFM, SUGT1, UBR1 and UBR2 with demographic and disease parameters was determined. Among these five genes, UBR2 (Ubiquitin-protein ligase E3-alpha-2) encoded protein is known to act in conjunction with UBR1 in a quality control pathway for degradation of unfolded cytosolic proteins [39]. We calculated Spearman correlation between expression data and length of the disease from symptom onset and the ALS Functional Rating Scale-Revised score (ALSFRS-R) at the time of peripheral blood sampling. Significant correlation was found between UBR2 increased gene expression and time of disease from onset to time of lymphocyte sampling (r = -0.8091, p = 0.0039), as well as ALSFRS-R (r = 0.6333, p = 0.0402) (Figure 3, Table 8). Similar to Saris et al. (2009) [11], we found no correlation between the expression of these genes with gender, age at onset, age at collection, and site of onset. However, unlike Saris et al. (2009) [11] but similar to Zhang et al. (2006) [13] we present correlations of individual genes with disease duration and ALSFRS-R.
Figure 3.
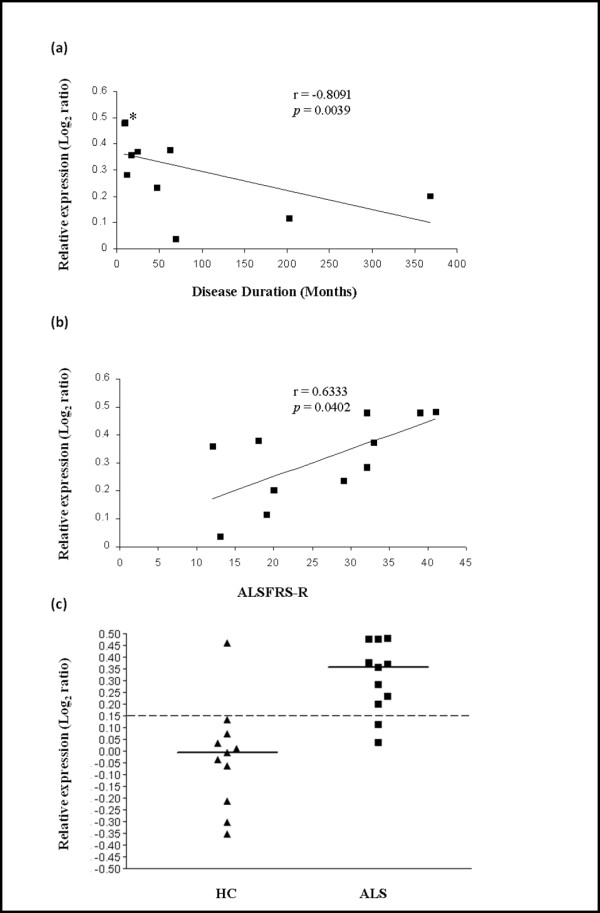
Relationship between UBR2 transcriptional expression in lymphocytes from ALS patients and progression of the disease. Expression of UBR2 varies inversely with the length of the disease from onset to lymphocyte gene expression testing, and varies directly with the ALS-FRS-R score. Duration of the disease from onset to sampling (i.e. Disease Duration) (a) (*three close values) or the ALSFRS-R score at the time of sampling (b) are indicated on the x-axis. Log2 ratios of expression obtained from the dual mode reference design are represented on the y axis. Dot plot (c) shows that with a cut-off of 0.15, discrimination between ALS patients [ALS] and healthy controls [HC] for UBR2 expression is achieved with p = 0.000953 (Fisher's exact test).
Table 8.
Correlation between expression data of differentially expressed UPS genes and ALSFRS-R or disease duration
| Spearman Correlation | |||
|---|---|---|---|
| Gene | Probe | Disease Duration | ALSFRS-R |
| ANAPC4 | A_23_P317800 | r = -0.0364 | r = -0.2642 |
| p = 0.9241 | p = 0.4348 | ||
| SHFM1 | A_23_P42664 | r = 0.3909 | r = -0.3144 |
| p = 0.2366 | p = 0.3415 | ||
| SUGT1 | A_23_P162787 | r = 0.3636 | r = -0.3736 |
| p = 0.2731 | p = 0.2608 | ||
| UBR1 | A_23_P152066 | r = 0.0636 | r = 0.2323 |
| p = 0.8603 | p = 0.4854 | ||
| UBR2 | A_23_P362637 | r = -0.8091 | r = 0.6333 |
| p = 0.0039* | p = 0.0402* |
Assessment of alteration of the UPS in PBMCs from ALS patients using proteasome inhibition assays
We employed the MG132 proteasome inhibition assay to test whether the UPS transcriptional alterations described above are accompanied by ubiquitination changes at the protein level. MG132 blocks the proteolytic activity of the 26S proteasome complex reversibly, which inhibits the degradation of ubiquitin-conjugated proteins and has multiple effects including, for instance, reducing muscle atrophy associated with disuse [40] or increasing caspase-mediated generation of TDP-43 C-terminal fragments [41]. We prepared peripheral blood mononuclear cell (PBMC) short-term cultures from ALS patients (n = 6) and healthy control subjects (n = 5). High molecular weight (HMW) poly-ubiquitinated protein forms were detected in protein lysates of these PBMCs by Western blot analysis using monoclonal anti-ubiquitin antibody similarly to Jury et al. (2003) [42]. For PBMCs from healthy control subjects, cultured in RPMI [10% FCS] medium, accumulation of HMW poly-ubiquitinated proteins was induced by MG132 treatment, but this accumulation was partially mitigated by the supplementation of the RPMI [10% FCS] medium with matched autologous human serum at a final concentration of 20% (Figure 4). For PBMCs from ALS patients, cultured in RPMI [10% FCS] medium, accumulation of HMW poly-ubiquinated proteins was induced by MG132 treatment, and this accumulation was further increased by addition of autologous human serum from each ALS patient (Figure 4).
Figure 4.
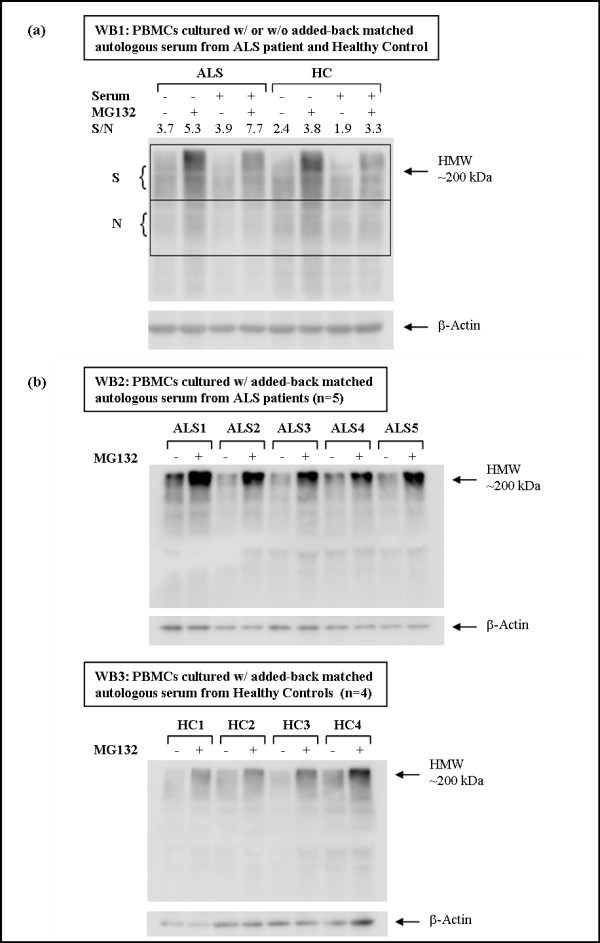
Total ubiquitination Western blot (WB) analysis of cultured PBMCs from ALS patients and controls in the presence or absence of added-back serum for 16 hours and treated or not with proteasome inhibitor MG132 for 1.5 hr. Comparison of PBMCs from one healthy control and one ALS patient incubated or not in the presence of added-back matched autologous serum is shown in (a). Semi-quantitative Western blot analysis was performed to measure the accumulation of high molecular weight (HMW) ubiquitinated protein species in PBMCs that were prepared the same day from one healthy control and one ALS patient (WB1). A signal (S) to noise (N) ratio (S/N) was determined with ImageJ program by comparing the integrated density of two areas consistently stained throughout the membrane and visually contrasting the accumulation of HMW ubiquitinated protein species (WB1). ALS patient serum exacerbates the effects of MG132 on total ubiquitination and accumulation of HMW ubiquitinated species, while serum from healthy control mitigates these effects. Comparison of PBMCs from ALS patients (n = 5) and healthy controls (n = 4) incubated in the presence of added-back matched autologous serum is shown in (b). PBMCs obtained at different times from additional ALS patients (n = 5) and healthy controls (n = 4) show similar result (WB2 and WB3).
Discussion
We report, for the first time, genome-wide expression profiling of purified lymphocytes from patients with amyotrophic lateral sclerosis. This study, performed with the long oligonucleotide Agilent Human Whole Genome 44 × 4K Array, demonstrates that ALS relevant differential gene expression and pathway perturbations can be identified in peripheral blood lymphocytes by a functional enrichment method such as SAFE [20] and not only in brain or spinal cord that are directly affected by the disease. In the search for blood biomarkers in neurological disorders, determination of molecular signatures or pathway alterations becomes critical in the analysis of microarray data generated from the blood compartment. This is due to the fact that at the genome-wide scale of gene expression, relevant biological differences may be modest or even negligible relative to the noise. The expression profiling studies on whole blood from ALS patients by Saris et al. (2009) [11] and Lin et al. (2009) [10] clearly illustrate the challenge for data interpretation when variations in gene expression are minimal and performed by different methods. In the first case, 2300 probe-encoded genes were differentially expressed with fold changes in expression (ALS vs. controls) varying from 1.015 to 1.588 (mean value ± SD = 1.097 ± 0.073). In the second case, Lin et al. (2009) also reported small fold changes in expression of four mitochondrial genes of the electron transport chain (FLAD1, RFK, CYCS, and SDHB). A broader range of fold changes in expression for subcultured PBMCs was reported in the work by Zhang et al. (2011) [13] which could be due to subculture conditions and/or the method chosen for normalization of the microarray data [43,44]. In our study, fold changes in expression for the genes found significant by SAM and LIMMA (i.e. DS3500), varied from 1.244 to 3.422 (mean value ± SD = 1.556 ± 0.28). Therefore, one may not expect to correlate differential expression by qRT-PCR for many genes due to the large sample size required to eventually confirm small changes in expression. This problem is partially circumvented by global pathway analysis methods. Many differentially expressed genes identified by SAM and LIMMA may be subjectively placed in the context of ALS pathogenesis. In addition, there was little overlap with 166 genes that were found associated with ALS to a variable degree in several single-gene and genome-wide association studies (GWAS). For instance, TARDBP, SOD1, KIFAP3 and COX7C were differentially expressed in our study. TARDBP and SOD1, clearly associated with ALS pathogenesis, have also been identified by various genetic analyses for their association with ALS. The fact that SAFE, LIMMA, and SAM identified SOD1 mRNA upregulation to be significant confirms findings by Gagliardi et al. (2010). Gagliardi et al. showed that SOD1 mRNA levels were increased in spinal cord, brain stem, and lymphocytes of sporadic ALS patients, but did not correlate with gender, age or duration of the disease [12].
For the first time, gene expression data from the blood compartment from sporadic ALS patients could be associated with the KEGG ALS disease pathway and KEGG disease pathways of neurodegenerative disorders such as Alzheimer's, Parkinson's and Huntington's diseases. Considering that global genome-wide subtle changes in gene expression were used for this determination, this result is rather unexpected. Protein activity changes that are caused by the presence of the disease are generally not expected to consistently correspond to transcriptional regulations. Our use of purified lymphocytes has likely provided a better dataset to study ALS-specific signature in the blood compartment as opposed to total blood.
However, because of the small sample size of our study (n = 22) and because ALS is a heterogeneous disease, it is not possible to capture the breadth of the disease process occurring during onset and progression of the disease. In addition, disease responses in lymphocytes may not mirror many of the disease processes occurring in brain, which depend on the alteration of the blood brain barrier and the microenvironment represented by glia and microglia. Furthermore, assuming that transcriptional regulation produces more or less active protein with appropriate subcellular localization and in a timely manner, about half of the genes based on their expression would have a negative effect on motor neuron survival while the rest would have a positive effect according to current ALS literature (Table 6). This clearly indicates very limited replication of processes occurring in brain or spinal cord of ALS patients. Thus, while similar pathways are affected in motor neurons and lymphocytes due to a possible systemic common cause(s), it is expected that some responses may differ in their details possibly reflecting differential susceptibility.
In our pathway analysis of the dataset DS7000 generated with Agilent Human Whole Genome 4 × 44K Array, SAFE identified alteration of gene expression pertaining to gene ontology (GO) categories relevant to ALS pathogenesis (and/or other neurological diseases), such as DNA metabolism, RNA splicing, mitochondrial function, oxidation, ER and Golgi functions, UPS, neurological function, post-translational modification and viral infection. These results are consistent with findings by Saris et al. (2009) that were determined by whole blood RNA profiling [11]. However, following pathway analysis using SAFE, we went further in the analysis of transcriptional alterations of the UPS by identifying a correlation between the expression of differentially expressed individual UPS-related genes and the time of presence of the disease or the ALSFRS-R. Indeed, whole exome sequencing identified mutations in the gene encoding valosin-containing protein (VCP), a key component of the UPS, as a cause of familial ALS, demonstrating that disturbances of UPS function may be closely linked to ALS pathogenesis [45]. A total of nine differentially expressed genes, were related to the UPS including four ubiquitin ligases representative of UPS GO groups identified by SAFE (ANAPC4, SHFM1, UBR1, and UBR2). Differential expression of the "N-end rule" ubiquitin ligase UBR2 gene [46] in lymphocytes from ALS patients was found to correlate with disease duration and ALSFRS-R at the time of sampling. Although, overall UBR2 mRNA expression is upregulated in ALS patients compared to healthy controls, a decrease in expression correlated with more advanced stage or severity. This apparent paradox can be explained by the possibility that an initial disease process to which healthy controls are never exposed, causes an initial upregulation of UBR2 mRNA expression which then declines as the disease progresses with increasing impairment of the UPS machinery. One possible mechanism of action of E3 ubiquitin ligases UBR1 and UBR2 could be to facilitate targeting of foldable conformers to the proteasome [39] and to provide protection against toxicity of (unknown) misfolded proteins that accumulate during the disease course in lymphocytes from ALS patients. This mechanism is similar to the E3 ubiquitin ligase dorfin (encoded by RNF19A) that prevents mutant SOD1-mediated neurotoxicity and improves symptoms in the transgenic G93A SOD1 mouse model [47,48]. Indeed, the presence of some cellular toxicity in PBMCs was shown by De Marco et al. (2010) [49] who determined that the cytoplasmic fraction of TDP-43 in circulating PBMCs of sporadic and familial ALS patients was increased. In addition, by analogy with mutant SOD1-mediated toxicity, human wild-type TDP-43-mediated neurotoxicity might be partially alleviated by co-expression with ubiquilin 1 (encoded by UBQLN1) involved in autophagy and proteasome targeting [50,51]. Moreover, mutations in ubiquilin 2 (encoded by UBQLN2) have been associated with X-linked juvenile ALS and adult sporadic ALS [52]. Ubiquilins bind to both ubiquitin ligases and the proteasome, providing a connector function within the UPS [53].
Our proteasome inhibition assays also indicate that lymphocytes from ALS patients exposed to serum factors and metabolites in vivo have acquired new properties with regard to the UPS and other pathways that are normally perturbed in degenerating motor neurons. In this respect, the study by Watanabe et al. (2010) [54], showing that metabolic alterations of the UPS may take place in the skin of ALS patients, follows the same paradigm. In addition, using short-term PBMC cultures Zhang et al. (2011) [13] showed that monocytes in ALS patients have acquired unique properties that relate to neuroinflammation and innate immunity.
Conclusions
Our approach demonstrates that subtle changes in gene expression measured by Agilent Human Whole Genome 4 × 44K Array may be interpreted objectively. Without underestimating the complexity of ALS pathogenesis, our analyses with these arrays identify multiple new directions worth further investigation, including systemic UPS pathway alterations, in the search of biomarkers associated with the cause(s) or the progression of ALS. Overall, it remains to be determined which properties the circulating lymphocytes acquire by long distance signaling in the peripheral blood system, and which properties they acquire by local signaling or local cell-cell contact due to trafficking of the lymphocytes at the sites of neurodegeneration in brain or spinal cord.
Competing interests
The authors declare that they have no competing interests.
Authors' contributions
J-LM conceived the study and designed the microarray experiments and proteasome inhibition experiments, conducted MIDAS-TM4 data normalization, SAM and LIMMA analyses, and Western blot analyses with ImageJ program, and wrote the manuscript. J-LM isolated lymphocytes from ALS patients and controls which were lysed in TriZol prior to shipping to Cogenics, Inc. for microarray experiments with Agilent Human Whole Genome 4 × 44k Arrays. FAW and ZL performed the SAFE analyses and compared MIDAS-TM4 normalization to several alternative methods of normalization (MIDAS-TM4 producing best normalization), verified SAM and LIMMA analyses. AEP isolated PBMCs from ALS patients and healthy controls, carried out the proteasome inhibition assays and Western blotting. BRB coordinated ALS patients and healthy controls sample collection, verified diagnosis and disease characteristics at the time of lymphocyte sampling and contributed to revisions of the manuscript and to the emphasis on clinical significance of the results. All authors have read and approved the final manuscript.
Pre-publication history
The pre-publication history for this paper can be accessed here:
http://www.biomedcentral.com/1755-8794/4/74/prepub
Supplementary Material
Additional file 1
**SAM analysis (q < 1%) and LIMMA analysis conducted independently using DS7000**. Probe set IDs, gene symbol, GenBank NCBI accession number, fold change (FC) ALS _vs_. healthy controls, local FDR (q value in %), LIMMA significance p value and q value, and log2 ratios of normalized expression data and gene descriptions are shown. FC >1 signifies higher expression in the ALS group.
Additional file 2
SAFE results of the KEGG disease pathways. Raw SAFE data are presented for the 25 disease pathways (gene set size 5-100) and 34 disease pathways (including gene sets with >100 genes) analyzed using the DS7000 microarray dataset. These pathways represent cancer, circulatory, genetic, immune, neurological and urological diseases.
Contributor Information
Jean-Luc C Mougeot, Email: jean-luc.mougeot@carolinashealthcare.org.
Zhen Li, Email: zli@metabolon.com.
Andrea E Price, Email: andrea.price@carolinashealthcare.org.
Fred A Wright, Email: fwright@bios.unc.edu.
Benjamin R Brooks, Email: benjamin.brooks@carolinashealthcare.org.
Acknowledgements and Funding
We would like to thank Drs. Herbert L Bonkovsky and Farah K Mougeot for critical review of the manuscript. We also thank the Carolinas Neuromuscular/ALS-MDA Center staff for their help with consenting patients and acquisition of patients' samples and data. This work was supported by grants from the Carolinas ALS Research Fund of the Carolinas Healthcare Foundation, the Charlotte-Mecklenburg Health Services Foundation (HSF), and a grant from the North Carolina Translational and Clinical Sciences Institute (Award 10KR40936).
References
- Bodansky A, Kim JM, Tempest L, Velagapudi A, Libby R, Ravits J. TDP-43 and ubiquitinated cytoplasmic aggregates in sporadic ALS are low frequency and widely distributed in the lower motor neuron columns independent of disease spread. Amyotroph Lateral Scler. 2010;11(3):321–327. doi: 10.3109/17482961003602363. [DOI] [PMC free article] [PubMed] [Google Scholar]
- van Es MA, Veldink JH, Saris CG, Blauw HM, van Vught PW, Birve A, Lemmens R, Schelhaas HJ, Groen EJ, Huisman MH, van der Kooi AJ, de Visser M, Dahlberg C, Estrada K, Rivadeneira F, Hofman A, Zwarts MJ, van Doormaal PT, Rujescu D, Strengman E, Giegling I, Muglia P, Tomik B, Slowik A, Uitterlinden AG, Hendrich C, Waibel S, Meyer T, Ludolph AC, Glass JD. et al. Genome-wide association study identifies 19p13.3 (UNC13A) and 9p21.2 as susceptibility loci for sporadic amyotrophic lateral sclerosis. Nat Genet. 2009;41(10):1083–1087. doi: 10.1038/ng.442. [DOI] [PubMed] [Google Scholar]
- van Es MA, van Vught PW, Blauw HM, Franke L, Saris CG, Andersen PM, van den Bosch L, de Jong SW, van't Slot R, Birve A, Lemmens R, de Jong V, Baas F, Schelhaas HJ, Sleegers K, van Broeckhoven C, Wokke JH, Wijmenga C, Robberecht W, Veldink JH, Ophoff RA, van den Berg LH. ITPR2 as a susceptibility gene in sporadic amyotrophic lateral sclerosis: a genome-wide association study. Lancet Neurol. 2007;6(10):869–77. doi: 10.1016/S1474-4422(07)70222-3. [DOI] [PubMed] [Google Scholar]
- van Es MA, van Vught PW, Veldink JH, Andersen PM, Birve A, Lemmens R, Cronin S, van der Kooi AJ, de Visser M, Schelhaas HJ, Hardiman O, Ragoussis I, Lambrechts D, Robberecht W, Wokke JH, Ophoff RA, van den Berg LH. Analysis of FGGY as a risk factor for sporadic amyotrophic lateral sclerosis. Amyotroph Lateral Scler. 2009;10(5-6):441–7. doi: 10.3109/17482960802673042. [DOI] [PubMed] [Google Scholar]
- van Es MA, van Vught PW, Blauw HM, Franke L, Saris CG, van den Bosch L, de Jong SW, de Jong V, Baas F, van't Slot R, Lemmens R, Schelhaas HJ, Birve A, Sleegers K, van Broeckhoven C, Schymick JC, Traynor BJ, Wokke JH, Wijmenga C, Robberecht W, Andersen PM, Veldink JH, Ophoff RA, van den Berg LH. Genetic variation in DPP6 is associated with susceptibility to amyotrophic lateral sclerosis. Nat Genet. 2008;40(1):29–31. doi: 10.1038/ng.2007.52. [DOI] [PubMed] [Google Scholar]
- Daoud H, Belzil V, Desjarlais A, Camu W, Dion PA, Rouleau GA. Analysis of the UNC13A gene as a risk factor for sporadic amyotrophic lateral sclerosis. Arch Neurol. 2010;67(4):516–7. doi: 10.1001/archneurol.2010.46. [DOI] [PubMed] [Google Scholar]
- Shatunov A, Mok K, Newhouse S, Weale ME, Smith B, Vance C, Johnson L, Veldink JH, van Es MA, van den Berg LH, Robberecht W, van Damme P, Hardiman O, Farmer AE, Lewis CM, Butler AW, Abel O, Andersen PM, Fogh I, Silani V, Chiò A, Traynor BJ, Melki J, Meininger V, Landers JE, McGuffin P, Glass JD, Pall H, Leigh PN, Hardy J. et al. Chromosome 9p21 in sporadic amyotrophic lateral sclerosis in the UK and seven other countries: a genome-wide association study. Lancet Neurol. 2010;9(10):986–94. doi: 10.1016/S1474-4422(10)70197-6. [DOI] [PMC free article] [PubMed] [Google Scholar]
- The Euro-MOTOR project. http://www.euromotorproject.eu
- Kudo LC, Parfenova L, Vi N, Lau K, Pomakian J, Valdmanis P, Rouleau GA, Vinters HV, Wiedau-Pazos M, Karsten SL. Integrative gene-tissue microarray-based approach for identification of human disease biomarkers: application to amyotrophic lateral sclerosis. Hum Mol Genet. 2010;19(16):3233–3253. doi: 10.1093/hmg/ddq232. [DOI] [PubMed] [Google Scholar]
- Lin J, Diamanduros A, Chowdhury SA, Scelsa S, Latov N, Sadiq SA. Specific electron transport chain abnormalities in amyotrophic lateral sclerosis. J Neurol. 2009;256(5):774–782. doi: 10.1007/s00415-009-5015-8. [DOI] [PubMed] [Google Scholar]
- Saris CG, Horvath S, van Vught PW, van Es MA, Blauw HM, Fuller TF, Langfelder P, DeYoung J, Wokke JH, Veldink JH, van den Berg LH, Ophoff RA. Weighted gene co-expression network analysis of the peripheral blood from Amyotrophic Lateral Sclerosis patients. BMC Genomics. 2009;10:405. doi: 10.1186/1471-2164-10-405. [DOI] [PMC free article] [PubMed] [Google Scholar]
- Gagliardi S, Cova E, Davin A, Guareschi S, Abel K, Alvisi E, Laforenza U, Ghidoni R, Cashman JR, Ceroni M, Cereda C. SOD1 mRNA expression in sporadic amyotrophic lateral sclerosis. Neurobiol Dis. 2010;39(2):198–203. doi: 10.1016/j.nbd.2010.04.008. [DOI] [PubMed] [Google Scholar]
- Zhang R, Hadlock KG, Do H, Yu S, Honrada R, Champion S, Forshew D, Madison C, Katz J, Miller RG, McGrath MS. Gene expression profiling in peripheral blood mononuclear cells from patients with sporadic amyotrophic lateral sclerosis (sALS) J Neuroimmunol. 2010;230(1-2):114–123. doi: 10.1016/j.jneuroim.2010.08.012. [DOI] [PMC free article] [PubMed] [Google Scholar]
- Lincecum JM, Vieira FG, Wang MZ, Thompson K, De Zutter GS, Kidd J, Moreno A, Sanchez R, Carrion IJ, Levine BA, Al-Nakhala BM, Sullivan SM, Gill A, Perrin S. From transcriptome analysis to therapeutic anti-CD40L treatment in the SOD1 model of amyotrophic lateral sclerosis. Nat Genet. 2010;42(5):392–9. doi: 10.1038/ng.557. [DOI] [PubMed] [Google Scholar]
- Garbuzova-Davis S, Saporta S, Sanberg PR. Implications of blood-brain barrier disruption in ALS. Amyotroph Lateral Scler. 2008;9(6):375–376. doi: 10.1080/17482960802160990. [DOI] [PubMed] [Google Scholar]
- Palmer C, Diehn M, Alizadeh AA, Brown PO. Cell-type specific gene expression profiles of leukocytes in human peripheral blood. BMC Genomics. 2006;7:115. doi: 10.1186/1471-2164-7-115. [DOI] [PMC free article] [PubMed] [Google Scholar]
- Min JL, Barrett A, Watts T, Pettersson FH, Lockstone HE, Lindgren CM, Taylor JM, Allen M, Zondervan KT, McCarthy MI. Variability of gene expression profiles in human blood and lymphoblastoid cell lines. BMC Genomics. 2010;11:96. doi: 10.1186/1471-2164-11-96. [DOI] [PMC free article] [PubMed] [Google Scholar]
- Kerr MK. Linear models for microarray data analysis: hidden similarities and differences. J Comput Biol. 2003;10(6):891–901. doi: 10.1089/106652703322756131. [DOI] [PubMed] [Google Scholar]
- Tusher VG, Tibshirani R, Chu G. Significance analysis of microarrays applied to the ionizing radiation response. Proc Natl Acad Sci USA. 2001;98(9):5116–5121. doi: 10.1073/pnas.091062498. [DOI] [PMC free article] [PubMed] [Google Scholar]
- Barry WT, Nobel AB, Wright FA. Significance analysis of functional categories in gene expression studies: a structured permutation approach. Bioinformatics. 2005;21(9):1943–1949. doi: 10.1093/bioinformatics/bti260. [DOI] [PubMed] [Google Scholar]
- Brooks BR, Miller RG, Swash M, Munsat TL. El Escorial revisited: revised criteria for the diagnosis of amyotrophic lateral sclerosis. Amyotroph Lateral Scler Other Motor Neuron Disord. 2000;1(5):293–299. doi: 10.1080/146608200300079536. [DOI] [PubMed] [Google Scholar]
- Repnik U, Knezevic M, Jeras M. Simple and cost-effective isolation of monocytes from buffy coats. J Immunol Methods. 2003;278(1-2):283–292. doi: 10.1016/S0022-1759(03)00231-X. [DOI] [PubMed] [Google Scholar]
- Rosa GJ, Steibel JP, Tempelman RJ. Reassessing design and analysis of two-colour microarray experiments using mixed effects models. Comp Funct Genomics. 2005;6(3):123–131. doi: 10.1002/cfg.464. [DOI] [PMC free article] [PubMed] [Google Scholar]
- The NCBI Gene Expression Omnibus database. http://www.ncbi.nlm.nih.gov/geo
- Sioson AA, Mane SP, Li P, Sha W, Heath LS, Bohnert HJ, Grene R. The statistics of identifying differentially expressed genes in Expresso and TM4: a comparison. BMC Bioinformatics. 2006;7:215. doi: 10.1186/1471-2105-7-215. [DOI] [PMC free article] [PubMed] [Google Scholar]
- Münch C, Rosenbohm A, Sperfeld AD, Uttner I, Reske S, Krause BJ, Sedlmeier R, Meyer T, Hanemann CO, Stumm G, Ludolph AC. Heterozygous R1101K mutation of the DCTN1 gene in a family with ALS and FTD. Ann Neurol. 2005;58(5):777–80. doi: 10.1002/ana.20631. [DOI] [PubMed] [Google Scholar]
- Kabashi E, Valdmanis PN, Dion P, Spiegelman D, McConkey BJ, Vande Velde C, Bouchard JP, Lacomblez L, Pochigaeva K, Salachas F, Pradat PF, Camu W, Meininger V, Dupre N, Rouleau GA. TARDBP mutations in individuals with sporadic and familial amyotrophic lateral sclerosis. Nat Genet. 2008;40(5):572–4. doi: 10.1038/ng.132. [DOI] [PubMed] [Google Scholar]
- Liu-Yesucevitz L, Bilgutay A, Zhang YJ, Vanderwyde T, Citro A, Mehta T, Zaarur N, McKee A, Bowser R, Sherman M, Petrucelli L, Wolozin B. Tar DNA binding protein-43 (TDP-43) associates with stress granules: analysis of cultured cells and pathological brain tissue. PLoS One. 2010;5(10):e13250. doi: 10.1371/journal.pone.0013250. [DOI] [PMC free article] [PubMed] [Google Scholar]
- Schilders G, van Dijk E, Pruijn GJ. C1D and hMtr4p associate with the human exosome subunit PM/Scl-100 and are involved in pre-rRNA processing. Nucleic Acids Res. 2007;35(8):2564–2572. doi: 10.1093/nar/gkm082. [DOI] [PMC free article] [PubMed] [Google Scholar]
- Jurica MS, Licklider LJ, Gygi SR, Grigorieff N, Moore MJ. Purification and characterization of native spliceosomes suitable for three-dimensional structural analysis. RNA. 2002;8(4):426–439. doi: 10.1017/S1355838202021088. [DOI] [PMC free article] [PubMed] [Google Scholar]
- Kovar H. Dr. Jekyll and Mr. Hyde: The Two Faces of the FUS/EWS/TAF15 Protein Family. Sarcoma. 2011;2011:837474. doi: 10.1155/2011/837474. [DOI] [PMC free article] [PubMed] [Google Scholar]
- Kolb SJ, Sutton S, Schoenberg DR. RNA processing defects associated with diseases of the motor neuron. Muscle Nerve. 2010;41(1):5–17. doi: 10.1002/mus.21428. [DOI] [PMC free article] [PubMed] [Google Scholar]
- Gregory SG, Schmidt S, Seth P, Oksenberg JR, Hart J, Prokop A, Caillier SJ, Ban M, Goris A, Barcellos LF, Lincoln R, McCauley JL, Sawcer SJ, Compston DA, Dubois B, Hauser SL, Garcia-Blanco MA, Pericak-Vance MA, Haines JL. Multiple Sclerosis Genetics Group. Interleukin 7 receptor alpha chain (IL7R) shows allelic and functional association with multiple sclerosis. Nat Genet. 2007;39(9):1083–1091. doi: 10.1038/ng2103. [DOI] [PubMed] [Google Scholar]
- Hu WH, Hausmann ON, Yan MS, Walters WM, Wong PK, Bethea JR. Identification and characterization of a novel Nogo-interacting mitochondrial protein (NIMP) J Neurochem. 2002;81(1):36–45. doi: 10.1046/j.1471-4159.2002.00788.x. [DOI] [PubMed] [Google Scholar]
- Subramanian A, Tamayo P, Mootha VK, Mukherjee S, Ebert BL, Gillette MA, Paulovich A, Pomeroy SL, Golub TR, Lander ES, Mesirov JP. Gene set enrichment analysis: a knowledge-based approach for interpreting genome-wide expression profiles. Proc Natl Acad Sci USA. 2005;102(43):15545–15550. doi: 10.1073/pnas.0506580102. [DOI] [PMC free article] [PubMed] [Google Scholar]
- Gatti DM, Barry WT, Nobel AB, Rusyn I, Wright FA. Heading down the wrong pathway: on the influence of correlation within gene sets. BMC Genomics. 2010;11:574. doi: 10.1186/1471-2164-11-574. [DOI] [PMC free article] [PubMed] [Google Scholar]
- The KEGG ALS Pathway. http://www.genome.jp/kegg/pathway/hsa/hsa05014.html
- The AmiGO gene ontology database. http://amigo.geneontology.org
- Nillegoda NB, Theodoraki MA, Mandal AK, Mayo KJ, Ren HY, Sultana R, Wu K, Johnson J, Cyr DM, Caplan AJ. Ubr1 and Ubr2 function in a quality control pathway for degradation of unfolded cytosolic proteins. Mol Biol Cell. 2010;21(13):2102–2116. doi: 10.1091/mbc.E10-02-0098. [DOI] [PMC free article] [PubMed] [Google Scholar]
- Jamart C, Raymackers JM, Li An G, Deldicque L, Francaux M. Prevention of muscle disuse atrophy by MG132 proteasome inhibitor. Muscle Nerve. 2010;43(5):708–715. doi: 10.1002/mus.21949. [DOI] [PubMed] [Google Scholar]
- Kleinberger G, Wils H, Ponsaerts P, Joris G, Timmermans JP, Van Broeckhoven C, Kumar-Singh S. Increased caspase activation and decreased TDP-43 solubility in progranulin knockout cortical cultures. J Neurochem. 2010;115(3):735–747. doi: 10.1111/j.1471-4159.2010.06961.x. [DOI] [PubMed] [Google Scholar]
- Jury EC, Kabouridis PS, Abba A, Mageed RA, Isenberg DA. Increased ubiquitination and reduced expression of LCK in T lymphocytes from patients with systemic lupus erythematosus. Arthritis Rheum. 2003;48(5):1343–1354. doi: 10.1002/art.10978. [DOI] [PubMed] [Google Scholar]
- Ni TT, Lemon WJ, Shyr Y, Zhong TP. Use of normalization methods for analysis of microarrays containing a high degree of gene effects. BMC Bioinformatics. 2008;9:505. doi: 10.1186/1471-2105-9-505. [DOI] [PMC free article] [PubMed] [Google Scholar]
- Fujita A, Sato JR, Rodrigues Lde O, Ferreira CE, Sogayar MC. Evaluating different methods of microarray data normalization. BMC Bioinformatics. 2006;7:469. doi: 10.1186/1471-2105-7-469. [DOI] [PMC free article] [PubMed] [Google Scholar]
- Johnson JO, Mandrioli J, Benatar M, Abramzon Y, van Deerlin VM, Trojanowski JQ, Gibbs JR, Brunetti M, Gronka S, Wuu J, Ding J, McCluskey L, Martinez-Lage M, Falcone D, Hernandez DG, Arepalli S, Chong S, Schymick JC, Rothstein J, Landi F, Wang YD, Calvo A, Mora G, Sabatelli M, Monsurrò MR, Battistini S, Salvi F, Spataro R, Sola P, Borghero G. et al. Exome sequencing reveals VCP mutations as a cause of familial ALS. Neuron. 2010;68(5):857–64. doi: 10.1016/j.neuron.2010.11.036. [DOI] [PMC free article] [PubMed] [Google Scholar]
- Kume K, Iizumi Y, Shimada M, Ito Y, Kishi T, Yamaguchi Y, Handa H. Role of N-end rule ubiquitin ligases UBR1 and UBR2 in regulating the leucine-mTOR signaling pathway. Genes Cells. 2010;15(4):339–49. doi: 10.1111/j.1365-2443.2010.01385.x. [DOI] [PubMed] [Google Scholar]
- Niwa J, Ishigaki S, Hishikawa N, Yamamoto M, Doyu M, Murata S, Tanaka K, Taniguchi N, Sobue G. Dorfin ubiquitylates mutant SOD1 and prevents mutant SOD1-mediated neurotoxicity. J Biol Chem. 2002;277(39):36793–36798. doi: 10.1074/jbc.M206559200. [DOI] [PubMed] [Google Scholar]
- Sone J, Niwa J, Kawai K, Ishigaki S, Yamada S, Adachi H, Katsuno M, Tanaka F, Doyu M, Sobue G. Dorfin ameliorates phenotypes in a transgenic mouse model of amyotrophic lateral sclerosis. J Neurosci Res. 2010;88(1):123–135. doi: 10.1002/jnr.22175. [DOI] [PubMed] [Google Scholar]
- De Marco G, Lupino E, Calvo A, Moglia C, Buccinnà B, Grifoni S, Ramondetti C, Lomartire A, Rinaudo MT, Piccinini M, Giordana MT, Chiò A. Cytoplasmic accumulation of TDP-43 in circulating lymphomonocytes of ALS patients with and without TARDBP mutations. Acta Neuropathol. 2011;121(5):611–22. doi: 10.1007/s00401-010-0786-7. [DOI] [PubMed] [Google Scholar]
- Hanson KA, Kim SH, Wassarman DA, Tibbetts RS. Ubiquilin modifies TDP-43 toxicity in a Drosophila model of amyotrophic lateral sclerosis (ALS) J Biol Chem. pp. 11068–11072. [DOI] [PMC free article] [PubMed]
- Kim SH, Shi Y, Hanson KA, Williams LM, Sakasai R, Bowler MJ, Tibbetts RS. Potentiation of amyotrophic lateral sclerosis (ALS)-associated TDP-43 aggregation by the proteasome-targeting factor, ubiquilin 1. J Biol Chem. 2009;284(12):8083–8092. doi: 10.1074/jbc.M808064200. [DOI] [PMC free article] [PubMed] [Google Scholar]
- Deng HX, Chen W, Hong ST, Boycott KM, Gorrie GH, Siddique N, Yang Y, Fecto F, Shi Y, Zhai H, Jiang H, Hirano M, Rampersaud E, Jansen GH, Donkervoort S, Bigio EH, Brooks BR, Ajroud K, Sufit RL, Haines JL, Mugnaini E, Pericak-Vance MA, Siddique T. Mutations in UBQLN2 cause dominant X-linked juvenile and adult-onset ALS and ALS/dementia. Nature. 2011;477(7363):211–5. doi: 10.1038/nature10353. [DOI] [PMC free article] [PubMed] [Google Scholar]
- Kleijnen MF, Shih AH, Zhou P, Kumar S, Soccio RE, Kedersha NL, Gill G, Howley PM. The hPLIC proteins may provide a link between the ubiquitination machinery and the proteasome. Mol Cell. pp. 409–19. [DOI] [PubMed]
- Watanabe T, Okeda Y, Yamano T, Ono S. An immunohistochemical study of ubiquitin in the skin of sporadic amyotrophic lateral sclerosis. J Neurol Sci. 2010;298(1-2):52–56. doi: 10.1016/j.jns.2010.08.026. [DOI] [PubMed] [Google Scholar]
Associated Data
This section collects any data citations, data availability statements, or supplementary materials included in this article.
Supplementary Materials
Additional file 1
**SAM analysis (q < 1%) and LIMMA analysis conducted independently using DS7000**. Probe set IDs, gene symbol, GenBank NCBI accession number, fold change (FC) ALS _vs_. healthy controls, local FDR (q value in %), LIMMA significance p value and q value, and log2 ratios of normalized expression data and gene descriptions are shown. FC >1 signifies higher expression in the ALS group.
Additional file 2
SAFE results of the KEGG disease pathways. Raw SAFE data are presented for the 25 disease pathways (gene set size 5-100) and 34 disease pathways (including gene sets with >100 genes) analyzed using the DS7000 microarray dataset. These pathways represent cancer, circulatory, genetic, immune, neurological and urological diseases.