Differential oestrogen receptor binding is associated with clinical outcome in breast cancer (original) (raw)
. Author manuscript; available in PMC: 2012 Jul 19.
Published in final edited form as: Nature. 2012 Jan 4;481(7381):389–393. doi: 10.1038/nature10730
Summary
Oestrogen receptor-α (ER) is the defining and driving transcription factor in the majority of breast cancers and its target genes dictate cell growth and endocrine response, yet genomic understanding of ER function has been restricted to model systems1-3. We now map genome-wide ER binding events, by chromatin immunoprecipitation followed by high-throughput sequencing (ChIP-seq), in primary breast cancers from patients with different clinical outcome and in distant ER positive (ER+) metastases. We find that drug resistant cancers still have ER-chromatin occupancy, but that ER binding is a dynamic process, with the acquisition of unique ER binding regions in tumours from patients that are likely to relapse. The acquired, poor outcome ER regulatory regions observed in primary tumours reveal gene signatures that predict clinical outcome in ER+ disease exclusively. We find that the differential ER binding programme observed in tumours from patients with poor outcome is not due to the selection of a rare subpopulation of cells, but is due to the FoxA1-mediated reprogramming of ER binding on a rapid time scale. The parallel redistribution of ER and FoxA1 cis-regulatory elements in drug resistant cellular contexts is supported by histological co-expression of ER and FoxA1 in metastatic samples. By establishing transcription factor mapping in primary tumour material, we show that there is plasticity in ER binding capacity, with distinct combinations of _cis_-regulatory elements linked with the different clinical outcomes.
Recent technological advances have allowed mapping of oestrogen receptor-α (ER) binding events, with the goal of discovering the _cis_-regulatory elements and factors involved in mediating ER binding and transcription. Several genome-wide maps of ER in breast cancer cell line models exist1-3, all showing that most ER binding events occur at distal _cis_-regulatory elements. Forkhead motifs are enriched within the regions bound by ER binding and numerous studies have identified the forkhead protein FoxA1 as an important pioneer factor for ER− chromatin interactions4-6. However, the ER mapping studies have been restricted to breast cancer cell lines, mostly the MCF-7 cell line. We sought to interrogate ER binding events, for the first time, in primary frozen breast cancer samples, to determine if ER binding is dynamic and if specific _cis_-regulatory elements can distinguish tumours from patients with distinct clinical outcomes.
ER ChIP-sequencing (ChIP-seq) was performed in eight ER+, PR+, HER2− primary breast tumours, representative of tumours from patients with better prognosis7, a conclusion supported by the available long-term clinical follow-up (Supplementary figure 1). Also included were seven primary breast tumours from patients with a poor outcome (ER+ PR− HER2− or ER+ PR+ HER+), since PR− or HER2+ tumours are more likely to be aggressive8,9. As expected, the poor outcome patients who had long-term clinical follow-up died of breast cancer (Supplementary figure 1). Furthermore, three ER+ distant metastatic samples from women with breast cancer were included. The metastatic locations and sample preparation can be found in Supplementary figure 1. As a control, we included two breast cancer samples that were ER− (ER-α negative), but expressed high transcript levels of ER-β.
ER ChIP-seq was conducted and ER binding peaks were called using two different algorithms, MACS10 and SWEMBL (http://www.ebi.ac.uk/~swilder/SWEMBL/), to minimise peak caller bias. The number of sequencing reads and ER binding events for each tumour is shown in Supplementary figure 2. ER binding could be mapped in all tumours, but total peak intensity and the number of identified binding events differed. Three tumours were split into two sections and ER ChIP-seq was conducted on the separate sections. We found very good concordance when comparing different sections of the same tumour (R2 = 0.954) suggesting that tumour heterogeneity did not substantially influence the ER binding signal obtained from a sample (Supplementary figure 3).
We initially assessed whether a conserved set of breast cancer ER binding events could be identified. We found a core set of 484 ER binding events that were identified in at least 75% of all the tumours, but not in either of the ER− tumours (Figure 1A). Peak calling details can be found in Supplementary figure 4. An example of a core ER binding event is shown in Figure 1B. This demonstrates that ER binding to chromatin still occurs even in tumours that are unlikely to respond to antioestrogen therapies, implying that drug resistance is not due to loss of ER binding to DNA. The average ER binding signal intensity was highest in the metastatic samples and lowest in patients with good outcome tumours, a phenomenon observed both within the 484 core ER binding regions (Figure 1C) and globally (Supplementary figure 4). These data suggest that there is an acquisition of binding signal intensity in tumours that progress towards a poorer prognosis and ultimately metastasise. The only DNA motif found enriched in the core ER binding events was an oestrogen responsive element (ERE) (Figure 1D). The genes near (within 20kb: an optimal window between ER binding events and target genes11) the 484 core ER binding events exhibited elevated expression in the ER+ tumours used for ChIP-seq, as compared to all other genes (data not shown) and were higher in ER+ tumours relative to ER− tumours in nine independent datasets (Supplementary figure 5). The genes are provided in Supplementary figure 6 and include classic ER target genes such as TFF1, GREB1 and RARα. A gene predictor was generated based on genes near the core ER binding events. Patients were stratified and the tumours with the highest ‘risk index’ had a poor clinical outcome when compared to the tumours with the lowest ‘risk index’ (Figure 1E shows the results based on one study12 and additional datasets are shown in Supplementary figure 6. Only ER+ patients were considered). These conserved _cis_-regulatory elements and their putative target genes may be the elements that contribute to tumourigenesis and are maintained regardless of the clinical outcome of the breast cancer patient. In contrast to the primary breast cancers and metastases, we mapped ER binding in three normal human mammary glands and two normal human liver samples and found limited numbers of ER binding events, with almost no concordance in ER binding between individuals (data not shown).
Figure 1.
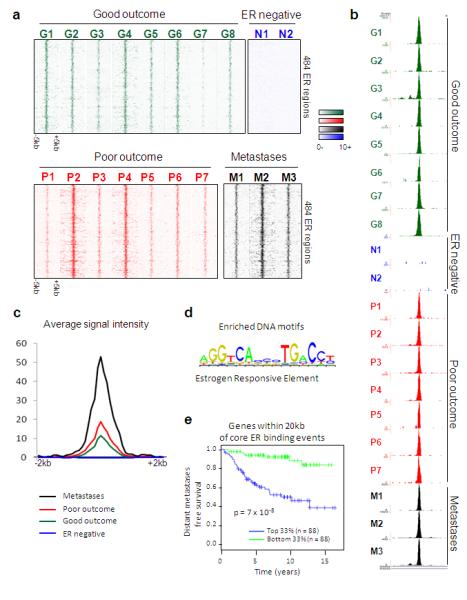
A subset of ER binding events is conserved in primary breast tumours and distant metastases. A. Heatmap showing binding peak intensity of 484 core ER binding events that are common to primary breast tumours and distant metastases. The window represents −/+ 5kb regions from the centre of the binding events. B. Example of an ER binding event at the RAR α locus, that is present in at least 75% of primary ER+ breast tumours and metastases, but not the ER− tumours. C. Normalised average signal intensity of all core ER binding events. Also included are the ER− tumours. D. Motif analysis revealed the enrichment of oestrogen responsive elements (ERE). E. Genes within 20kb of the core ER binding events were used to generate a gene predictor that was tested in independent datasets for predictive value. Tumours were stratified according to expression of this gene signature and the top one third and bottom one third of tumours were compared. Results from one dataset is shown12 and additional datasets are provided in Supplementary figure 6.
We sought to determine if differential ER binding events could discriminate the patients with good outcome (ER+ PR+ HER2− tumours), from patients with poor outcome or metastases (we described the combined set as poor/met tumours). After normalisation of the data to account for global differences in ER binding, Differential Binding Analysis (DBA) was used to identify ER binding events that were statistically enriched in one category or the other. This resulted in a set of ER binding events that could discriminate between the two groups when using principal component analysis (Figure 2A). In total, DBA revealed 1,192 genomic regions that had significantly more ER binding in the poor/met group, compared to the good outcome patients (Figure 2B) and 599 ER binding regions with more ER binding in the good outcome patients, when compared to the poor/met patients (Figure 2B). The clustering of the tumours based on the 1,791 differential ER binding events can be visualised in Supplementary figure 7. These findings suggest that there are specific and re-occurring _cis_-regulatory elements that are occupied by ER in breast cancers, but that these are different in tumours that respond, versus those that relapse and metastasise. Analysis of enriched DNA motifs identified the presence of ERE and FoxA1 motifs in the differential poor outcome ER binding events and ERE motifs in the good outcome ER binding events (Figure 2C). Correlation of the poor outcome ER binding events with known processes revealed an association with endocrine resistance and luminal B status (Supplementary figure 8).
Figure 2.
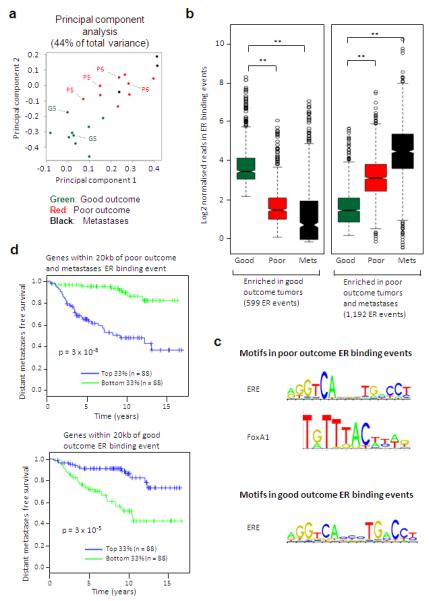
ER binding profiles can discriminate between tumours from patients with different clinical outcomes. A. Principal component analysis of the 1,791 ER binding events that can discriminate between the patients with good outcome tumours and those with poor/met tumours. Included are the replicates from three tumours, which are highlighted. B. Box plot representing distribution of normalised read counts in differential ER binding events that are statistically enriched in either the patients with good outcome tumours (599 ER binding events) or the patients with poor outcome tumours and the metastases (1,192 ER binding events). The samples were pre-normalised. ** denotes p < 1 ×10⁻¹⁰. P-values were calculated using the Wilcoxon rank sum test. C. Enriched motifs in the poor/met tumours and the good outcome ER binding events. D. Genes within 20kb of the differentially bound ER binding event were used to generate a gene predictor. Tumours were stratified according to expression of this gene signature and the top one third and bottom one third of tumours were compared. Results from one dataset is shown12 and additional datasets are provided in Supplementary figure 12.
To investigate if the genes near the differential ER binding events were potentially functional in breast cancer, we analysed genes within a 20 kb window around the 1,192 poor/met and 599 good outcome ER binding events. Using a training set, we generated a gene expression predictor for each of the good and poor outcome gene lists. The probability calculation and comparisons between the good and poor outcome genes is shown in Supplementary figures 9 and 10. Within the poor outcome gene list was the oncogene ErbB2 (all genes are shown in Supplementary figure 11). As expected, genes in the poor outcome predictor were preferentially up-regulated in poor outcome patients, while those in the good outcome predictor were preferentially down-regulated (Supplementary figure 10). We next tested the predictors in an independent large cohort of breast cancer patients12, only considering ER+ tumours. Using distant metastases free survival as an endpoint, both gene sets predicted outcome (p = 3 − 10−5 for good and 3 × 10⁻⁸ for poor outcome genes) in this dataset12 and with the expected opposite directionality (Figure 2D). The gene predictors were associated with survival in additional datasets (Supplementary figure 12) and were largely independent of histopathological factors (Supplementary figure 13). We tested 1,000 randomisations from the entire list of genes and determined that the probability that a random set of genes would yield an equally robust predictor of clinical outcome was p = 0.004. Furthermore, the good and poor gene predictors had no predictive power in four cohorts of ER negative patients (Supplementary figure 14). This suggests that the increased ER binding at distinct _cis_-regulatory elements is functionally and biologically relevant, resulting in altered gene expression profiles that contribute to differences in drug response and overall survival.
To validate the findings made in the tumours, we explored the possibility that ER binding events were acquired in cell line models of endocrine resistance. ER binding was mapped by ChIP-seq in three commonly used tamoxifen-responsive, ER+ breast cancer cell lines (MCF-7, T-47D and ZR75-1), and two tamoxifen-resistant, ER+, breast cancer cell lines, namely a tamoxifen-resistant MCF-7 derivative (TAM-R)13 and BT-474 cells that are ER+ and contain the ERBB2 amplification (ER+ HER2+). Similar to BT474 cells, TAM-R cells have elevated ERBB2 pathways13 and both represent cellular systems where increased growth factor signalling results in endocrine resistance. For all five cell lines, ER ChIP-seq was performed in at least duplicate, in asynchronous cells to recapitulate the situation observed in primary tumours (Supplementary figure 2).
Almost seven thousand (6,920) ER binding events were identified in all replicates of all cell lines (Figure 3A and Supplementary figure 15). The majority (98.9%) of the core ER binding events that occurred in most primary tumours (Figure 1A) overlapped with the cell line core ER binding events. DBA identified 8,188 ER binding events with significantly stronger binding affinity in the tamoxifen-resistant cell lines and 5,713 ER binding events that were stronger in the tamoxifen-responsive cell lines (Figure 3A). Examples of differentially bound regions are shown in Figure 3B. Using the differential ER binding events, the cell line classification can be visualised in principal component analysis (Figure 3C) and in hierarchical clustering (Figure 3D). Enriched motif analysis revealed ERE and FoxA1 motifs in regions showing increased ER binding in tamoxifen resistant cell lines (Figure 3E), which are the same motifs observed in the poor outcome ER binding events in primary tumours (Figure 2C). GATA motifs were enriched in ER binding events depleted during acquisition of drug resistance (Figure 3E), possibly due to competition between FoxA1 and GATA3, another prominent breast cancer transcription factor.
Figure 3.

Identification of tamoxifen-resistant ER binding profile. A. Heatmap representing ER binding events found in all tamoxifen-responsive and tamoxifen-resistant cell lines, or those enriched in either sensitive or resistant cell lines. The window represents −/+ 5kb regions from the centre of the binding events. B. Examples of ER binding events that are unique to either tamoxifen-responsive or tamoxifen-resistant cell lines. C. Principal component analysis of differential ER binding events observed in sensitive (blue) or resistant (red) breast cancer cells. D. Hierarchical clustering of the top 1,500 differentially bound ER binding events (FDR < 0.006). E. Enriched motifs within the ER binding events that discriminate between tamoxifen-sensitive and resistant cell lines.
We hypothesised that the ER binding events induced in the tamoxifen-resistant breast cancer cell lines would be the same regions that were enriched in the poor/met clinical samples. However, 79.8% of the 1,192 ER binding events enriched in the poor/met samples (from Figure 2B) overlap with ER binding events in wild type MCF-7 cells, suggesting that the cell line models are closer to the tumours and metastases from poor outcome patients. In support of this, the 599 good outcome ER binding event observed in primary tumours (Figure 2B) overlap poorly with ER binding observed in MCF-7 cells (30.2% versus 79.8% for the poor outcome). Interestingly, MCF-7 cells (plus T-47D and ZR75-1 cells) are derived from the pleural effusion of metastatic breast cancer patients, but were established prior to tamoxifen use in the clinic. We hypothesise that MCF-7, ZR75-1 and T-47D cell lines possess an intermediate ER binding profile with the acquisition of additional ER binding regions required for resistance to antioestrogen treatment.
The differences in ER binding between sensitive and resistant contexts may be due to selection and expansion of a resistant subpopulation, or may be due to reprogramming of ER binding following specific stimuli. Growth factor pathways have long been implicated in modulating endocrine response14,15 and have been shown to influence ER binding potential and gene expression profiles14. We identified various stimuli (EGF, IL-6, TNF-α and IGF-I) shown to induce increased cellular invasion and drug resistance and treated asynchronous MCF-7 cells with control or the cocktail of mitogens for 90 minutes (Figure 4A). Duplicate ER ChIP-seq replicates were performed (Supplementary figure 2).
Figure 4.

ER and FoxA1 binding is dynamic and their expression correlates in metastases. A. Morphological changes in MCF-7 cells treated with a cocktail of mitogens (EGF, IGF-1, IL-6 and TNF-α) for 90 minutes. B. Principal component analysis of differentially bound ER binding events can discriminate between the control and mitogenic cocktail–treated samples in the first (and second) component. C. Heatmap showing induction and loss of ER and FoxA1 binding after 90 minutes of treatment with the mitogenic cocktail. Also shown is the normalised average signal intensity of all ER and FoxA1 binding events within the ‘gained’ ER binding events. D. Metastatic samples from different sites were stained by immunohistochemistry for ER and FoxA1. Example of ER and FoxA1 expression in a breast cancer bone metastasis. E. Graphical representation of ER and FoxA1 co-expression in metastases. Location of metastases is provided, as is the Allred score.
Differential binding analysis identified 6,089 ER binding regions that were differentially enriched (≥ 4 fold change difference, FDR < 0.1) following a 90 min treatment with the cocktail. These mitogen-induced ER binding differences could be visualised using principal component analysis (Figure 4B). Since FoxA1 is a pioneer factor required for ER-chromatin interactions4 and FoxA1 motifs were enriched in both the mitogen induced ER binding events (Supplementary figure 16) and the tumours from the poor outcome patients (Figure 2C), we assessed whether the rapid, reprogrammed ER binding occurred at regions pre-determined by FoxA1. We repeated the mitogen treatment, but mapped FoxA1 binding by ChIP-seq and found that ~25% of the reprogrammed ER binding events (1,515) occur at regions that are already bound by FoxA1, prior to mitogen treatment (Figure 4C). A substantial proportion (37.6%) of the other reprogrammed ER binding events occur at regions where FoxA1 binding is also induced by mitogens. As such, ~53% of mitogen-induced ER binding events occur at regions pre-bound by FoxA1 or at regions that also acquire FoxA1 binding (Figure 4C), a level of concordance that mirrors the ~50% overlap observed in wild type cells6.
To determine if FoxA1 expression was present in ER+ distant metastases, we obtained 24 metastatic samples (bone, brain and liver) from ER+ breast cancer patients and performed immunohistochemistry for ER and FoxA1 (Figure 4D). We found that ~87% of the metastases retained ER expression and that FoxA1 expression occurred in ~95% of the metastases (Figure 4E). Importantly, the concordance between ER and FoxA1 was high (R2 = 0.585), regardless of the site of metastasis. Therefore, the co-expression of ER and FoxA1 in distant metastases supports our conclusions that FoxA1 mediates ER reprogramming.
By mapping ER binding in clinical samples, we provide a first glimpse of the primary regulatory regions that contribute to differences within ER+ breast cancers, rather than secondary events such as gene expression profiles. Our findings suggest that there is plasticity in ER binding, with distinct ER binding profiles associated with clinical outcome. These differential ER binding profiles appear to be mediated by FoxA1. A remaining question is what dictates differential FoxA1 and subsequently ER binding. Possibilities include changes in the genomic landscape, alterations in co-factor levels or changes in FoxA1 structure and function, potentially by post-translational modifications. By establishing transcription factor mapping in primary samples, we find that differential ER binding patterns govern gene expression programs and are associated with clinical outcome in ER+ cancer.
Methods summary
MCF-7, ZR75-1, T-47D and BT-474 human cell lines were obtained from ATCC and grown in the relevant media. TAM-R cells13 were a kind gift from Dr Iain Hutcheson and Prof. Robert Nicholson (Cardiff). The ER+ breast cancer tumours were obtained from the Nottingham Tenovus primary breast cancer series, Addenbrooke’s Hospital and Imperial College Healthcare NHS Trust, London, UK with appropriate ethical approval from the repositories. The malignant pericardial effusion and the two distant metastases were obtained from Imperial College Healthcare NHS Trust, London, UK. For ChIP in the tumours and metastases, the frozen sample was cut into smaller pieces prior to ChIP, which was then performed as previously described16. For the malignant pericardial effusion, epithelial cells were first enriched using Dynabeads conjugated with Epcam17. For ChIPs from cell line material, proliferating cells were cross-linked and processed for ChIP as previously described16. The antibodies used were anti-ER (sc-543) from Santa Cruz Biotechnologies and anti-FoxA1 (ab5089) from Abcam. Sequences generated by the Illumina Genome Analyzer were processed by the Illumina analysis pipeline version 1.6.1, and aligned to the Human Reference Genome (assembly hg18, NCBI Build 36.1, March 2008) using BWA version 0.5.518. Differential binding analysis was performed using the DiffBind package19. For immunohistochemical analyses, ER staining was conducted using the 6F11/2 mouse monoclonal antibody (Novocastra, Leica Microsystems, Bucks, UK) and FoxA1 staining was conducted using a rabbit polyclonal antibody (ab23738) from Abcam. An Allred scoring system was used to assess staining accounting for both staining intensity and the proportion of cells stained.
Supplementary Material
1
2
3
Acknowledgements
The authors would like to thank Dominic Schmidt for assistance with figures, James Hadfield for Illumina sequencing, Stewart MacArthur, Oscar Rueda, Sarah Vowler, Ros Russell and Mike Wilson for technical and bioinformatics help. We thank John Stingl and his lab for help with the normal mammary gland work. We would like to acknowledge the support of The University of Cambridge, Cancer Research UK and Hutchison Whampoa Limited. The authors would like to thank Imperial College Healthcare NHS Trust, Human Biomaterials Resource Centre (Tissue Bank). Tumour samples from Cambridge were obtained with support from NIHR Biomedical Research Centre and the Experimental Cancer Medicine Centre. Caryn Ross-Innes is supported by a Commonwealth Scholarship. Ondrej Gojis is part funded by a grant awarded by the Ministry of Education of the Czech Republic (Project “Oncology” MSM 0021620808) and is also a recipient of Translational Research Fellowship from the European Society of Medical Oncology. Carlo Palmieri is funded by CRUK. Jason S. Carroll is supported by an ERC starting grant and an EMBO Young investigator award.
Footnotes
Author contributions C.S.R-I, R.S, C.C and J.S.C designed all experiments. Experimental work was conducted by C.S.R-I with help from K.A.H. Computational analysis was conducted by R.S and A.E.T, with help from M.J.D and G.D.B. All clinical samples, clinical information and help with sample processing was provided by C.C, C.P, S-F.C, S.A, A.R.G, I.O.E and O.G. Histological analysis was conducted by H.R.A. The manuscript was written by C.S.R-I, R.S, C.C and J.S.C with assistance from other authors.
Conflict of interest The authors declare that there is no conflict of interest.
References
- 1.Carroll JS, et al. Genome-wide analysis of estrogen receptor binding sites. Nature genetics. 2006;38:1289–1297. doi: 10.1038/ng1901. [DOI] [PubMed] [Google Scholar]
- 2.Lin CY, et al. Whole-Genome Cartography of Estrogen Receptor alpha Binding Sites. PLoS Genet. 2007;3:e87. doi: 10.1371/journal.pgen.0030087. [DOI] [PMC free article] [PubMed] [Google Scholar]
- 3.Welboren WJ, et al. ChIP-Seq of ERalpha and RNA polymerase II defines genes differentially responding to ligands. Embo J. 2009;28:1418–1428. doi: 10.1038/emboj.2009.88. doi:emboj200988 [pii] 10.1038/emboj.2009.88. [DOI] [PMC free article] [PubMed] [Google Scholar]
- 4.Carroll JS, et al. Chromosome-wide mapping of estrogen receptor binding reveals long-range regulation requiring the forkhead protein FoxA1. Cell. 2005;122:33–43. doi: 10.1016/j.cell.2005.05.008. [DOI] [PubMed] [Google Scholar]
- 5.Lupien M, et al. FoxA1 translates epigenetic signatures into enhancer-driven lineage-specific transcription. Cell. 2008;132:958–970. doi: 10.1016/j.cell.2008.01.018. [DOI] [PMC free article] [PubMed] [Google Scholar]
- 6.Hurtado A, Holmes KA, Ross-Innes CS, Schmidt D, Carroll JS. FOXA1 is a key determinant of estrogen receptor function and endocrine response. Nature genetics. 2011;43:27–33. doi: 10.1038/ng.730. doi:ng.730 [pii] 10.1038/ng.730. [DOI] [PMC free article] [PubMed] [Google Scholar]
- 7.EBCTCG Effects of chemotherapy and hormonal therapy for early breast cancer on recurrence and 15-year survival: an overview of the randomised trials. Lancet. 2005;365:1687–1717. doi: 10.1016/S0140-6736(05)66544-0. [DOI] [PubMed] [Google Scholar]
- 8.Kun Y, et al. Classifying the estrogen receptor status of breast cancers by expression profiles reveals a poor prognosis subpopulation exhibiting high expression of the ERBB2 receptor. Human molecular genetics. 2003;12:3245–3258. doi: 10.1093/hmg/ddg347. [DOI] [PubMed] [Google Scholar]
- 9.Arpino G, et al. Estrogen receptor-positive, progesterone receptor-negative breast cancer: association with growth factor receptor expression and tamoxifen resistance. Journal of the National Cancer Institute. 2005;97:1254–1261. doi: 10.1093/jnci/dji249. [DOI] [PubMed] [Google Scholar]
- 10.Zhang Y, et al. Model-based Analysis of ChIP-Seq (MACS) Genome biology. 2008;9:R137. doi: 10.1186/gb-2008-9-9-r137. [DOI] [PMC free article] [PubMed] [Google Scholar]
- 11.Fullwood MJ, et al. An oestrogen-receptor-alpha-bound human chromatin interactome. Nature. 2009;462:58–64. doi: 10.1038/nature08497. doi:nature08497 [pii] 10.1038/nature08497. [DOI] [PMC free article] [PubMed] [Google Scholar]
- 12.Loi S, et al. Definition of clinically distinct molecular subtypes in estrogen receptor-positive breast carcinomas through genomic grade. J Clin Oncol. 2007;25:1239–1246. doi: 10.1200/JCO.2006.07.1522. [DOI] [PubMed] [Google Scholar]
- 13.Knowlden JM, et al. Elevated levels of epidermal growth factor receptor/c-erbB2 heterodimers mediate an autocrine growth regulatory pathway in tamoxifen-resistant MCF-7 cells. Endocrinology. 2003;144:1032–1044. doi: 10.1210/en.2002-220620. [DOI] [PubMed] [Google Scholar]
- 14.Lupien M, et al. Growth factor stimulation induces a distinct ER(alpha) cistrome underlying breast cancer endocrine resistance. Genes & development. 2010;24:2219–2227. doi: 10.1101/gad.1944810. doi:24/19/2219 [pii] 10.1101/gad.1944810. [DOI] [PMC free article] [PubMed] [Google Scholar]
- 15.Nagashima T, et al. Quantitative transcriptional control of ErbB receptor signaling undergoes graded to biphasic response for cell differentiation. The Journal of biological chemistry. 2007;282:4045–4056. doi: 10.1074/jbc.M608653200. doi:M608653200 [pii] 10.1074/jbc.M608653200. [DOI] [PubMed] [Google Scholar]
- 16.Schmidt D, et al. ChIP-seq: Using high-throughput sequencing to discover protein-DNA interactions. Methods. 2009 doi: 10.1016/j.ymeth.2009.03.001. doi:S1046-2023(09)00047-4 [pii] 10.1016/j.ymeth.2009.03.001. [DOI] [PMC free article] [PubMed] [Google Scholar]
- 17.Gomm JJ, et al. Isolation of pure populations of epithelial and myoepithelial cells from the normal human mammary gland using immunomagnetic separation with Dynabeads. Anal Biochem. 1995;226:91–99. doi: 10.1006/abio.1995.1196. doi:S0003-2697(85)71196-7 [pii] 10.1006/abio.1995.1196. [DOI] [PubMed] [Google Scholar]
- 18.Li H, Durbin R. Fast and accurate short read alignment with Burrows-Wheeler transform. Bioinformatics (Oxford, England) 2009;25:1754–1760. doi: 10.1093/bioinformatics/btp324. doi:btp324 [pii] 10.1093/bioinformatics/btp324. [DOI] [PMC free article] [PubMed] [Google Scholar]
- 19.Stark R, Brown GD. DiffBind: differential binding analysis of ChIP-Seq peak data. Bioconductor. http://www.http://http://bioconductor.org/packages/release/bioc/html/DiffBind.html.
Associated Data
This section collects any data citations, data availability statements, or supplementary materials included in this article.
Supplementary Materials
1
2
3