Prolyl Hydroxylase-dependent Modulation of Eukaryotic Elongation Factor 2 Activity and Protein Translation under Acute Hypoxia (original) (raw)
Background: Translational arrest is a classical cellular response to hypoxia, the underlying mechanisms of which are unknown.
Results: Inhibitory phosphorylation of eukaryotic elongation factor 2 by acute hypoxia depends on oxygen-sensitive prolyl hydroxylases (PHDs).
Conclusion: The elongation phase of protein synthesis is regulated by PHDs.
Significance: This work unravels a novel cellular process controlled by PHDs, potential pharmacological targets in several human diseases.
Keywords: AMP Kinase, Hydroxylase, Hypoxia, Phosphatase, Phosphorylation, Translation Elongation Factors
Abstract
Early adaptive responses to hypoxia are essential for cell survival, but their nature and underlying mechanisms are poorly known. We have studied the post-transcriptional changes in the proteome of mammalian cells elicited by acute hypoxia and found that phosphorylation of eukaryotic elongation factor 2 (eEF2), a ribosomal translocase whose phosphorylation inhibits protein synthesis, is under the precise and reversible control of O2 tension. Upon exposure to hypoxia, phosphorylation of eEF2 at Thr56 occurred rapidly (<15 min) and resulted in modest translational arrest, a fundamental homeostatic response to hypoxia that spares ATP and thus facilitates cell survival. Acute inhibitory eEF2 phosphorylation occurred without ATP depletion or AMP kinase activation. Furthermore, eEF2 phosphorylation was mimicked by prolyl hydroxylase (PHD) inhibition with dimethyloxalylglycine or by selective PHD2 siRNA silencing but was independent of hypoxia-inducible factor α stabilization. Moreover, overexpression of PHD2 blocked hypoxic accumulation of phosphorylated eEF2. Therefore, our findings suggest that eEF2 phosphorylation status (and, as a consequence, translation rate) is controlled by PHD2 activity. They unravel a novel pathway for cell adaptation to hypoxia that could have pathophysiologic relevance in tissue ischemia and cancer.
Introduction
Cell adaptation to reduced oxygen availability to maintain ATP levels is a major physiologic challenge because O2 deprivation, even transient, can produce irreversible damage. Cellular responses to hypoxia comprise transcriptional and non-transcriptional mechanisms, the nature of which is as yet only partially known (1–3). Transcriptional adaptation to low O2 tension depends mainly on hypoxia-inducible transcription factors (HIFs),5 master regulators of a broad cohort of genes whose expression decreases the cellular O2 demand and increases O2 supply (3). Cellular levels of HIF-α are inversely correlated with the activity of prolyl hydroxylases (PHDs), O2-sensing and Fe2+-dependent enzymes that hydroxylate specific proline residues in HIF-α using O2 as co-substrate, thus allowing HIF-α ubiquitination and proteasomal degradation (4, 5).
In contrast with the relatively well characterized PHD-HIF pathway, the transcription-independent hypoxic adaptive mechanisms are poorly understood. Nevertheless, they are essential for cell survival during the first minutes of hypoxia, before functional expression of the O2-regulated genes can take place (2, 6). Global inhibition of protein synthesis (“translational arrest”) has been classically recognized as a fundamental adaptation to hypoxia because mRNA translation is an energy-costly process that consumes up to 70% of the ATP synthesized by the cells. Hence, any small adjustment to the translation rate can spare sufficient ATP as to immediately attend functions critical for cell survival (7–10). Several kinases regulated during cell energy starvation, in particular mTOR (mammalian target of rapamycin), the endoplasmic reticulum kinase PERK, and AMP-activated protein kinase (AMPK), have been suggested to contribute to HIF-independent inhibition of protein translation under low O2 conditions (7, 9, 11–13). These phosphorylation/dephosphorylation cascades regulate protein synthesis by precisely modulating the activity of ribosomal initiation and elongation factors (10, 14). In this regard, eukaryotic elongation factor 2 (eEF2), a translocase necessary for the movement of the mRNA along the ribosome, is particularly important as, in conjunction with aminoacylation, it uses most of the ATP required for protein synthesis (15). eEF2 is inhibited by phosphorylation at Thr56 by eEF2 kinase (eEF2K) (16, 17), which in turn is activated by AMPK (18).
Using a proteomic approach designed to detect early adaptive changes during short-term (5–30 min) exposure to hypoxia, we have identified several proteins acutely regulated by O2 availability. Among these proteins, eEF2 was also modulated by dimethyloxalylglycine (DMOG), an inhibitor of the O2-sensing PHDs. Herein, we show that eEF2 activity is rapidly and reversibly regulated by O2 tension in a PHD2-dependent manner. This phenomenon is unrelated to HIF stabilization, and it occurs prior to AMPK activation. These observations, which unveil unexpected actions of the O2-sensing PHD2, could have profound implications for the pathophysiology and pharmacology of cell adaptation to hypoxia.
EXPERIMENTAL PROCEDURES
Cell Culture and Hypoxic Treatments
PC12, Mlp9, HeLa, and HuH7 cells were cultured in DMEM (BioWhittaker) supplemented with 10% FBS (Invitrogen), 100 units/ml penicillin, 100 units/ml streptomycin, and 2 mm l-glutamine (BioWhittaker). Cardiac ventricular myocytes were prepared from 1–3-day-old animals and cultured as described (19). Hepatocytes were isolated from male Wistar rats by collagenase (Invitrogen) perfusion as described previously (41). U2OS Tet-On and U2OS Tet-On/pUHD-FLAG-PHD2 cells were cultured in DMEM supplemented with 10% tetracycline-free FBS (Clontech), 100 units/ml penicillin, 100 units/ml streptomycin, and 5 μg/ml blasticidin S (Invitrogen). 200 μg/ml hygromycin B (Roche Applied Science) was used in U2OS FLAG-PHD2 cultures. Cells were maintained under a water-saturated atmosphere of 5% CO2 and 95% air. DMOG (BIOMOL International) was used at a final concentration of 1 mm, NaF (Sigma) was used at 25 mm, and 5-aminoimidazole-4-carboxamide riboside (Sigma) was used at 1 mm. Okadaic acid (Calbiochem) and sanguinarine (Sigma) were used at the concentrations specified.
Hypoxic conditions (1% O2, 94% N2, and 5% CO2) were achieved in a humidified variable aerobic workstation (Invivo2 300, Ruskinn Technology Ltd.). In all experiments, cells were plated at 30–50% confluence to prevent the development of anaerobic conditions at 1% O2. Before experimentation, media were pre-equilibrated overnight to the experimental oxygen level.
Protein Analysis
Sample Preparation, Labeling, and Analysis by Two-dimensional Difference Gel Electrophoresis (DIGE)
S100 protein extracts from PC12 cells were prepared and labeled as described (20). 150 μg of labeled protein containing three extracts of equal amounts (normoxic, hypoxic, or DMOG-treated and the internal standard) were used for two-dimensional DIGE. Electrophoretic conditions, quantitative analysis of differences, and preparative gels were as described (20). Four biological replicates were used in all of the experiments.
eEF2 Purification from Rat Liver
Rat livers were homogenized, and eEF2 was purified as described (21) using an ÄKTA purifier (GE Healthcare).
Western Blotting, Protein Synthesis Measurements, and MALDI-MS/MS Analysis
These are described under supplemental “Methods.”
RNA Interference
Transfections of siRNAs were carried out using Lipofectamine 2000 (Invitrogen) at a final concentration of 20 nm. Previously validated sequences of siRNAs were used (22, 23). However, the efficacy of the transfection in each experiment was ascertained by immunoblotting and/or real-time quantitative PCR. Unpublished siRNAs and oligonucleotide sequences are provided under supplemental “Methods.”
ATP Measurements
ATP levels in cell extracts were determined with a CLS II ATP bioluminescence assay kit (Roche Applied Science) using a GloMaxTM 96-microplate luminometer equipped with an autoinjection device (Promega).
Statistics
Data are presented as the mean ± S.E. and were analyzed by one-way analysis of variance, followed by Tukey's test. p < 0.05 was considered statistically significant.
RESULTS
Acute O2-dependent Modulation of Cell Proteome
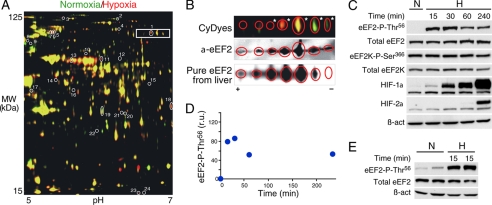
We performed proteomic (two-dimensional DIGE) analyses of soluble subcellular fractions (S100) (20) obtained from homogenates of PC12 cells exposed to normoxia (21% O2) or hypoxia (1% O2) for 15–30 min. A two-dimensional map of the S100 fraction is shown in Fig. 1A, with spots whose relative amounts increased (red), decreased (green), or were unchanged (yellow) under hypoxia. Among the 2598 spots detected, 24 were identified in all of the experimental replicates and changed their relative amount under hypoxia versus normoxia (>1.5-fold; p < 0.05) (supplemental Table I). In two-dimensional gels, eEF2 appeared in a strip of spots that could correspond to additive modifications of the protein (Fig. 1A, boxed); hence, we extended our analysis to additional neighboring spots. These modifications are probably due to different diphthamide content in eEF2. Among the seven spots studied (Fig. 1B, upper panel), five were identified as eEF2 by MALDI-MS(/MS) (asterisks), and all were recognized by an anti-eEF2 antibody (Fig. 1B, middle panel). Accordingly, eEF2 purified from rat liver and separated by two-dimensional electrophoresis showed a similar distribution (Fig. 1B, lower panel). These results revealed that eEF2 is modified by short-term exposure to hypoxia, thus suggesting that it could be a mediator of the early adaptive mechanisms triggered by low O2 tension.
FIGURE 1.
Acute inhibitory eEF2 phosphorylation (Thr56) is induced by hypoxia. A, representative two-dimensional gel. Extracts from normoxic (21% O2; green) or hypoxic (1% O2, 15 min; red) PC12 cells migrated in the same gel. Numbered spots correspond to the spots listed in supplemental Table I. The internal standard extract is not shown in the image. B, same spots as those boxed in A labeled with CyDye from a different two-dimensional gel (upper panel). Five spots (asterisks) were identified as eEF2 by peptide mass fingerprinting analysis. Western blotting of the marked spots was performed using an anti-eEF2 antibody (α_-eEF2_; middle panel). eEF2 was purified from rat liver, separated by two-dimensional electrophoresis, and detected by SYPRO staining (lower panel). C, phosphorylation of eEF2 at Thr56 in HuH7 cells subjected to normoxia (N) or hypoxia (H; 1% O2) for 15–240 min. The levels of eEF2K, eEF2K Ser366, β-actin (β_-act_), HIF-1α, and HIF-2α were analyzed in the same cell extracts. D, quantification of eEF2 phospho-Thr56 levels in C. r.u., relative units. E, hepatocytes subjected to normoxia or hypoxia (1% O2) for 15 min. Two independent experiments are shown. The total levels of eEF2 and β-actin were analyzed by Western blotting.
It is known that eEF2 activity is inhibited by phosphorylation at Thr56 through a specific eEF2 kinase (16, 17). Therefore, we tested in several cell types whether the changes in eEF2 observed in the two-dimensional DIGE analyses correlated with modifications in eEF2 Thr56 phosphorylation status using specific phospho-Thr56 antibodies. Hypoxia (1% O2) produced a marked increase in eEF2 phosphorylation that was detectable 15 min after exposure of cells to low O2 tension. The total amount of eEF2 was unchanged by exposure to hypoxia (Fig. 1, C–E, and supplemental Fig. 1, A and B).
Inhibitory eEF2 Phosphorylation by Acute Hypoxia Occurs before ATP Depletion and AMPK Activation
As mentioned previously, several kinases modulated by energy starvation are also regulated during sustained hypoxic conditions (7, 9, 12, 13, 18). AMPK, activated by phosphorylation at Thr172 by LKB1 (liver kinase B1) when the AMP/ATP ratio increases (24–27), can activate eEF2K through phosphorylation at Ser398 (18) and thus induce inhibitory Thr56 phosphorylation of eEF2 (16, 17). We postulated that the fast O2-dependent modulation of eEF2 reported here should occur prior to and independently of AMPK activation.
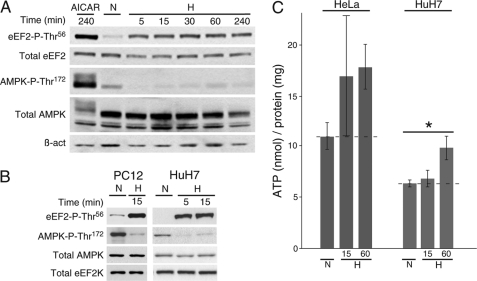
As expected, exposure of hepatocytes to 1% O2 revealed a clear increase in eEF2 Thr56 phosphorylation detectable as soon as 5 min after O2 deprivation, without any increase in the levels of active AMPK (phosphorylated at Thr172). In contrast, cells treated with 5-aminoimidazole-4-carboxamide riboside, an AMPK activator used as a control (28), showed strong activation of AMPK (Fig. 2A). Short-term exposure to hypoxia also resulted in an increase in eEF2 phospho-Thr56 and decrease in AMPK phospho-Thr172 levels in other cell types analyzed (Fig. 2B). Interestingly, the amount of active AMPK during hypoxic exposures lasting up to 4 h remained even lower than that under normoxia (Fig. 2, A and B). In fair agreement with these data, the cellular ATP concentration did not change (or even increased) after 15 or 60 min of hypoxia (1% O2) (Fig. 2C). The activity of eEF2K is inhibited by phosphorylation at Ser366, a process regulated by p90RSK/p70S6K kinases (18). Short-term hypoxia did not produce any changes in the cellular levels of eEF2K phospho-Ser366 (Fig. 1C). Hypoxic treatment did not alter the total levels of eEF2, eEF2K, or AMPK (Figs. 1C and 2B).
FIGURE 2.
Inhibitory eEF2 phosphorylation under acute hypoxia is independent of AMPK activity. A, phosphorylation of eEF2 (Thr56) and AMPK (Thr172) analyzed by Western blotting in hepatocytes subjected to hypoxia (H) for 5–240 min or treated with the AMPK activator 5-aminoimidazole-4-carboxamide riboside (AICAR) for 240 min as a control. B, phosphorylation of eEF2 (Thr56) and AMPK (Thr172) analyzed by Western blotting in PC12 (left panels) and HuH7 (right panels) cells exposed to normoxia or hypoxia for 5 or 15 min. Total AMPK, eEF2K, and β-actin (β_-act_) were used as loading controls. C, ATP levels in HeLa (left bars) and HuH7 (right bars) cell lysates exposed to normoxia or hypoxia for 15 or 60 min. Dashed lines represent normoxic levels. *, p < 0.05 (n = 5).
Hypoxia and PHD2 Inhibition Increase eEF2 Phosphorylation in a HIF-independent Manner
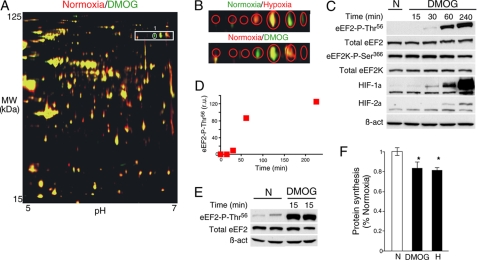
To test whether some of the identified proteins modified by hypoxia could be under the control of the O2-sensing PHDs, cells were exposed to DMOG, a competitive inhibitor of 2-oxoglutarate-dependent dioxygenases, including PHDs (4, 29). Control (untreated) and 15-min DMOG-treated cells were processed by two-dimensional DIGE, and a representative gel of the S100 fraction is shown in Fig. 3A, with proteins whose relative amounts increased (green), decreased (red), or were unchanged (yellow) after DMOG treatment. Only spot 1, identified by mass fingerprinting analysis as eEF2, changed both under hypoxia (Fig. 1A) and after DMOG treatment (Fig. 3A). Like hypoxia, DMOG treatment also elicited, in several cell types, a similar phospho-Thr56 eEF2 accumulation although with a slower time course (Fig. 3, C–E, and supplemental Fig. 1_B_). DMOG-triggered accumulation of either HIF-1α or HIF-2α, used as controls (Fig. 3C), was also delayed compared with hypoxia, thus possibly reflecting DMOG cellular uptake and metabolization to the active _N_-oxalylglycine inhibitor.
FIGURE 3.
Acute inhibitory eEF2 phosphorylation (Thr56) induced by DMOG treatment. A, representative two-dimensional gel showing protein extracts from control (red) and DMOG-treated (green) cells. The encircled spot was differentially expressed after DMOG treatment and is similar to spot 1 in Fig. 1A. The boxed area represents the same area of the gel shown in Fig. 1A. B, two-dimensional gel region showing spots modified by hypoxia (upper panel) and DMOG (lower panel). C, phosphorylation of eEF2 (Thr56) in HuH7 cells subjected to normoxia (N) or DMOG (1 mm) for 15–240 min. The levels of eEF2K, eEF2K Ser366, β-actin (β_-act_), HIF-1α, and HIF-2α were analyzed in the same cell extracts. D, quantification of eEF2 phospho-Thr56 levels in C. r.u., relative units. E, hepatocytes subjected to normoxia or DMOG (1 mm) for 15 min. Two independent experiments are shown. The total levels of eEF2 and β-actin were analyzed by Western blotting. F, protein synthesis ([35S]Met incorporation) in cardiomyocytes exposed to normoxia, DMOG, or hypoxia (H) for 4 h. Data are represented relative to normoxia. *, p < 0.05 (n = 5).
As transformed cell lines normally show some resistance to hypoxic translational arrest (30), we estimated if the increase in phosphorylation of eEF2 by short-term hypoxia or DMOG induced a concomitant decrease in protein translation in primary cultured hepatocytes (Fig. 3E). As expected, hypoxic and DMOG treatments resulted in a significant decrease in the protein synthesis rate as determined by [35S]Met incorporation assay (Fig. 3F).
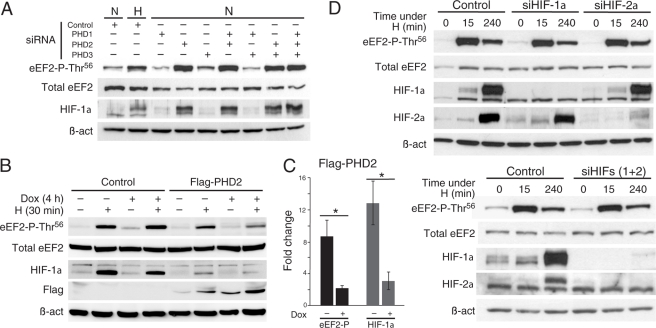
Hypoxia and DMOG rapidly inhibit PHDs; therefore, the involvement of these enzymes in the modulation of protein synthesis was studied using cells incubated with siRNA specific to each PHD (22). We observed a selective increase in eEF2 phospho-Thr56 after PHD2 silencing and no effect after inhibition of either PHD1 or PHD3 (Fig. 4A). The effectiveness of the siRNA treatment on PHD mRNAs was confirmed by quantitative RT-PCR (supplemental Table II). PHD2 silencing was also demonstrated by selective stabilization of HIF-1α (Fig. 4A). PHD down-regulation studied in several cell types always correlated with hyperphosphorylation of eEF2 at Thr56 (supplemental Fig. 2_A_).
FIGURE 4.
Hypoxic eEF2 phosphorylation is regulated by PHD2 in HIF-independent manner. A, phosphorylation of eEF2 (Thr56) and levels of HIF-1α examined by Western blotting 48 h after siRNA transfection. HeLa cells were transfected either with PHD siRNAs or a non-silencing scrambled siRNA (Control). Control cells were independently subjected to hypoxia (H) for 15 min. In all the experiments, sample loading was normalized with total eEF2 and β-actin (β_-act_). B, hypoxic eEF2 phosphorylation at Thr56 is prevented by acute PHD2 overexpression. Shown is the phosphorylation of eEF2 in control or PHD2-expressing U2OS cells (FLAG-PHD2). Cells were treated with doxycycline (Dox) for 4 h when indicated (+) and subjected to normoxia (N) or hypoxia (1% O2) for 30 min. The levels of HIF-1α and FLAG-PHD2 were analyzed in the same cell extracts. The total levels of eEF2 and β-actin were also analyzed by Western blotting. C, quantification of the -fold change produced in the levels of eEF2 phospho-Thr56 (black bars) and HIF-1α (gray bars) by 30 min of hypoxia in the absence (−) or presence (+) of doxycycline in FLAG-PHD2 cell cultures. *, p < 0.05 (n = 3). D, hypoxic eEF2 phosphorylation at Thr56 is independent of HIF-α activity. HeLa cells were transfected with a scrambled siRNA (Control), HIF-1α (_siHIF-1_α) or HIF-2α (_siHIF-2_α) siRNA (upper panels), or both (lower panels) for 24 h and exposed to hypoxia for 0, 15, or 240 min. The levels of eEF2 phospho-Thr56, eEF2, HIF-1α, HIF-2α, and β-actin were analyzed by Western blotting.
To further prove the direct involvement of PHD2 in the regulation of eEF2 by acute hypoxia, we used a cell line (U2OS) in which PHD2 expression is conditionally induced by doxycycline.6 Overexpression of PHD2 is known to inhibit stabilization of HIF-1 and HIF-2α under hypoxia (23, 31); hence, we tested whether PHD2 overexpression also prevents eEF2 phosphorylation by acute hypoxia. After 4 h in doxycycline, PHD2 expression was observed in U2OS cells (Fig. 4B) and was correlated with a clear decrease in the amount of eEF2 phosphorylated after 30 min of hypoxic treatment (Fig. 4B; see quantification in Fig. 4C, p = 0.024). As a control, we tested whether HIF-1α stabilization by hypoxia was also partially prevented by PHD2 expression (Fig. 4B; see quantification in Fig. 4C, p = 0.044).
Because inhibition of PHD2 by hypoxia, DMOG, or siRNA leads to HIF-α accumulation, we investigated whether HIF might regulate eEF2 phosphorylation at Thr56. Although expression of either HIF-1α or HIF-2α under hypoxia was clearly abolished using specific siRNAs, eEF2 phosphorylation was unaltered (Fig. 4D, upper panels). Hypoxia-dependent eEF2 phosphorylation was observed even though HIF-1α and HIF-2α were simultaneously silenced to prevent possible compensatory effects of any of the isoforms (Fig. 4D, lower panels). The dispensability of HIF-α for the hypoxic/DMOG-induced eEF2 phosphorylation was further confirmed using a genetically modified embryonic stem cell line lacking HIF-1α (supplemental Fig. 2_B_) (32).
eEF2 Phosphorylation by Hypoxia Is Reversible and Strongly Controlled by Phosphatase Activity
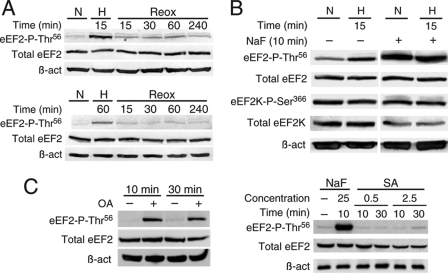
Accumulation of phosphorylated eEF2 under hypoxia was rapidly (<15 min) reversed upon reoxygenation, independently of the duration of the hypoxic treatment (Fig. 5A), thus supporting the notion that O2-dependent eEF2 phosphorylation is indeed a tightly regulated process. Furthermore, inhibition of Ser/Thr phosphatases with NaF produced a marked increase in the amount of eEF2 phospho-Thr56, which was not further modified by subsequent exposure to hypoxia. In contrast, phosphorylation of eEF2K at Ser366, used as a control for phosphatase activity, was unchanged. Hence, eEF2 phospho-Thr56 appears to be highly susceptible to the action of phosphatases (Fig. 5B). To identify the phosphatase acting on eEF2, we used inhibitors more specific than NaF. It has been described that eEF2 can be dephosphorylated by PP2A and PP2C (33, 34). Hence, we tested specific inhibitors for each phosphatase and analyzed where they reproduce the fast changes in the level of phosphorylation of eEF2 observed under hypoxia. A short okadaic acid treatment (a PP2A inhibitor) produced a strong accumulation of eEF2 (Fig. 5C, left panels), but sanguinarine (a PP2C inhibitor) did not affect the phosphorylation status of eEF2 (right panels). These results suggest that PP2A controls the phosphorylation status of eEF2 under normoxia.
FIGURE 5.
Phosphorylation of eEF2 at Thr56 is dynamic. A, levels of eEF2 phosphorylation (Thr56) in HuH7 cells subjected to hypoxia (H) for 15 (upper panels) or 60 (lower panels) min and recovery after returning to normoxia (N) for 15–240 min (Reox). B, phosphorylation of eEF2 (Thr56) and eEF2K (Ser366) in HeLa cells treated with the Thr/Ser phosphatase inhibitor NaF (25 mm) for 10 min. Cells were also exposed to normoxia or hypoxia for 15 min. The total levels of eEF2K, eEF2, and β-actin (β_-act_) were also analyzed by Western blotting. C, phosphorylation of eEF2 at Thr56 is enhanced by a short okadaic acid treatment (OA; 250 nm; left panels) and is not affected by treatment with sanguinarine (SA; 0.5–2.5 μm; right panels). NaF (25 mm) treatment was performed as a control.
DISCUSSION
In this work, we have described selective post-transcriptional adaptive changes in the proteome of mammalian cells elicited by acute hypoxia. We focused on eEF2, a translocase necessary for protein synthesis, although we identified two other proteins (arginyl aminopeptidase and protease inhibitor SerpinB6) also altered by lowering O2 tension (supplemental Table I). We have shown that hypoxic inhibitory eEF2 phosphorylation is independent of AMPK activity and is mimicked by DMOG treatment, thus suggesting that eEF2 activity and protein synthesis are modulated by PHDs.
Translational arrest is a classically studied cellular response to anoxia or long-term hypoxia (for a review, see Ref. 14). It has also been reported that a short (2 h) exposure to moderate hypoxia (0.2–2% O2) can lead to a modest but reproducible decrease in translation efficiency (35), an effect that is better observed with longer (>24 h) treatments (12, 13, 36, 37). We have shown here that acute (5–15 min) hypoxia (1% O2) or DMOG treatment leads to changes in the eEF2 migration pattern as a consequence of increased protein phosphorylation at Thr56. It is well established that phosphorylation of eEF2 at Thr56 decreases the rate of protein elongation (16, 17, 38), a mechanism that can contribute to mRNA translation inhibition by hypoxia and DMOG observed in primary cultured cardiomyocytes (Fig. 3F). Similar results have been reported using tumor/immortalized cell lines (12, 13), but longer periods, more severe hypoxia, or even concomitant serum withdrawal was required to observe a decrease in protein synthesis in these cellular models that are normally resistant to mRNA translation inhibition by hypoxia (30).
The activation of the AMPK-eEF2K-eEF2 pathway to arrest protein translation under long-term hypoxia or ischemia has been elegantly demonstrated in previous reports (12, 13). However, the inhibition of eEF2 activity observed under acute hypoxia described here is independent of this pathway. Indeed, we have shown that short-term hypoxia even decreases AMPK activity in all cells tested (Fig. 2, A and B). In agreement with these data, cellular ATP levels were preserved or increased upon acute exposure to hypoxia (Fig. 2C) (13, 39). The existence of complementary PHD2- and AMPK-dependent eEF2 modulator pathways set in motion depending on O2 availability is advantageous because it offers a broader adaptive repertoire to ensure ATP homeostasis.
As DMOG inhibits a broad family (>50 members) of 2-oxoglutarate-dependent dioxygenases (4, 29), we performed siRNA analyses to identify the PHDs involved in eEF2 regulation. We found that selective inhibition of PHD2 in several cell lines leads to sustained eEF2 phosphorylation at Thr56, thus confirming that protein synthesis is modulated by the activity of the O2 sensor PHD2 (Fig. 4A and supplemental Fig. 2_A_). To achieve a strong silencing of PHD2, cells were treated with siRNAs for 72 h, inducing several HIF-regulated pathways that could, indirectly, lead to phosphorylation of eEF2. However, overexpression of PHD2 for 4 h produced a strong inhibition of the hypoxia-dependent phosphorylation of eEF2 (Fig. 4, B and C), an effect that has been also shown for hypoxia-induced HIF stabilization (23, 31). Altogether, these data suggest the control of PHD2 over the elongation phase of protein translation. PHD2-dependent regulation of translation is independent of HIF-α activity and takes place a few minutes after PHD inhibition (Fig. 4C and supplemental Fig. 2_B_). Sequence analyses revealed the presence in eEF2 of three motifs consisting of a proline preceded by two neighboring leucines (L_X_L_X_P), resembling the hydroxylation consensus motifs (L_XX_LAP) existing in the O2-dependent degradation domain of HIF-α (4, 5). However, additional work will be required to determine whether PHD2 regulates eEF2 by direct hydroxylation of these residues or, alternatively, modulates the activity of other proteins, including eEF2K or any subunit of the cellular phosphatases.
O2 influx to tissues can be a fluctuating condition (40); thus, the mechanisms regulating hypoxic responses must be reversible and easily adjustable to oxygen availability. Interestingly, phosphorylation of eEF2 is tightly regulated by the activity of specific kinases and phosphatases (33, 34, 38). We have shown here that phosphorylation of eEF2 at Thr56 by hypoxia is quickly reversed upon returning to normoxia (Fig. 5A). A short exposure (10 min) of cells to a Ser/Thr phosphatase inhibitor leads to marked accumulation of phosphorylated eEF2, indicating a high basal activity of phosphatases acting on eEF2 (Fig. 5B). Our pharmacological studies revealed that acute inhibition of PP2A activity leads to a similar accumulation of phosphorylated eEF2 (Fig. 5C), suggesting a role of this protein in the regulation of protein synthesis by acute hypoxia. The tight regulation and fast reversibility of the eEF2 phosphorylation/dephosphorylation status make this protein an ideal candidate to control the protein synthesis rate in response to variable conditions of tissue O2 availability.
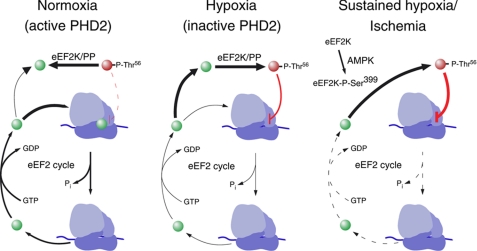
In conclusion, we propose a novel mechanism that helps explain acute translational arrest under hypoxia, which is AMPK- and HIF-independent and relies on PHD2-mediated regulation of eEF2 activity (see scheme in Fig. 6). However, a complete understanding of the mechanism whereby PHD2 regulates eEF2 phosphorylation must await further investigation. Besides its obvious interest for the biology of hypoxia and hypoxia/reperfusion, the PHD2-eEF2 pathway could provide new perspectives relevant for the pharmacology of tissue ischemia and cancer.
FIGURE 6.
Schematic representation of eEF2 cycle in ribosome (blue). Under normoxia (left), eEF2K/protein phosphatase (PP) balance is displaced to the unphosphorylated form of eEF2 (green spheres) in a PHD2-dependent process. Acute hypoxia (center) inhibits PHD2 activity and leads to increased eEF2 phosphorylation (red spheres), which slows down the eEF2 cycle. Under sustained hypoxia or anoxic/ischemic conditions (right), AMPK is activated, which leads to stimulatory eEF2K phosphorylation (Ser399), eEF2 phosphorylation, and strong inhibition of the protein synthesis rate.
Supplementary Material
Supplemental Data
Acknowledgments
We thank Peter Ratcliffe and Norma Masson for providing unpublished U2OS cell lines. We thank Drs. M. L. Martínez-Chantar and M. Varela (CIC bioGUNE) for kindly providing the hepatocyte primary cultures.
*
This work was supported by the Spanish Ministry of Science and Health, the Marcelino Botin Foundation, and the Andalusian Government.
6
N. Masson and P. J. Ratcliffe, unpublished data.
5
The abbreviations used are:
HIF
hypoxia-inducible transcription factor
PHD
prolyl hydroxylase
AMPK
AMP-activated protein kinase
eEF2
eukaryotic elongation factor 2
eEF2K
eEF2 kinase
DMOG
dimethyloxalylglycine
DIGE
difference gel electrophoresis.
REFERENCES
- 1.Kaelin W. G., Jr., Ratcliffe P. J. (2008) Oxygen sensing by metazoans: the central role of the HIF hydroxylase pathway. Mol. Cell 30, 393–402 [DOI] [PubMed] [Google Scholar]
- 2.Lopez-Barneo J., Pardal R., Ortega-Sáenz P. (2001) Cellular mechanism of oxygen sensing. Annu. Rev. Physiol. 63, 259–287 [DOI] [PubMed] [Google Scholar]
- 3.Semenza G. L. (2009) Regulation of oxygen homeostasis by hypoxia-inducible factor 1. Physiology 24, 97–106 [DOI] [PubMed] [Google Scholar]
- 4.Epstein A. C., Gleadle J. M., McNeill L. A., Hewitson K. S., O'Rourke J., Mole D. R., Mukherji M., Metzen E., Wilson M. I., Dhanda A., Tian Y. M., Masson N., Hamilton D. L., Jaakkola P., Barstead R., Hodgkin J., Maxwell P. H., Pugh C. W., Schofield C. J., Ratcliffe P. J. (2001) C. elegans EGL-9 and mammalian homologs define a family of dioxygenases that regulate HIF by prolyl hydroxylation. Cell 107, 43–54 [DOI] [PubMed] [Google Scholar]
- 5.Masson N., Willam C., Maxwell P. H., Pugh C. W., Ratcliffe P. J. (2001) Independent function of two destruction domains in hypoxia-inducible factor α chains activated by prolyl hydroxylation. EMBO J. 20, 5197–5206 [DOI] [PMC free article] [PubMed] [Google Scholar]
- 6.Weir E. K., López-Barneo J., Buckler K. J., Archer S. L. (2005) Acute oxygen-sensing mechanisms. N. Engl. J. Med. 353, 2042–2055 [DOI] [PMC free article] [PubMed] [Google Scholar]
- 7.Arsham A. M., Howell J. J., Simon M. C. (2003) A novel hypoxia-inducible factor-independent hypoxic response regulating mammalian target of rapamycin and its targets. J. Biol. Chem. 278, 29655–29660 [DOI] [PubMed] [Google Scholar]
- 8.Hochachka P. W., Buck L. T., Doll C. J., Land S. C. (1996) Unifying theory of hypoxia tolerance: molecular/metabolic defense and rescue mechanisms for surviving oxygen lack. Proc. Natl. Acad. Sci. U.S.A. 93, 9493–9498 [DOI] [PMC free article] [PubMed] [Google Scholar]
- 9.Koumenis C., Naczki C., Koritzinsky M., Rastani S., Diehl A., Sonenberg N., Koromilas A., Wouters B. G. (2002) Regulation of protein synthesis by hypoxia via activation of the endoplasmic reticulum kinase PERK and phosphorylation of the translation initiation factor eIF2α. Mol. Cell. Biol. 22, 7405–7416 [DOI] [PMC free article] [PubMed] [Google Scholar]
- 10.Wouters B. G., van den Beucken T., Magagnin M. G., Koritzinsky M., Fels D., Koumenis C. (2005) Control of the hypoxic response through regulation of mRNA translation. Semin. Cell Dev. Biol. 16, 487–501 [DOI] [PubMed] [Google Scholar]
- 11.Browne G. J., Proud C. G. (2004) A novel mTOR-regulated phosphorylation site in elongation factor 2 kinase modulates the activity of the kinase and its binding to calmodulin. Mol. Cell. Biol. 24, 2986–2997 [DOI] [PMC free article] [PubMed] [Google Scholar]
- 12.Connolly E., Braunstein S., Formenti S., Schneider R. J. (2006) Hypoxia inhibits protein synthesis through a 4E-BP1 and elongation factor 2 kinase pathway controlled by mTOR and uncoupled in breast cancer cells. Mol. Cell. Biol. 26, 3955–3965 [DOI] [PMC free article] [PubMed] [Google Scholar]
- 13.Liu L., Cash T. P., Jones R. G., Keith B., Thompson C. B., Simon M. C. (2006) Hypoxia-induced energy stress regulates mRNA translation and cell growth. Mol. Cell 21, 521–531 [DOI] [PMC free article] [PubMed] [Google Scholar]
- 14.Koritzinsky M., Wouters B. G. (2007) Hypoxia and regulation of messenger RNA translation. Methods Enzymol. 435, 247–273 [DOI] [PubMed] [Google Scholar]
- 15.Proud C. G. (2007) Signaling to translation: how signal transduction pathways control the protein synthetic machinery. Biochem. J. 403, 217–234 [DOI] [PubMed] [Google Scholar]
- 16.Nairn A. C., Palfrey H. C. (1987) Identification of the major _M_r 100,000 substrate for calmodulin-dependent protein kinase III in mammalian cells as elongation factor 2. J. Biol. Chem. 262, 17299–17303 [PubMed] [Google Scholar]
- 17.Ryazanov A. G., Shestakova E. A., Natapov P. G. (1988) Phosphorylation of elongation factor 2 by EF2 kinase affects rate of translation. Nature 334, 170–173 [DOI] [PubMed] [Google Scholar]
- 18.Browne G. J., Finn S. G., Proud C. G. (2004) Stimulation of the AMP-activated protein kinase leads to activation of eukaryotic elongation factor 2 kinase and to its phosphorylation at a novel site, serine 398. J. Biol. Chem. 279, 12220–12231 [DOI] [PubMed] [Google Scholar]
- 19.Akao M., Ohler A., O'Rourke B., Marbán E. (2001) Mitochondrial ATP-sensitive potassium channels inhibit apoptosis induced by oxidative stress in cardiac cells. Circ. Res. 88, 1267–1275 [DOI] [PubMed] [Google Scholar]
- 20.Pascual A., Romero-Ruiz A., Lopez-Barneo J. (2009) Differential proteomic analysis of adrenal gland during postnatal development. Proteomics 9, 2946–2954 [DOI] [PubMed] [Google Scholar]
- 21.Horman S., Browne G., Krause U., Patel J., Vertommen D., Bertrand L., Lavoinne A., Hue L., Proud C., Rider M. (2002) Activation of AMP-activated protein kinase leads to the phosphorylation of elongation factor 2 and an inhibition of protein synthesis. Curr. Biol. 12, 1419–1423 [DOI] [PubMed] [Google Scholar]
- 22.Berra E., Benizri E., Ginouvès A., Volmat V., Roux D., Pouysségur J. (2003) HIF prolyl hydroxylase 2 is the key oxygen sensor setting low steady-state levels of HIF-1α in normoxia. EMBO J. 22, 4082–4090 [DOI] [PMC free article] [PubMed] [Google Scholar]
- 23.Ginouvès A., Ilc K., Macías N., Pouysségur J., Berra E. (2008) PHD overactivation during chronic hypoxia “desensitizes” HIF-α and protects cells from necrosis. Proc. Natl. Acad. Sci. U.S.A. 105, 4745–4750 [DOI] [PMC free article] [PubMed] [Google Scholar]
- 24.Hardie D. G., Scott J. W., Pan D. A., Hudson E. R. (2003) Management of cellular energy by the AMP-activated protein kinase system. FEBS Lett. 546, 113–120 [DOI] [PubMed] [Google Scholar]
- 25.Hawley S. A., Davison M., Woods A., Davies S. P., Beri R. K., Carling D., Hardie D. G. (1996) Characterization of the AMP-activated protein kinase kinase from rat liver and identification of threonine 172 as the major site at which it phosphorylates AMP-activated protein kinase. J. Biol. Chem. 271, 27879–27887 [DOI] [PubMed] [Google Scholar]
- 26.Lizcano J. M., Göransson O., Toth R., Deak M., Morrice N. A., Boudeau J., Hawley S. A., Udd L., Mäkelä T. P., Hardie D. G., Alessi D. R. (2004) LKB1 is a master kinase that activates 13 kinases of the AMPK subfamily, including MARK/PAR-1. EMBO J. 23, 833–843 [DOI] [PMC free article] [PubMed] [Google Scholar]
- 27.Shaw R. J., Kosmatka M., Bardeesy N., Hurley R. L., Witters L. A., DePinho R. A., Cantley L. C. (2004) The tumor suppressor LKB1 kinase directly activates AMP-activated kinase and regulates apoptosis in response to energy stress. Proc. Natl. Acad. Sci. U.S.A. 101, 3329–3335 [DOI] [PMC free article] [PubMed] [Google Scholar]
- 28.Corton J. M., Gillespie J. G., Hawley S. A., Hardie D. G. (1995) 5-Aminoimidazole-4-carboxamide ribonucleoside. A specific method for activating AMP-activated protein kinase in intact cells? Eur. J. Biochem. 229, 558–565 [DOI] [PubMed] [Google Scholar]
- 29.Jaakkola P., Mole D. R., Tian Y. M., Wilson M. I., Gielbert J., Gaskell S. J., von Kriegsheim A., Hebestreit H. F., Mukherji M., Schofield C. J., Maxwell P. H., Pugh C. W., Ratcliffe P. J. (2001) Targeting of HIF-α to the von Hippel-Lindau ubiquitylation complex by O2-regulated prolyl hydroxylation. Science 292, 468–472 [DOI] [PubMed] [Google Scholar]
- 30.Höckel M., Vaupel P. (2001) Tumor hypoxia: definitions and current clinical, biologic, and molecular aspects. J. Natl. Cancer Inst. 93, 266–276 [DOI] [PubMed] [Google Scholar]
- 31.Takeda K., Fong G. H. (2007) Prolyl hydroxylase domain 2 protein suppresses hypoxia-induced endothelial cell proliferation. Hypertension 49, 178–184 [DOI] [PubMed] [Google Scholar]
- 32.Carmeliet P., Dor Y., Herbert J. M., Fukumura D., Brusselmans K., Dewerchin M., Neeman M., Bono F., Abramovitch R., Maxwell P., Koch C. J., Ratcliffe P., Moons L., Jain R. K., Collen D., Keshert E. (1998) Role of HIF-1α in hypoxia-mediated apoptosis, cell proliferation, and tumor angiogenesis. Nature 394, 485–490 [DOI] [PubMed] [Google Scholar]
- 33.Redpath N. T., Proud C. G. (1990) Activity of protein phosphatases against initiation factor 2 and elongation factor 2. Biochem. J. 272, 175–180 [DOI] [PMC free article] [PubMed] [Google Scholar]
- 34.Redpath N. T., Proud C. G. (1991) Differing effects of the protein phosphatase inhibitors okadaic acid and microcystin on translation in reticulocyte lysates. Biochim. Biophys. Acta 1093, 36–41 [DOI] [PubMed] [Google Scholar]
- 35.Koritzinsky M., Rouschop K. M., van den Beucken T., Magagnin M. G., Savelkouls K., Lambin P., Wouters B. G. (2007) Phosphorylation of eIF2α is required for mRNA translation inhibition and survival during moderate hypoxia. Radiother. Oncol. 83, 353–361 [DOI] [PubMed] [Google Scholar]
- 36.Lang K. J., Kappel A., Goodall G. J. (2002) Hypoxia-inducible factor 1α mRNA contains an internal ribosome entry site that allows efficient translation during normoxia and hypoxia. Mol. Biol. Cell 13, 1792–1801 [DOI] [PMC free article] [PubMed] [Google Scholar]
- 37.Thomas J. D., Johannes G. J. (2007) Identification of mRNAs that continue to associate with polysomes during hypoxia. RNA 13, 1116–1131 [DOI] [PMC free article] [PubMed] [Google Scholar]
- 38.Redpath N. T., Price N. T., Severinov K. V., Proud C. G. (1993) Regulation of elongation factor 2 by multisite phosphorylation. Eur. J. Biochem. 213, 689–699 [DOI] [PubMed] [Google Scholar]
- 39.Lefebvre V. H., Van Steenbrugge M., Beckers V., Roberfroid M., Buc-Calderon P. (1993) Adenine nucleotides and inhibition of protein synthesis in isolated hepatocytes incubated under different _p_O2 levels. Arch. Biochem. Biophys. 304, 322–331 [DOI] [PubMed] [Google Scholar]
- 40.Bristow R. G., Hill R. P. (2008) Hypoxia and metabolism. Hypoxia, DNA repair, and genetic instability. Nat. Rev. Cancer 8, 180–192 [DOI] [PubMed] [Google Scholar]
- 41.Avila M. A., Carretero M. V., Rodriguez E. N., Mato J. M. (1998) Regulation by hypoxia of methionine adenosyltransferase activity and gene expression in rat hepatocytes. Gastroenterology 114, 364–371 [DOI] [PubMed] [Google Scholar]
Associated Data
This section collects any data citations, data availability statements, or supplementary materials included in this article.
Supplementary Materials
Supplemental Data
