Measurements of single DNA molecule packaging dynamics in bacteriophage λ reveal high forces, high motor processivity, and capsid transformations (original) (raw)
. Author manuscript; available in PMC: 2012 Mar 24.
Published in final edited form as: J Mol Biol. 2007 Sep 11;373(5):1113–1122. doi: 10.1016/j.jmb.2007.09.011
Abstract
Molecular motors drive genome packaging into preformed procapsids in many dsDNA viruses. Here, we present optical tweezers measurements of single DNA molecule packaging in bacteriophage λ. DNA-gpA-gpNu1 complexes were assembled with recombinant gpA and gpNu1 proteins and tethered to microspheres, and procapsids were attached to separate microspheres. DNA binding and initiation of packaging were observed within a few seconds of bringing these microspheres into proximity in the presence of ATP. The motor was observed to generate greater than 50 picoNewtons (pN) of force, in the same range as observed with bacteriophage _ϕ_29, suggesting that high force generation is a common property of viral packaging motors. However, at low capsid filling the packaging rate averaged ~600 bp/s, which is 3.5-fold higher than _ϕ_29, and the motor processivity was also 3-fold higher, with less than one slip per genome length translocated. The packaging rate slowed significantly with increasing capsid filling, indicating a buildup of internal force reaching 14 pN at 86% packaging, in good agreement with the force driving DNA ejection measured in osmotic pressure experiments and calculated theoretically. Taken together, these experiments show that the internal force that builds during packaging is largely available to drive subsequent DNA ejection. In addition, we observed an 80 bp/s dip in the average packaging rate at 30% packaging, suggesting that procapsid expansion occurs at this point following the buildup of an average of 4 pN of internal force. In experiments with a DNA construct longer than the wild-type genome, a sudden acceleration in packaging rate was observed above 90% packaging in many cases, and greater than 100% of the genome length was translocated, suggesting that internal force can rupture the immature procapsid.
Introduction
Virus assembly is a remarkable example of supramolecular self-assembly wherein coordinated protein-protein and protein-nucleic acid interactions lead to the formation of hundreds of identical copies of the virus per infected host cell. While viruses exhibit a variety of assembly pathways, common features exist in many cases. For instance, numerous double-stranded DNA viruses, including certain tailed bacteriophages and animal viruses such as herpesviruses, share similar assembly pathways, as follows1, 2, 3, 4. Infection of the host cell leads to the synthesis of proteins that assemble into “procapsid” shells. Concurrently, viral DNA is replicated producing numerous copies of the viral genome. An ATPase and viral DNA complex assemble at the procapsid portal, a ring-shaped structure situated at a unique vertex of the icosahedral procapsid, to complete the packaging motor. DNA translocation through the portal into the procapsid interior is then powered by ATP hydrolysis, packaging a single genome to near crystalline density4, 5. After packaging is complete the enzyme complex dissociates and “finishing” proteins, such as tail proteins in the case of bacteriophages, bind to complete the assembly of the infectious virus.
We recently developed a method to directly measure the packaging of single DNA molecules into single bacteriophage _ϕ_29 procapsids using optical tweezers6, 7. We found that the _ϕ_29 packaging motor translocates DNA processively at rates up to 165 bp/s, exerting forces of at least 80 pN, and that this high force generation is required to overcome large forces resisting dense DNA confinement in the procapsid. Whether these features are universal to other viruses has remained unclear, but the dsDNA viral packaging motors constitute a genetically interrelated family that are members of the broader FtsK-HerA super-family of ATPases4, 8. In this study, we present the first optical tweezers measurements of single DNA molecule packaging in bacteriophage λ, an important model system in molecular biology for over half a century, and one that exhibits several differences from bacteriophage _ϕ_291, 5.
λ is an E. coli virus with a 62 nm diameter icosahedral capsid containing a 48.5 kbp genome, 2.5× longer than that of _ϕ_29. DNA packaging is driven by the λ terminase complex, a hetero-oligomer composed of the viral gene products gpA (the 73.3 kDa large terminase subunit) and gpNu1 (the 20.4 kDa small terminase subunit)5. The gpA subunit possesses ATPase and DNA packaging activities required to translocate DNA into the procapsid interior. The gpNu1 subunit has site-specific DNA binding activity and mediates assembly of terminase at a specific packaging initiation site (the cos site)5. Unlike _ϕ_29, there is no evidence for an RNA component in the λ terminase motor complex9.
In contrast to _ϕ_29, which packages a monomeric genome capped by terminal proteins10, λ terminase excises a unit length genome from a concatameric (immature) DNA precursor substrate produced by rolling circle replication3. In this regard, λ follows a similar assembly pathway as herpesviruses, while _ϕ_29 is similar to adenoviruses. Excision of a single genome from the concatemer (DNA “maturation”) is mediated by the gpA subunit of λ terminase, which possesses site-specific endonuclease and strand separation catalytic activities. Recent biochemical studies suggest that gpA and gpNu1 proteins assemble into a stable gpA1/gpNu12 heterotrimer and these trimers further assemble into a homogeneous tetrameric ring of sufficient size to encircle dsDNA11. Presumably, the terminase ring is assembled at a cos site in the immature DNA concatemer, matures the genome end, binds to the portal ring in a procapsid to complete the packaging motor complex, and then translocates DNA into the procapsid interior.
The λ procapsid, like that of many other viruses (but not including _ϕ_29) also undergoes a significant procapsid expansion during packaging that roughly doubles its internal volume2, 5, 12. Electron microscopy studies indicate that procapsid expansion occurs during packaging with somewhere between 10-50% of the full genome length packaged2, 5, 12. At some point after expansion, 420 copies of an accessory capsid protein, gpD, bind to the procapsid exterior13, 14; the presumed role of gpD is to stabilize the expanded capsid structure and prevent DNA release2, 5, 15.
Here we present single-molecule studies of λ packaging dynamics and compare our results with those obtained previously with bacteriophage _ϕ_29. We find similarly high force generation but also find many differences including substantially higher translocation rates, higher processivity, different motor pausing behavior, and lower internal force buildup. In addition, we find evidence for an effect of procapsid expansion on the packaging dynamics and evidence that immature procapsids (which lack gpD) can rupture at high filling, allowing translocation of substantially greater than 100% of the native genome length.
Results and Discussion
Initiation of single DNA molecule packaging
We developed a procedure in which packaging of single DNA molecules into single λ procapsids was triggered by manipulation with dual optical tweezers (Methods). First, in a bulk reaction, we tethered biotinylated λ DNA fragments containing a cos packaging initiation site to streptavidin-coated microspheres. We then assembled the terminase complex onto the DNA by adding an extract containing recombinant gpA and gpNu1 proteins, which form a stable packaging intermediate referred to as Complex I5, 11, 16, 17. We attached empty λ procapsids to separate microspheres coated with anti-λ procapsid antibodies.
Packaging was initiated as shown schematically in Fig. 1A. Two optical traps were created in a thin chamber filled with the packaging buffer containing ATP. Microspheres carrying DNA-terminase complexes were injected into the chamber via a small capillary tube and caught in one trap. Microspheres carrying procapsids were injected via a second capillary and captured in the second trap. One trap was moved with respect to the other by deflecting one laser beam with a computer-controlled acousto-optic deflector, and packaging was initiated by bringing the two microspheres into proximity for ~3 seconds and then quickly separating them. Binding of the DNA-terminase complex to the procapsid was detected by measuring an increase in tensioning force as the DNA was stretched taut between the two microspheres18.
Fig. 1.
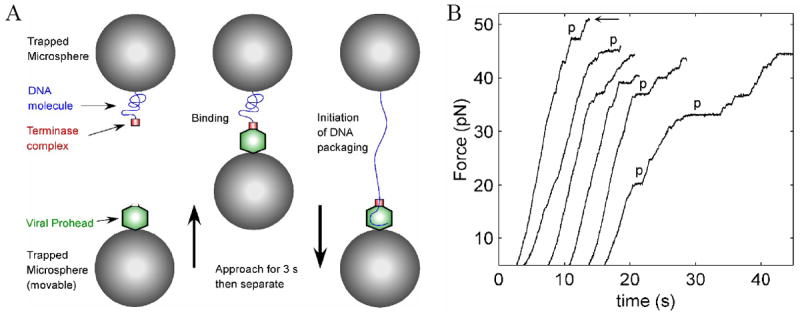
(A) Schematic illustration of the experiment. λ proheads were attached to antibody-coated microspheres and captured in an optical trap (bottom left). A microsphere carrying the DNA-terminase complexes was captured in a second optical trap (top left). The bottom trap was moved with respect to the top trap while monitoring the force acting on the top microsphere. To initiate DNA packaging, the microspheres were brought into near contact for ~3 s (middle) and then quickly separated to probe for DNA binding and translocation (right). (B) Force generated by individual motors measured with fixed trap positions. The recordings start at 5 pN and the force opposing the motor increases as packaging proceeds and the tension in the DNA rises. Individual recordings have been arbitrarily offset along the time axis for display purposes. Several examples of pauses of the motor, as discussed in the text, are marked by “p”. The arrow denotes the highest force measured (51 pN).
We found that procapsids could bind to the DNA-terminase complex within a few seconds after they were brought into close proximity. The tethered DNA was stretched until the tension reached ~3-7 pN, and we then fixed the separation between the traps. Translocation of the DNA by the motor was detected as a rise in the measured force due to the progressive shortening of the DNA tether, as shown in Fig. 1B. Active translocation was typically detected immediately after observation of the DNA tether formation, thus showing that packaging can also initiate very rapidly. No translocation was observed in the absence of ATP (data not shown).
The λ DNA packaging motor generates high forces
To ascertain the effects of an applied force on the motor, the traps were held fixed and the tension was allowed to rise as the motor reeled in the DNA (Fig. 1B, Methods). These measurements were made with <20% of the native λ genome length packaged, where the internal forces resisting DNA confinement are expected to be small19, 20, 21, 22, 23, 24, 25. Under these conditions, the entire load on the motor is due to the externally applied force. Such force recordings were made on N=92 complexes, with representative examples shown in Figure 1A. The maximum force detected was 51 pN (Fig. 1B, marked by arrow), which shows that the λ motor is capable of generating very large forces, of the same order as those generated by the _ϕ_29 motor7, and at least 15× higher than that generated by skeletal muscle myosin motors26. We note that each of these measurements ended with the tether breaking at some maximum force or with a long un-recovered pause for >60 s, whereupon recording was stopped. The breakage of the tether could correspond to detachment of the DNA from the terminase-procapsid complex, unbinding of the DNA-terminase complex from the procapsid, or detachment of the procapsid from the antibody-coated microsphere; however, based on previous measurements of bond strengths of several different antibody-antigen pairs (which typically break within seconds under a 50-60 pN load) 27, 28, 29, we suspect that the procapsid is detaching from the microsphere. Therefore, these measurements put a lower bound on the force-generating capability of the motor.
Many pauses in DNA translocation were clearly evident as plateaus in the force versus time plots (see Figure 1B). The frequency of pausing increased strongly with increasing force (Fig. 2A), but duration of the pauses did not (Fig. 2B). Notably, the pausing at high forces (>10 pN) was much more frequent than observed in studies of _ϕ_29 packaging, suggesting that there may be differences in the operation of the two motors. At 40 pN, the _ϕ_29 motor paused only once every ten seconds on average, whereas the λ motor paused once every 1.4 seconds.
Fig. 2.
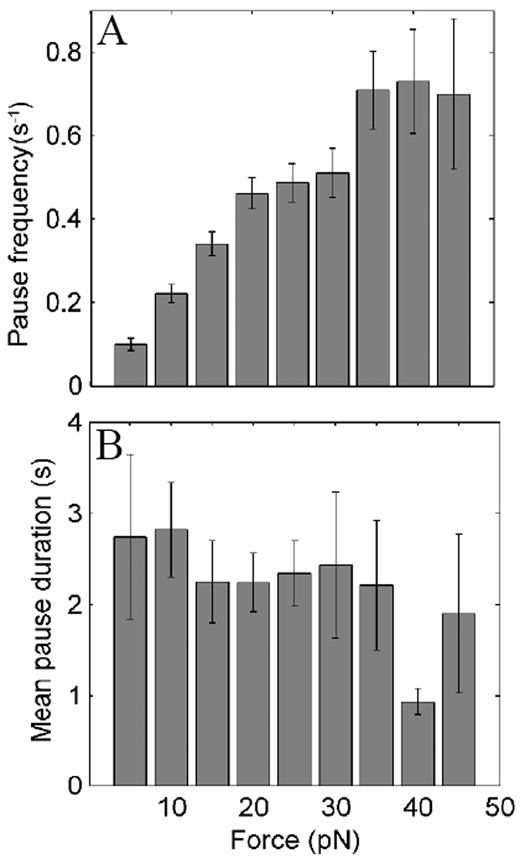
(A) Dependence of pausing frequency on applied force. Frequency was calculated as the number of pauses per second that were recorded in particular force ranges. (B) Dependence of pause duration on applied force.
The free-energy release associated with ATP hydrolysis may be calculated as ΔG = ΔG0 + RT ln([ADP][Pi]/[ATP]) ≅ -80 kJ/mol, where ΔG0 ≅ -30 kJ/mol is the standard free energy change, R the gas constant, T the temperature, and [ATP], [ADP], and [Pi] the concentrations of ATP, ADP and Pi in the reaction mixture (Methods)30. Expressed in energy units of force times displacement per ATP molecule, 80 kJ/mol ≅ 130 pN·nm/molecule. Therefore, our finding that the λ motor can translocate the DNA against a force >50 pN implies that the length of DNA translocated per ATP hydrolyzed (ΔL) must be less than 8 bp since the work done (FΔL) must be <130 pN·nm (i.e., ΔL < 130 pN·nm/50 pN = 2.6 nm ≅ 8 bp of B-form duplex DNA (0.34 nm/bp)).
Motor velocity versus applied load
The force vs. time data was analyzed to determine the velocity vs. load, as described in Methods. We find that the average motor velocity decreases with increasing load (Fig. 3), indicating that one or more of the rate-limiting steps in the mechano-chemical cycle of the motor involves DNA translocation. Displacement against an opposing force requires mechanical work, which increases the height of the reaction energy barrier and slows the reaction rate31. Within a simple Kramer’s type model of thermal activation over a single reaction barrier against an opposing force, one expects the motor velocity to decrease as v = v0 exp[-FΔx/kT], where v0 is the rate under zero load, F the opposing force, Δx the translocation step, and kT the thermal energy31. However, this simple one-transition model does not fit our data very well, suggesting additional rate limiting steps in motor translocation. We therefore fit the data to a model containing two rate limiting steps, v = v01 exp[-FΔx1/kT] + v02 exp[-FΔx2/kT], which yields much better agreement with the data (Fig. 3). This analysis suggests that a fast transition with v01=615 bp/s and Δx1= 1 bp is rate limiting at low force, and a second, slower transition with v02= 190 bp/s and Δx2 ≅ 0 becomes rate limiting at high force. To the extent that this minimal model applies, the rate-limiting step at low force involves translocation of Δx1 ≅ 1 bp, which is well within our upper bound of 8 bp based on the energetic considerations described above. A second transition that does not involve significant translocation (Δx2 ≅ 0) appears to become rate limiting at high force. This second transition would thus correspond to a purely biochemical transition, as opposed to a mechanical one. For example, if DNA translocation occurs during Pi release, as postulated for the _ϕ_29 motor32, our data suggests that another step not producing translocation, such as ATP binding or hydrolysis, becomes rate limiting at high force.
Fig. 3.
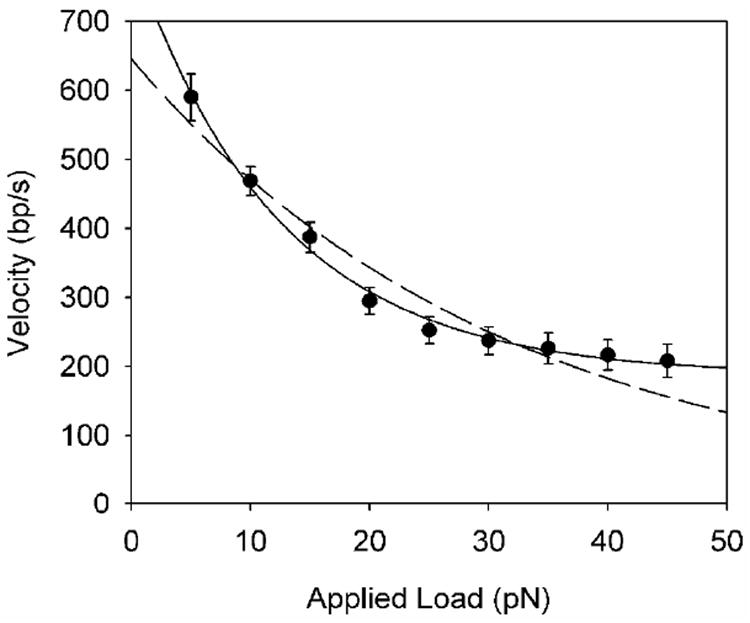
Average motor velocity versus applied load force. The dashed line is a fit to a single decaying exponential and the solid line is a fit to a sum of two decaying exponentials, as described in the text.
By multiplying the average force by the average motor velocity at that force, one may calculate the average power generated by the motor. The maximum power generation was observed with an applied load of 45 pN, where the motor velocity was 208 bp/s (Fig. 3), yielding an average power of 9400 pN·bp/s ≅ 3200 pN·nm/s. Given a free-energy release of 130 pN·nm per ATP (see above), this power figure (rate of energy consumption) implies an ATP hydrolysis rate of at least 3200 pN·nm/s ÷ 130 pN·nm per ATP ≅ 25 ATP/s. On the other hand, if each step of the motor is tightly coupled hydrolysis of one ATP and the step size is independent of load, our upper bound of 8 bp on the step size and measured average velocity of 590 bp/s (at 5 pN load) would imply an even higher bound on the ATP hydrolysis rate of at least 590 bp/s ÷ 8 bp/ATP = 74 ATP/s. In either case, these figures are notably higher than the value of ~10 ATP/s previously estimated in bulk packaging assays33. Our finding of a higher rate may be due to inaccuracies in the bulk assay measurements due to difficulties in accounting for a fraction of inactive complexes and background rate of futile hydrolysis. An advantage of the present single-molecule technique is that it measures only active complexes.
We can estimate the efficiency of the motor (i.e., the efficiency of chemical-to-mechanical energy conversion) from the ratio of the measured power PM to the power available from ATP hydrolysis PA. At 45 pN, PM = 3200 pN·nm/s and PA = ΔGATP·V/d, where ΔGATP = 130 pN·nm as described on p. 8, V is the average motor velocity, and d is the step size. Taking a value of d = 1 bp, as suggested by our fitting of the velocity-load data to a simple kinetic model as described above, yields an efficiency of ~12% under these particular conditions. Our upper bound on the step size of 8 bp assumes a maximum efficiency of 100%.
Force clamp measurements and processivity of packaging
We tracked packaging over longer distances by using a force-clamp in which the separation between the two optical traps was varied under feedback control to maintain a small constant load of ~5 pN as the DNA was translocated6. The DNA tether length versus time (Fig. 4) was determined knowing the compliance of the traps and the measured force versus fractional extension relationship of the DNA. Three different DNA constructs of lengths 35, 52, and 75 kbp, were used (Methods). The latter two, which are longer than the native 48.5 kbp genome, were chosen in order to investigate the limiting behavior at high capsid fillings. More data was taken with the shorter length since we found that it was much easier to initiate packaging in the optical tweezers with this construct. In most cases the measurements ended before the full DNA length was translocated, due either to the tether breaking, as discussed above, or due to a long un-recovered pause (>60 s). Therefore, we repeated the experiment many times to obtain complexes reaching high packaging levels. Altogether, N=97 force-clamp datasets were recorded that reached at least 40% packaging (53 with the 35 kbp construct, 20 with the 52 kbp construct, and 24 with the 75 kbp construct).
Fig. 4.
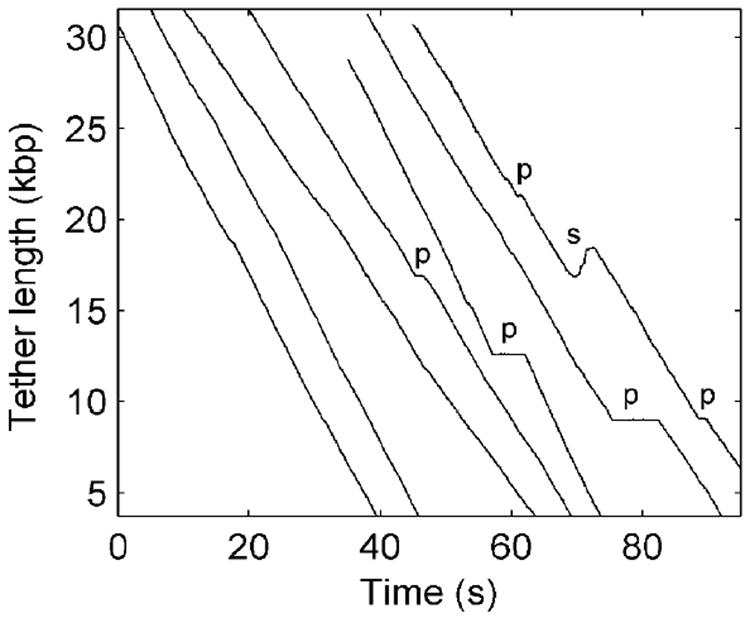
Packaging dynamics measured with a constant 5 pN load (force clamp). Each line is a plot of DNA tether length versus time recorded for an individual complex. Individual recordings have been arbitrarily offset along the time axis for display purposes. The plateaus seen in some records (marked “p”) indicate pauses of the motor. The section marked “s” in the far right record indicates a slip in which the motor temporarily lost grip on the DNA (see text).
Our measurements reveal that the λ motor is highly processive. Slips in which the tether length increased, indicating that the motor released its grip on the DNA, were very infrequent with only 42 observed in the 97 measured packaging events. An example of one of the largest slips is seen in Fig. 4 (marked “s”; several examples of pauses are marked “p”). The average slip length was 164 bp (standard deviation 172 bp), which is negligible compared with the 48.5 kbp genome length. The rate of movement of the DNA during slipping events ranged from ~50 bp/s to ~3 kbp/s (average 930 bp/s), the highest rate being similar to the measured rate of DNA ejection from lambda phage in similar ionic conditions34. On average, less than one slip occurred per genome length of DNA packaged, indicating ~3x higher processivity than observed in _ϕ_29 packaging7. Overall, pauses and slips had only a small affect on the average packaging rate, slowing it by ~10%.
Internal force buildup during packaging
The average packaging rate (motor velocity) versus length of DNA packaged in the force clamp measurements is plotted in Fig. 5A. The rate is constant during the first 20% of genome packaging, consistent with negligible internal force resisting DNA packaging in this low capsid filling regime, in accord with our findings with _ϕ_29 in the absence of Na+ and theoretical predictions6, 19, 21, 22, 23. The average rate of 580 bp/s (SD 120 bp/s) is approximately equal to that at 5 pN determined in our velocity vs. load measurements (Fig. 3).
Fig. 5.
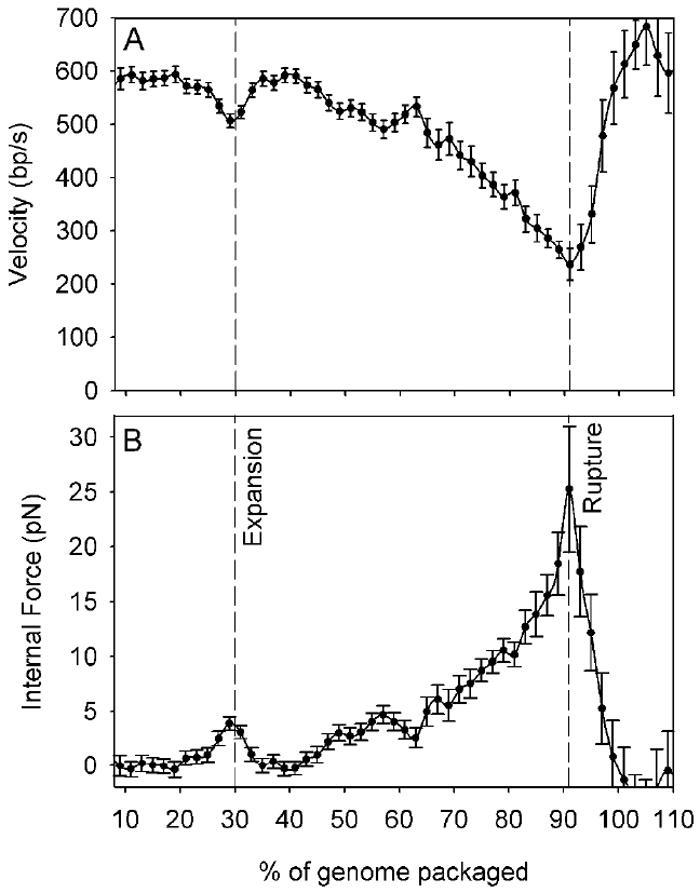
(A) Average packaging rate versus % of the native 48.5 kbp genome length packaged. The x-axis scale is the same as in panel B. Dashed lines indicate transition points, as discussed in the text. The average velocity was determined from N=97, 68, 21, 16, and 9 datasets that reached 40, 60, 80, 90, and 100% genome packaging, respectively. (B) Average internal force versus % of genome length packaged. Inset schematic diagrams indicate the various capsid transitions, as discussed in the text.
As the procapsid filled from 20% to 90% of the genome length the average packaging rate decreased from 580 bp/s to 240 bp/s. Since the motor velocity decreases with increasing load (Fig. 3), this decrease in velocity with capsid filling is indicative of a building internal force resisting DNA confinement in the procapsid, as found previously with bacteriophage _ϕ_296, 7. The internal force may be deduced by relating the velocity measured in the velocity vs. filling dataset (Fig. 5A) to the velocity measured in the velocity vs. force dataset (Fig. 3), to obtain force versus filling (Fig. 5B), as described in Methods. We find that the force rises steeply with filling during the latter half of genome packaging, as observed with _ϕ_296, 7 and predicted theoretically19, 21, 22, 23, 24, 25, and reaches 25 ± 6 pN with 90% of the genome length packaged. This force is notably two to three-fold lower than that measured for _ϕ_29 in a similar ionic condition6. However, it is in good agreement with the λ phage DNA ejection force measured by osmotic pressure experiments35, 36 and predicted by theoretical calculations23, 36. Specifically, an osmotic pressure of ~15 atm was found to be necessary to suppress DNA ejection from a λ mutant having a 41.5 kbp truncated genome36, corresponding to an ejection force of ~15 pN20. This capsid filling level corresponds to our 86% of wild-type genome packaged point, where we find a nearly identical internal force resisting packaging of 14 ± 2 pN. Taken together these experiments confirm the notion7, 19 that the internal force that builds during packaging is largely available to drive subsequent DNA ejection.
Procapsid expansion
An expansion of the λ procapsid that roughly doubles its internal volume has been shown by electron microscopy studies to occur during packaging with somewhere between 10% and 50% of the genome packaged2, 5, 37, 38. In our measurements, a significant dip (decrease then increase) in the packaging rate was observed at ~30% packaging (Fig. 5A), and our interpretation of this feature is that it is due to the procapsid expansion. As shown in Fig. 5B, this dip corresponds to a 4 pN increase then decrease in the internal force. Our interpretation is that internal force builds in the unexpanded procapsid and triggers expansion, which subsequently reduces the internal force due to a reduction in DNA confinement. No dips in packaging rate were seen with bacteriophage _ϕ_29, which does not undergo expansion during packaging6. This feature is not attributable to scaffold proteins as they are no longer present when packaging starts5. While a dip at 30% is clearly evident in the average rate, we note that not all individual datasets show this dip. It is clearly evident in 38 of the 97 datasets (several examples are shown in Fig. 6). We also note that the size of the dip in individual datasets is variable, ranging from ~10-60%. These findings suggest that individual procapsids may expand at different internal force and filling levels, that the force is sometimes smaller than we can measure. It has also been suggested that thermal fluctuations may also play an important role in triggering expansion of viral procapsids39. In addition, other effects besides the direct effect of internal force, such as formation of a critical number of contacts between the DNA and inner walls of the procapsid, may also play an important role in the process40.
Fig. 6.
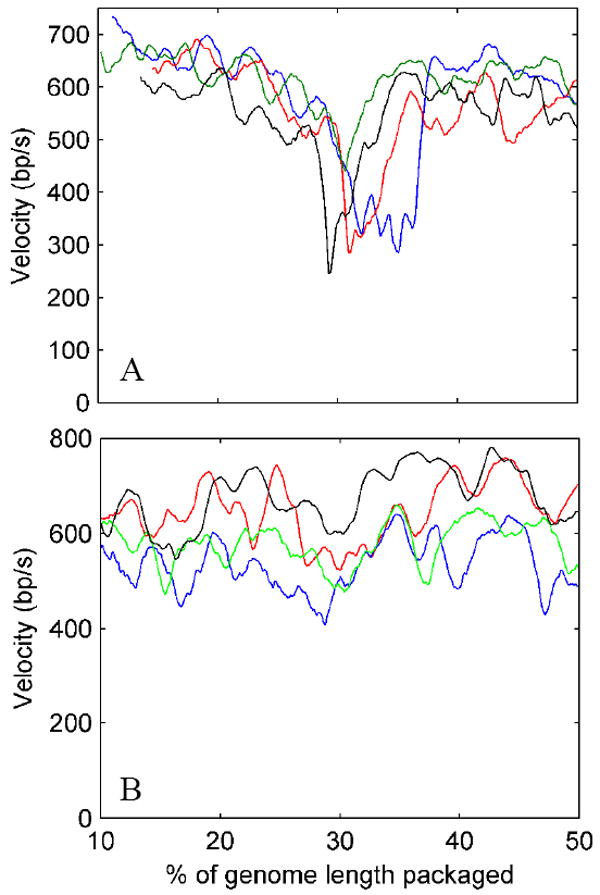
(A) Examples of records showing a dip in the packaging rate in the vicinity of 30% packaging. (B) Examples of other records without a clearly resolved dip at that position. The two plots share the same x-axis scale.
Rupture of the immature procapsid
In the force-clamp measurements with the 52 kbp and 75 kbp constructs we recorded 18 datasets in which packaging reached >90% and significant slowing of the packaging rate was observed in every case (Fig. 5A). In nine datasets, greater than 100% of the genome length was translocated, and a striking feature was seen in all of these records: After slowing dramatically, the motor abruptly accelerated to full speed, and this event occurred at a distinct point between 90 and 100% packaging (Fig. 7A&B). It is clear that the complex remains tethered between the microspheres following this event because the DNA remains stretched under a measured force of 5 pN. The rapid DNA translocation by the motor then continued up to ~105-146% of the genome length, which is significantly more than expected for the assembly of a viable phage5. Our interpretation of these events is that the building internal force at 90-100% of genome packaging causes rupture of the expanded procapsid, which releases the confined DNA and relieves the opposing load on the motor. We believe that such rupture occurs in our assay because the accessory capsid protein gpD is not present in the reaction mixture.
Fig. 7.
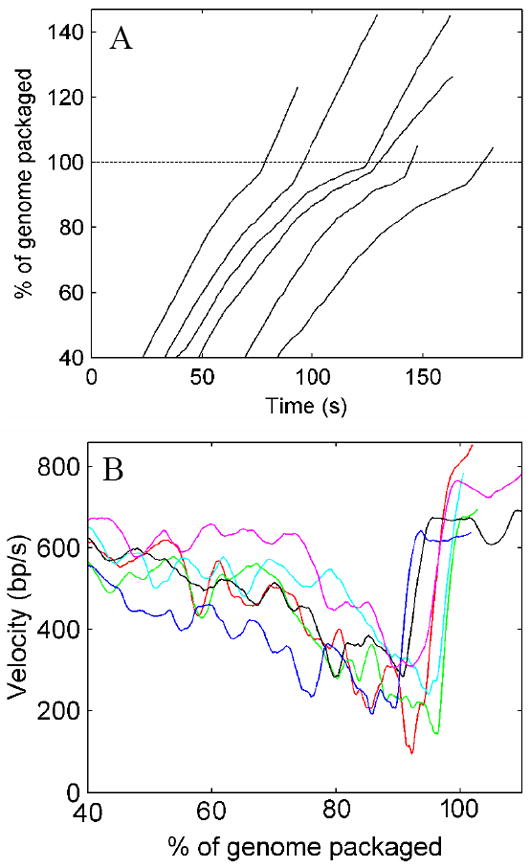
Examples of packaging measurements with a DNA construct that translocated beyond the native genome length. These datasets were recorded in force-clamp mode with a constant load of 5 pN. (A) % of genome length packaged versus time. Plots for six different complexes have been displaced arbitrarily along the time axis for clarity. (B) Velocity versus % of genome length packaged calculated in a 5 s sliding window. Plots for the six different complexes are shown in different colors.
A number of studies have examined the role of gpD, both in vivo and in vitro; the latter studies were based on assay systems that utilized complementing extracts of virus-infected cells41, 42, 43. More recently, bulk studies using purified components have demonstrated that the assembly of infectious λ virus is reduced to 2% of maximum when gpD is omitted from the reaction mixture44. All of these authors concluded that gpD binds to the DNA-filled capsid, stabilizing the expanded structure to prevent DNA release. The gpD requirement is abrogated when shortened genomes are used in the packaging reaction, presumably because the packaged DNA does not create excessive internal pressure41.
Further investigation of the role of gpD in DNA packaging, utilizing purified terminase to package mature lambda DNA into purified procapsids, is underway in the Catalano lab (Yang and Catalano, manuscript in preparation). Preliminary results indicate that while gpD is fully dispensable when DNA lengths <40 kb are packaged, it is required to efficiently package the last ~15% of the genome. In the absence of gpD, attempted packaging of this last bit of DNA (the full genome) renders the entire duplex accessible to DNase, presumably due to deterioration of the capsid integrity; electron microscopy studies are underway to further confirm this hypothesis Therefore, the available bulk data are consistent with our single molecule studies showing that in the absence of gpD, (i) most packaging complexes do not reach >90% and (ii) the small fraction that do progress beyond 90% (~40 kb) appear to rupture the capsid.
Our present findings show that the tightly packaged DNA generates high internal forces and provide evidence that loss of DNA can occur via rupture of the procapsid with >90% of the genome packaged in the absence of gpD. These findings thus strongly support the hypothesis that gpD stabilizes the expanded procapsid. Our results further suggest an assembly sequence in which gpD binds during packaging, at a point between procapsid expansion and completion of packaging, to foster packaging of the full-length λ genome.
Time required to package the λ genome
From our measurements of the average packaging rate (v) versus length of DNA packaged (L) we may estimate the time required to package the native 48.5 kbp λ genome. Specifically, we may numerically integrate (1/v) from L = 0 to 48.5 kbp. For the purpose of this calculation we chose to omit the sudden acceleration above 90% packaging, where the procapsids appear to rupture in the absence of gpD, and instead extrapolated the decreasing velocity trend from 90% to 100% packaging. We find that it would take 120 seconds (2 minutes) on average to package the λ genome. This figure is consistent with previous measurements for packaging in vivo and in vitro (as determined in bulk assays) of 2-3 minutes5, 12, 33, 45.
Conclusions
We have used optical tweezers to measure single DNA molecule packaging dynamics in bacteriophage λ. We have demonstrated that initiation of packaging can occur within a few seconds when DNA-terminase complexes and procapsids are brought into proximity. We also show that the λ terminase motor generates very high forces and must work against substantial internal forces resisting DNA confinement. The initial rate of DNA translocation is quite high, averaging ~600 bp/s. By characterizing the dependence of the motor velocity on load and capsid filling we deduced that a significant internal force builds inside the procapsid, approximately equal to the measured force driving phage λ DNA ejection. A dip in the packaging rate at ~30% packaging suggests that the procapsid tends to undergo expansion at this point following an early build-up of internal force. Sudden acceleration in the packaging rate was often observed proceeding beyond 90-100% packaging, indicating that internal force can rupture the immature procapsids, which lack the gpD stabilizing protein. Future work will aim to study packaging with pre-expanded procapsids and to examine the effect of added gpD. λ has been a rich model system for studying principles of viral assembly for many decades, and the biochemistry of this system is under continuing investigation by several research groups. We expect that the methods and findings presented here will open many new avenues for future investigations.
Materials and Methods
DNA constructs
The 35 kbp DNA construct was prepared from full-length lambda DNA (New England Biolabs). We first ligated the DNA using T4 ligase to reform the entire cos site at an internal position. This DNA was then digested with Nhe I, which cuts 34.7 kbp from the left end cos site. The 5’ overhangs produced by this digestion were biotinylated by using the Klenow fragment of DNA polymerase I to fill-in with biotin-14-dCTP (Intvitrogen). When this construct is treated with the terminase proteins, they cleave the DNA resulting in a 34.7 kbp DNA-terminase complex (complex I), and a 13.8 kbp cleavage fragment. The 52 kbp and the 75 kbp DNA constructs were prepared from the BAC clone CTD-2342K16 and purified as described previously46. The 75 kbp construct was produced by digesting the BAC clone with restriction endonuclease BspEI producing a 5’ overhang 74,587 bp upstream of a left end lambda cos site (present in the pBeloBAC11 BAC cloning vector). The overhang was then biotinylated as described above. The 52 kbp construct was produced by digesting the BAC clone with restriction endonuclease BsiWI producing a 5’ overhang 52,095 bp upstream of a left end lambda cos site, and this overhang was subsequently biotinylated as described above.
Purification of lambda procapsids
Lambda procapsids were expressed in the E. coli lambda lysogen NS428 [N100 (λ _A_am11 _b_2_red_3 _cI_ts857 _S_am7)]47. The amber mutation in gene A (the large subunit of λ terminase) prevents DNA packaging and procapsids thus accumulate after induction. Briefly, the lambda lysogen was grown overnight at 32°C in LB broth, diluted 100x in LB broth and grown at 32°C until OD600 = 0.3 was achieved. The culture was then shifted to 45°C for 15 min to induce the lysogen and the incubation continued for an additional 60 minutes at 38°C. The cells were harvested by centrifugation and then re-suspended in one-hundredth volume lysis buffer [12.5 mM Tris-HCl, pH 7.8, 2.5 mM MgCl2, 25 mM NaCl, 0.75X Bugbuster (Novagen) and 40 units RNase-free DNase (Roche)]; lysis was monitored by light microscopy. The lysate was clarified in a SS34 rotor at 10,000 rpm for 10 min, followed by an additional clarification in a microfuge at 13,000 rpm for 3 min. The procapsids in the supernatant were isolated by sucrose density centrifugation in a linear 10-30% (w/v) sucrose gradient in 0.5X TMS buffer (25 mM Tris, pH 7.8, 5 mM MgCl2, 50 mM NaCl) in a SW55 rotor at 35,000 rpm for 75 min at 4°C. The procapsid-containing band was collected, the procapsids diluted four-fold in 0.5X TMS buffer and harvested in the SW55 rotor at 35,000 rpm for 2 hr. The pellet fraction was overlaid with 200 μl 0.5X TMS buffer at 4°C overnight to resuspend the procapsids, which were further purified by a second round of sucrose gradients, as described above.
Production of terminase
Terminase was expressed from E. coli AZ1935(pCM101), which contains the lambda terminase genes A and Nu148. The cells were grown and induced as described for procapsid expression above, and the post-induction temperature was 40°C. Fifteen minutes post-induction, the cells were harvested, taken into one-hundredth volume TM buffer (25mM Tris-HCl, pH 7.6, 5mM MgCl2 with 10 mM DTT) and lysed by sonication. The lysate was clarified by centrifugation for 10 min at 13,000 rpm in the microfuge at 4°C, and the supernatant mixed with an equal volume of cold glycerol and stored at -20°C.
Initiation of packaging
Anti-λ procapsid antibodies were attached to the protein G microspheres (2.1 μm diam, Spherotech) as described previously 7. Streptavidin-coated microspheres (2.1 μm diameter, Spherotech) were washed twice in the packaging buffer (20 mM Tris-HCl (pH 8) with 10 mM MgCl2, 7 mM β-mercaptoethanol, 1 mM ATP, 1 μM ADP, and 1 μM Pi). 10 μl of washed microspheres were incubated with 2 μl of 200 μg/ml DNA in the same buffer for 20 minutes. 2 μl of terminase extract was then added to the mix and incubated for >20 minutes at room temperature before use in the experiments. ~3 μl of each microsphere solution was diluted in 0.5 ml of packaging buffer prior to injection into the sample chamber. These conditions resulted in packaging events being recorded only once per several pairs of microspheres tested, such that we were usually tethering only one DNA molecule at a time. Further, when the tether broke at the end of each measurement (or was broken intentionally following long pauses when packaging didn’t resume after 60 s) we verified that the force dropped to zero in a single step, to show that we had only one DNA tethered.
Optical tweezers instrument
A dual optical trap system was used, consisting of a solid-state Nd:YAG laser (CrystaLaser) split into two orthogonally polarized beams focused by a water-immersion objective (Olympus, Plan Apochromat, 1.2 NA). One beam was steered by use of an acousto-optic deflector (Intraaction). The exiting beams were collected by an identical objective, and deflections of the fixed beam were detected by imaging the back focal plane of the objective onto a position-sensing detector (On-Trak). The signal was filtered by a 340 Hz low-pass RC filter and then digitized at 1 kHz by a 16-bit data acquisition card (National Instruments, 6035E). The instrument was calibrated as described previously18. The series compliance of the two optical traps was 10.3 nm/pN. Measurements were made at 23°C.
Force-extension measurements
The elasticity of DNA (fractional end-to-end extension vs. force) was measured in the packaging buffer by tethering a 25.3 kbp DNA construct, labeled at one end by biotin and the other end by digoxygenin, between a streptavidin-coated microsphere and anti-digoxygenin-coated microsphere as described previously29. These data were used to calculate the tether length from measurements of the extension at a given force. These measurements also served as negative control experiments, showing that no DNA translocation activity was measured in the absence of procapsids and terminase protein. Pauses during packaging were identified as sections of data in which the standard deviation in tether length was statistically indistinguishable (within 2 SD) from that measured in the control experiments.
Fixed trap separation measurements
The dependence of the motor velocity on load was determined by holding the trap separations fixed after detecting packaging, such that the DNA tension rose as packaging proceeded. The change in tether length was calculated from the measured force knowing the separation between the traps, compliances of the traps, and measured force vs. fractional extension relationship of the DNA, as described previously18. Long discernable pauses (velocity <20 bp/s for >0.2 s), were edited out of the length vs. time plots prior to analysis. Velocities were calculated by linear regressions of the length vs. time data in a 0.5 s sliding window. To obtain the average velocity vs. force the individual velocities from records spanning forces from at least 5 to 20 pN were averaged together in 5 pN force bins.
Force-clamp measurements
DNA binding was detected by measuring the force acting on one microsphere upon quickly separating the two traps. If the force reached 5 pN, a feedback algorithm was invoked to control the trap separation so as to maintain the force at 5 pN. The force was recorded at 1 kHz and if it was greater/less than the force set point the traps were moved closer/farther by 1 nm. The tether length was calculated knowing the separation between the traps, force, compliances of the traps, and measured force vs. fractional extension relationship, as described previously18. The motor velocity vs. length of DNA packaged was determined for each complex by linear regression of the length vs. time data in 1 kbp length bins. Clear pauses (velocity <20 bp/s for >0.2 s) and slips larger than 50 bp were edited out before determining the velocity. The overall ensemble average velocity vs. length of DNA packaged was calculated by averaging the velocities in each bin over all datasets. The average internal force vs. % of genome packaged was calculated by relating the average velocity measured in the velocity vs. packaging dataset to that measured in the velocity vs. force (F-v) dataset. The F-v data was well fit by the function F=a+(b/v)+(c/v2)+(d/v3), with constants _a_=-63, _b_=7.0e4, _c_=-2.2e7, and _d_=2.6e9. The forces corresponding to the velocities measured in the velocity vs. packaging dataset were calculated using this function and the 5 pN applied force was subtracted to obtain the contribution of internal force.
Acknowledgments
We thank Brandy Pappas, James Tsay, Jiao Xie, Mladen Nisavic, and Daniel Cohen for technical assistance and Dr. Paul Jardine for thoughtful comments and discussion. Our research was supported by NIH grant GM-071552, The Kinship Foundation, and the Arnold and Mabel Beckman Foundation. DF was also supported by NIH grant P01-DK54441 through the Molecular Biophysics Training Program at UCSD. CEC was supported by NIH grant GM-063943.
Footnotes
Publisher's Disclaimer: This is a PDF file of an unedited manuscript that has been accepted for publication. As a service to our customers we are providing this early version of the manuscript. The manuscript will undergo copyediting, typesetting, and review of the resulting proof before it is published in its final citable form. Please note that during the production process errors may be discovered which could affect the content, and all legal disclaimers that apply to the journal pertain.
References
- 1.Hendrix RW, Roberts JW, Stahl FW, Weisberg RA. Lambda II. Cold Spring Harbor Laboratory; Cold Spring Harbor, N.Y: 1983. [Google Scholar]
- 2.Murialdo H. Bacteriophage lambda DNA maturation and packaging. Ann Rev Biochem. 1991;60:125–153. doi: 10.1146/annurev.bi.60.070191.001013. [DOI] [PubMed] [Google Scholar]
- 3.Catalano CE. Viral Genome Packaging Machines: An Overview. In: Catalano CE, editor. Viral Genome Packaging Machines: Genetics, Structure, and Mechanism. Landes Bioscience; Georgetown, TX: 2005. pp. 1–4. [Google Scholar]
- 4.Jardine PJ, Anderson D. DNA packaging in double-stranded DNA bacteriophages. In: Calendar R, editor. The Bacteriophages. Oxford Press; 2006. pp. 49–65. [Google Scholar]
- 5.Feiss M, Catalano CE. Bacteriophage Lambda Terminase and the Mechanisms of Viral DNA Packaging. In: Catalano CE, editor. Viral Genome Packaging Machines: Genetics, Structure, and Mechanism. Landes Bioscience; Georgetown, TX: 2005. pp. 5–39. [Google Scholar]
- 6.Fuller DN, Rickgauer JP, Grimes S, Jardine PJ, Anderson DL, Smith DE. Ionic effects on viral DNA packaging and portal motor function in bacteriophage phi29. Proc Nat Acad Sci USA. 2007;104:11245–11250. doi: 10.1073/pnas.0701323104. [DOI] [PMC free article] [PubMed] [Google Scholar]
- 7.Smith DE, Tans SJ, Smith SB, Grimes S, Anderson DL, Bustamante C. The bacteriophage ϕ29 portal motor can package DNA against a large internal force. Nature. 2001;413:748–52. doi: 10.1038/35099581. [DOI] [PubMed] [Google Scholar]
- 8.Iyer LM, Makarova KS, Koonin EV, Aravind L. Comparative genomics of the FtsK-HerA superfamily of pumping ATPases: implications for the origins of chromosome segregation, cell division and viral capsid packaging. Nucleic Acids Res. 2004;32:5260–79. doi: 10.1093/nar/gkh828. [DOI] [PMC free article] [PubMed] [Google Scholar]
- 9.Grimes S, Jardine PJ, Anderson D. Bacteriophage phi 29 DNA packaging. Adv Virus Res. 2002;58:255–94. doi: 10.1016/s0065-3527(02)58007-6. [DOI] [PubMed] [Google Scholar]
- 10.Meijer W, JA H, Salas M. Phi29 family of phages. Microbiol Mol Biol Rev. 2001;65:261–87. doi: 10.1128/MMBR.65.2.261-287.2001. [DOI] [PMC free article] [PubMed] [Google Scholar]
- 11.Maluf NK, Gaussier H, Bogner E, Feiss M, Catalano CE. Assembly of Bacteriophage Lambda Terminase into a Viral DNA Maturation and Packaging Machine. Biochemistry. 2006;45:15259–15268. doi: 10.1021/bi0615036. [DOI] [PubMed] [Google Scholar]
- 12.Hohn B. DNA as substrate for packaging into bacteriophage lambda, in vitro. J Mol Biol. 1975;98:93–106. doi: 10.1016/s0022-2836(75)80103-3. [DOI] [PubMed] [Google Scholar]
- 13.Casjens SR, Hendrix RW. Locations and amounts of major structural proteins in bacteriophage lambda. J Mol Biol. 1974;88:535–45. doi: 10.1016/0022-2836(74)90500-2. [DOI] [PubMed] [Google Scholar]
- 14.Hohn T, Flick H, Hohn B. Petit gamma, a family of particles from coliphage lambda. J Mol Biol. 1975;98:107–120. doi: 10.1016/s0022-2836(75)80104-5. [DOI] [PubMed] [Google Scholar]
- 15.Hohn T, Wurtz M, Hohn B. Capsid Transformation During Packaging of Bacteriophage lambda DNA. Phil Trans Roy Soc London B. 1976;276:51–61. doi: 10.1098/rstb.1976.0097. [DOI] [PubMed] [Google Scholar]
- 16.Becker A, Marko M, Gold M. Early events in the in vitro packaging of bacteriophage lambda DNA. Virology. 1977;78:291–305. doi: 10.1016/0042-6822(77)90100-3. [DOI] [PubMed] [Google Scholar]
- 17.Yang Q, Hanagan A, Catalano CE. Assembly of a nucleoprotein complex required for DNA packaging by bacteriophage lambda. Biochemistry. 1997;36:2744–52. doi: 10.1021/bi9622682. [DOI] [PubMed] [Google Scholar]
- 18.Rickgauer JP, Fuller DN, Smith DE. DNA as a metrology standard for length and force measurements with optical tweezers. Biophys J. 2006;91:4253–4257. doi: 10.1529/biophysj.106.089524. [DOI] [PMC free article] [PubMed] [Google Scholar]
- 19.Kindt J, Tzlil S, Ben-Shaul A, Gelbart WM. DNA packaging and ejection forces in bacteriophage. Proc Natl Acad Sci USA. 2001;98:13671–4. doi: 10.1073/pnas.241486298. [DOI] [PMC free article] [PubMed] [Google Scholar]
- 20.Evilevitch A, Castelnovo M, Knobler CM, Gelbart WM. Measuring the force ejecting DNA from phage. J Phys Chem B. 2004;108:6838–6843. [Google Scholar]
- 21.Tzlil S, Kindt JT, Gelbart WM, Ben-Shaul A. Forces and pressures in DNA packaging and release from viral capsids. Biophys J. 2003;84:1616–27. doi: 10.1016/S0006-3495(03)74971-6. [DOI] [PMC free article] [PubMed] [Google Scholar]
- 22.Purohit PK, Kondev J, Phillips R. Mechanics of DNA packaging in viruses. Proc Natl Acad Sci USA. 2003;100:3173–8. doi: 10.1073/pnas.0737893100. [DOI] [PMC free article] [PubMed] [Google Scholar]
- 23.Purohit PK, Inamdar MM, Grayson PD, Squires TM, Kondev J, Phillips R. Forces during bacteriophage DNA packaging and ejection. Biophys J. 2005;88:851–66. doi: 10.1529/biophysj.104.047134. [DOI] [PMC free article] [PubMed] [Google Scholar]
- 24.Petrov AS, Harvey SC. Structural and thermodynamic principles of viral packaging. Structure. 2007;15 doi: 10.1016/j.str.2006.11.013. [DOI] [PubMed] [Google Scholar]
- 25.Petrov AS, Harvey SC. Packaging of DNA by Bacteriophage Epsilon15: Structure, Forces, and Thermodynamics. Structure. 2007;15:807–812. doi: 10.1016/j.str.2007.05.005. [DOI] [PubMed] [Google Scholar]
- 26.Mehta AD, Rief M, Spudich JA, Smith DA, Simmons RM. Single-molecule biomechanics with optical methods. Science. 1999;283:1689–95. doi: 10.1126/science.283.5408.1689. [DOI] [PubMed] [Google Scholar]
- 27.Dammer U, Hegner M, Anselmetti D, Wagner P, Dreier M, Huber W, Güntherodt HJ. Specific antigen/antibody interactions measured by force microscopy. Biophys J. 1996;70:2437–41. doi: 10.1016/S0006-3495(96)79814-4. [DOI] [PMC free article] [PubMed] [Google Scholar]
- 28.Ros R, Schwesingerdagger F, Anselmetti D, Kubon M, Schäfer R, Plückthun A, Tiefenauer L. Antigen binding forces of individually addressed single-chain Fv antibody molecules. Proc Nat Acad Sci USA. 1998;95:7402–7405. doi: 10.1073/pnas.95.13.7402. [DOI] [PMC free article] [PubMed] [Google Scholar]
- 29.Fuller DN, Gemmen GJ, Rickgauer JP, Dupont A, Millin R, Recouvreux P, Smith DE. A general method for manipulating DNA sequences from any organism with optical tweezers. Nucleic Acids Res. 2006;34:e15. doi: 10.1093/nar/gnj016. [DOI] [PMC free article] [PubMed] [Google Scholar]
- 30.Lehninger AL, Nelson DL, Cox MM. Principles of Biochemistry. Worth, N.Y: 1993. [Google Scholar]
- 31.Keller D, Bustamante C. The Mechanochemistry of Molecular Motors. Biophys J. 2000;78:541–556. doi: 10.1016/S0006-3495(00)76615-X. [DOI] [PMC free article] [PubMed] [Google Scholar]
- 32.Chemla YR, Aathavan K, Michaelis J, Grimes S, Jardine PJ, Anderson DL, Bustamante C. Mechanism of force generation of a viral DNA packaging motor. Cell. 2005;122:683–92. doi: 10.1016/j.cell.2005.06.024. [DOI] [PubMed] [Google Scholar]
- 33.Yang Q, Catalano CE. Biochemical characterization of bacteriophage lambda genome packaging in vitro. Virology. 2003;305:276–87. doi: 10.1006/viro.2002.1602. [DOI] [PubMed] [Google Scholar]
- 34.Grayson P, Han L, Winther T, Phillips R. Proc Nat Acad Sci USA. 2007 doi: 10.1073/pnas.0703274104. in press. [DOI] [PMC free article] [PubMed] [Google Scholar]
- 35.Evilevitch A, Lavelle L, Knobler CM, Raspaud E, Gelbart WM. Osmotic pressure inhibition of DNA ejection from phage. Proc Natl Acad Sci USA. 2003;100:9292–5. doi: 10.1073/pnas.1233721100. [DOI] [PMC free article] [PubMed] [Google Scholar]
- 36.Grayson P, Evilevitch A, Inamdar MM, Purohit PK, Gelbart WM, Knobler CM, Phillips R. The effect of genome length on ejection forces in bacteriophage lambda. Virology. 2006;348:430–6. doi: 10.1016/j.virol.2006.01.003. [DOI] [PMC free article] [PubMed] [Google Scholar]
- 37.Hohn B. DNA sequences necessary for packaging of bacteriophage lambda DNA. Proc Nat Acad Sci USA. 1983;80:7456–7460. doi: 10.1073/pnas.80.24.7456. [DOI] [PMC free article] [PubMed] [Google Scholar]
- 38.Dokland T, Murialdo H. Structural transitions during maturation of bacteriophage lambda capsids. J Mol Biol. 1993;233:682–94. doi: 10.1006/jmbi.1993.1545. [DOI] [PubMed] [Google Scholar]
- 39.Lata R, Conway J, Cheng N, Duda R, Hendrix R, Wikoff W, Johnson J, Tsuruta H, Steven A. Maturation Dynamics of a Viral Capsid: Visualization of Transitional Intermediate States. Cell. 2000;100:253–263. doi: 10.1016/s0092-8674(00)81563-9. [DOI] [PubMed] [Google Scholar]
- 40.Conway JF, Wikoff WR, Cheng N, Duda RL, Hendrix RW, Johnson JE, Steven AC. Virus Maturation Involving Large Subunit Rotations and Local Refolding. Science. 2001;292:744–748. doi: 10.1126/science.1058069. [DOI] [PubMed] [Google Scholar]
- 41.Sternberg N, Weisberg R. Packaging of coliphage lambda DNA: II. The role of the gene D protein. J Mol Biol. 1977;117:733–759. doi: 10.1016/0022-2836(77)90067-5. [DOI] [PubMed] [Google Scholar]
- 42.Perucchetti R, Parris W, Becker A, Gold M. Late stages in bacteriophage lambda head morphogenesis: In vitro studies on the action of the bacteriophage lambda D-gene and W-gene products. Virology. 1988;165:103–14. doi: 10.1016/0042-6822(88)90663-0. [DOI] [PubMed] [Google Scholar]
- 43.Kaiser D, Syvanen M, Masuda T. Processing and assembly of the head of bacteriophage lambda. J Supramol Struct. 1974;2:318–328. doi: 10.1002/jss.400020221. [DOI] [PubMed] [Google Scholar]
- 44.Gaussier H, Yang Q, Catalano CE. Building a virus from scratch: assembly of an infectious virus using purified components in a rigorously defined biochemical assay system. Journal of molecular biology. 2006;357:1154–66. doi: 10.1016/j.jmb.2006.01.013. [DOI] [PubMed] [Google Scholar]
- 45.Hwang Y, Feiss M. A defined system for in vitro lambda DNA packaging. Virology. 1995;211:367–76. doi: 10.1006/viro.1995.1419. [DOI] [PubMed] [Google Scholar]
- 46.Laib S, Robertson RM, Smith DE. Preparation and Characterization of a Set of Linear DNA Molecules for Polymer Physics and Rheology Studies. Macromolecules. 2006;39:4115–4119. [Google Scholar]
- 47.Sternberg N, Tiemeier D, Enquist L. In vitro packaging of a lambda Dam vector containing EcoRI DNA fragments of Escherichia coli and phage P1. Gene. 1977;1:255–80. doi: 10.1016/0378-1119(77)90049-x. [DOI] [PubMed] [Google Scholar]
- 48.Chow S, Daub E, Murialdo H. The overproduction of DNA terminase of coliphage lambda. Gene. 1987;60:277–89. doi: 10.1016/0378-1119(87)90236-8. [DOI] [PubMed] [Google Scholar]