Characterization of resident and migratory dendritic cells in human lymph nodes (original) (raw)
Human skin-draining lymph nodes contain functionally distinct subsets of resident and migratory dendritic cells.
Abstract
Dendritic cells (DCs) initiate adaptive immune responses in lymph nodes (LNs). In mice, LN DCs can be divided into resident and tissue-derived populations, the latter of which migrate from the peripheral tissues. In humans, different subsets of DCs have been identified in the blood, spleen, and skin, but less is known about populations of resident and migratory tissue-derived DCs in LNs. We have analyzed DCs in human LNs and identified two populations of resident DCs that are present in all LNs analyzed, as well as in the spleen and tonsil, and correspond to the two known blood DC subtypes. We also identify three main populations of skin-derived migratory DCs that are present only in skin-draining LNs and correspond to the DC subsets found in the skin. Resident DCs subsets induce both Th1 and Th2 cytokines in naive allogeneic T lymphocytes, whereas the corresponding blood subsets failed to induce efficient Th2 polarization. LN-resident DCs also cross-present antigen without in vitro activation, whereas blood DCs fail to do so. Among migratory DCs, one subset was poor at both CD4+ and CD8+ T cell activation, whereas the other subsets induced only Th2 polarization. We conclude that in humans, skin-draining LNs host both resident and migratory DC subsets with distinct functional abilities.
DCs are a rare population of professional antigen-presenting cells. Numerous studies have shown that mouse DCs are heterogenous and comprise several subtypes with distinct phenotype and functional properties (Heath and Carbone, 2009). DCs can be divided into two main groups: conventional (cDCs) and plasmacytoid DCs (pDCs). In the steady-state, committed DC progenitors migrate from the bone marrow through the blood to lymphoid organs and peripheral tissues, where they give rise to distinct subsets of cDCs after a final differentiation stage in situ, with the exception of Langerhans cells (LCs), which are maintained in the epidermis independently of circulating precursors (Merad and Manz, 2009). Nonlymphoid organ DCs migrate continuously from peripheral tissues to the draining LNs, whereas lymphoid organ DCs reside there during their entire life span. In contrast, pDCs differentiate entirely in the bone marrow and then populate lymphoid organs (Randolph et al., 2008).
In humans, three different DC subsets have been identified in the blood (Dzionek et al., 2000), spleen (McIlroy et al., 2001), and tonsils (Lindstedt et al., 2005): pDCs and two subsets of myeloid DCs expressing BDCA1 or BDCA3. Recently, functional differences between blood BDCA1+ and BDCA3+ DC subsets have been reported (Bachem et al., 2010; Crozat et al., 2010; Jongbloed et al., 2010). However, how blood DCs relate to the ones present in LNs is poorly understood. In addition, three distinct DC subsets, LCs and dermal CD1a+ and CD14+ DCs, have also been found in the skin (Nestle et al., 1993) and have distinct functional properties (Klechevsky et al., 2008; Haniffa et al., 2009). LCs and CD1a+ DCs have been observed in skin-draining LNs (Angel et al., 2009; van de Ven et al., 2011), but whether all skin DC subsets can migrate to the LNs and what functional properties are conserved after migration remain unknown. To address these questions, we have analyzed the different subsets of DCs present in human LNs and compared them with DCs found in other lymphoid organs, in the skin and the blood.
RESULTS AND DISCUSSION
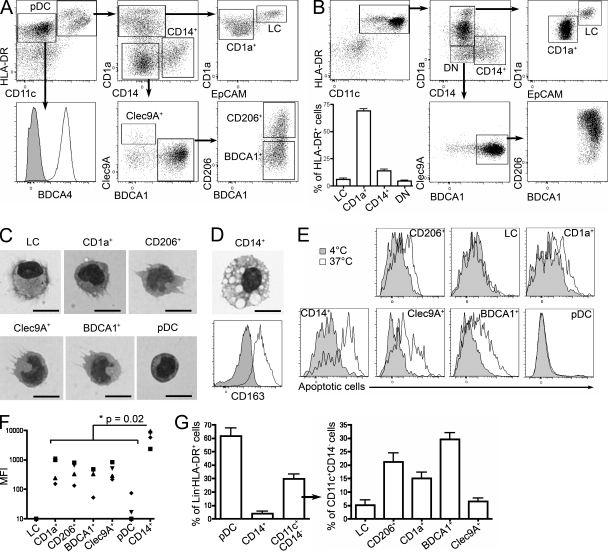
We characterized DC subsets in noninvaded axillary LNs from untreated breast cancer patients, using a combination of phenotypic markers found on skin and blood DCs (Fig. 1 A). HLA-DR+CD11c−BDCA4+ cells were identified as pDCs. HLA-DR+CD11c+ cells were separated into CD14+ and CD1a+ cells, which could be further divided into EpCAM+ LCs and CD1a+ DCs. CD1a−CD14− cells were further fractionated into Clec9A+ and BDCA1+ populations. Finally, BDCA1+ cells comprised two subsets expressing or not CD206. Morphological analysis confirmed the identification of BDCA4+ cells as pDCs and showed typical DC morphology for other subpopulations (Fig. 1 C), except for CD14+ cells (Fig. 1 D). The morphology of the CD14+ population was very homogenous and typical of macrophages, with the presence of numerous phagocytic vacuoles in virtually all the cells. Nevertheless, we cannot exclude the possibility that this CD14+ population also contains low numbers of DCs. These cells homogenously expressed CD163 (Fig. 1 D), a marker commonly found on macrophages. In an apoptotic cell capture assay (Fig. 1, E and F), CD14+ cells were the most potent for apoptotic cell uptake, consistent with their macrophage morphology. We conclude that human axillary LNs contain macrophages and six DC subsets, of which pDCs represent the most abundant and LCs and Clec9A+ DCs the rarest (Fig. 1 G).
Figure 1.
Identification of DC subsets in human axillary LNs. (A) Axillary LN cells were enriched for DCs and stained for HLA-DR, CD11c, CD1a, CD14, EpCAM, BDCA4, BDCA1, Clec9A, and CD206. pDC, CD14+, CD1a+, Clec9A+, CD206+, BDCA1+ cell subsets and LCs were gated as depicted. Representative results of 12 independent experiments are shown. (B) DCs were allowed to migrate out of skin explants for 48 h and stained for HLA-DR, CD11c, CD1a, CD14, EpCAM, BDCA1, Clec9A, and CD206. Representative results of five independent experiments are shown. The percentage of each population among HLA-DR+ cells and mean ± SD in five donors are shown. (C and D) Purified LN cell populations were submitted to cytospin and Giemsa/May-Grünwald staining. Representative images are shown of three to four independent experiments. (D) CD14+ LN cells were stained for CD163. Gray histograms represent control isotype staining. Representative results of five independent experiments are shown. Bars, 10 µm. (E and F) LN cells were incubated with fluorescently labeled apoptotic cells at 4°C or 37°C. (E) Representative results of four independent experiments are shown. (F) Quantification of capture was performed by subtracting the MFI value at 4°C from the MFI value at 37°C. (G) Percentage of each population among lineage (Lin)− HLA-DR+ cells and among Lin− HLA-DR+CD11c+CD14− cells. Mean ± SD in 18 donors is shown.
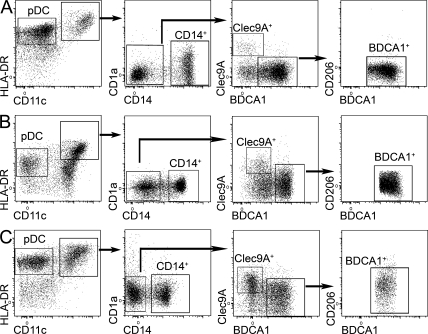
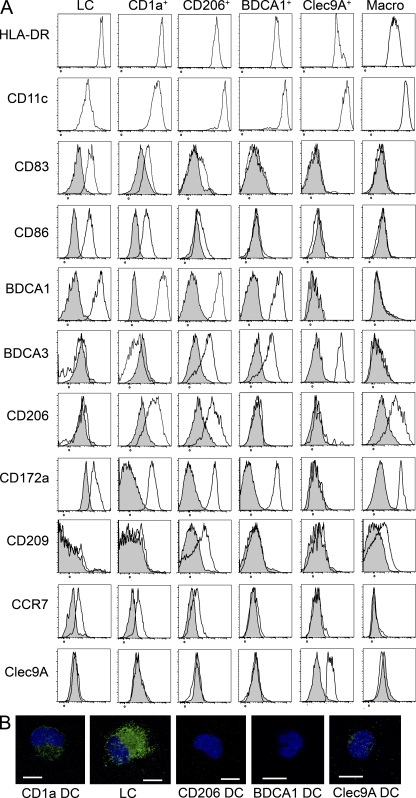
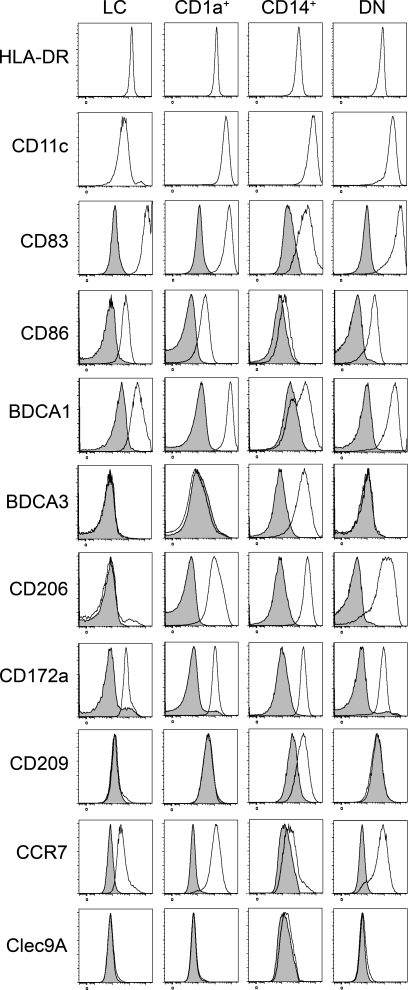
Similar analysis of lymphoid organs that do not drain the skin showed that three of these DC subsets (LCs and CD1a+ and CD206+ DCs) were absent from cervical LNs draining the oropharynx, iliac LNs, tonsils, and spleen (Fig. 2, A–C), suggesting that these DCs in skin-draining LNs had migrated from the skin. In the skin, we found LCs, CD1a+ DCs, and CD1a−CD14+ DCs, as well as a minor population of double-negative (DN) cells (Fig. 1 B), of which 95% were CD206+ (DN DCs were not clearly defined in most donors; not depicted). Although the presence of Langerin+ LC-like DCs has been reported in tonsil epithelium (Valladeau et al., 1999), we could not detect a population of CD1a+EpCAM+ DCs in our tonsil cell suspensions, in accordance with another study (Summers et al., 2001). In contrast, pDCs, Clec9A+ DCs, and BDCA1+ DCs were found in all lymphoid organs analyzed. LCs and CD1a+ DCs, and to a lesser extent CD206+ DCs, displayed an activated phenotype in LNs (CD83+ and CD86+ and high expression of HLA-DR; Fig. 3 A). This phenotype is reminiscent of that of mouse migratory DCs, which up-regulate the expression of co-stimulatory and MHC class II molecules during their migration to LNs (Villadangos and Heath, 2005). In addition, DCs that had migrated in vitro from skin explants also displayed an activated phenotype (Fig. 4). Phenotypical analysis showed that LN LCs and CD1a+ DCs express markers similar to that of LCs and dermal CD1a+ DCs purified directly from the skin (Figs. 3 A and 4 and Table S1). The LN counterpart of CD14+ dermal DCs is less clear. CD14+ cells in LNs are, for their vast majority, macrophages (Fig. 3 A). However, LN CD206+ DCs express a combination of markers very similar to the ones found on skin CD14+ DCs (Table S1), except for CD14 itself (which is not expressed on CD206+ DCs). It is therefore most likely that skin CD14+ DCs loose the expression of CD14 during migration from the skin. Finally, LN LCs, CD1a+ DCs, and CD206+ DCs but not BDCA1+ or Clec9A+ DCs express CCR7, a chemokine receptor involved in migratory DC entry into the LNs in mice (Ohl et al., 2004).
Figure 2.
Characterization of DC subsets in nonskin-draining lymphoid organs. (A–C) Cervical or iliac LN (A), spleen (B), or tonsil (C) cells were enriched for DCs and stained for HLA-DR, CD11c, CD1a, CD14, Clec9A, BDCA1, and CD206. Representative results of five (A), three (B), or eight (C) independent experiments are shown.
Figure 3.
Phenotype of LN DC subsets. (A) Axillary LN cells were enriched for DCs and stained for HLA-DR, CD11c, CD1a, CD14, EpCAM, BDCA1, Clec9A, CD206, CD83, CD86, BDCA3, CD172a, CD209, CCR7, or control isotype. Representative results of 4–12 independent experiments are shown. (B) Purified DC populations were coated on microscopy slides, fixed, permeabilized, and stained for langerin (green). The nucleus is stained with DAPI (blue). Representative images are shown of three to four independent experiments. Bars, 10 µm.
Figure 4.
Phenotype of migratory skin DC subsets. Cells isolated after skin explant culture were stained for HLA-DR, CD11c, CD1a, CD14, EpCAM, BDCA1, Clec9A, CD206, CD83, CD86, BDCA3, CD172a, CD209, CCR7, or control isotype. Representative results of five independent experiments are shown.
Based on these results, we conclude that human axillary LNs contain three subsets of skin-derived migratory DCs, corresponding to LCs and dermal CD1a+ and dermal CD14+CD1a− DCs, and three subsets of blood-derived resident DCs. The phenotype of skin-emigrated DN DCs (Fig. 4) was similar to that of CD1a+ DCs and could represent an immature form of these cells or have low expression of CD1a. However, the LN BDCA1+ DC gate might contain a few skin-derived CD206− DN DCs. We also found in all lymphoid organs analyzed a small population of Clec9A−BDCA1− cells that could be an additional population of DCs or a precursor form of resident DCs. Finally, we found that Langerin was expressed by LCs and all CD1a+ DCs (Fig. 3 B) and at low levels by Clec9A+ DCs. Of note, we could not detect Clec9A on any of the skin-derived DC subsets (Figs. 3 A and 4).
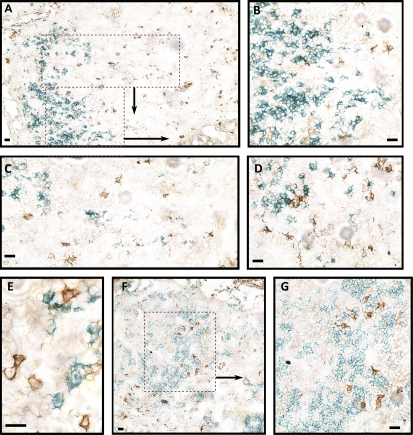
Consistent with this, CD1a+ cells were negative for Clec9A in in situ immunohistological analysis of LN sections (Fig. 5, A–D). We observed that CD1a+ cells (i.e., CD1a+ DCs and LCs) were always found clustered in the LNs and often in T cell–rich areas. In contrast, Clec9A+ DCs were mostly distributed all around the LN cortex (inner and outer), although a minority of Clec9A+ DCs could be found in T cell–rich areas as previously reported (Fig. 5, F and G; Galibert et al., 2005). In some cases, Clec9A+ DCs were found in close contact with migratory CD1a+ cells (Fig. 5, D and E) and also observed in subcapsular and cortical sinuses (not depicted). These results show that Clec9A+ resident DCs and CD1a+ migratory DCs are not similarly distributed in the LNs.
Figure 5.
Immunohistological localization of resident Clec9A+ DCs and migratory CD1a+ DCs in LNs. (A–E) Frozen LN sections were stained for Clec9A (brown) and CD1a (green). (F and G) Frozen LN sections were stained for Clec9A (brown) and CD3 (green). Representative results of four independent experiments are shown. Bars, 10 µm.
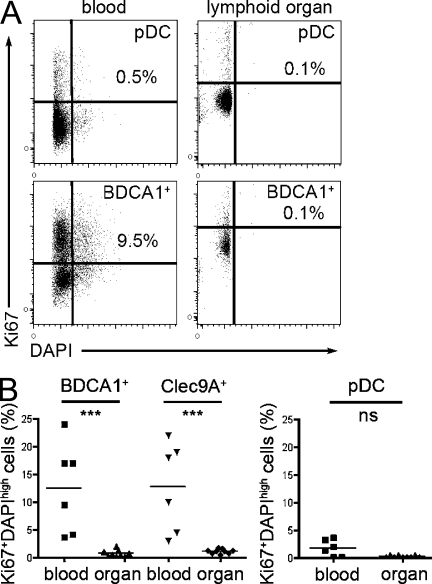
To better characterize the relationship between lymphoid organ–resident blood-derived DC subsets and blood DCs, we examined the cell cycle status of blood and lymphoid organ pDCs and BDCA1+ and Clec9A+ DCs. Labeling with DAPI and the proliferation marker Ki67 showed that a significant proportion of blood BDCA1+ and Clec9A+ DCs were cycling, whereas very few lymphoid organ BDCA1+ and Clec9A+ DCs did so (Fig. 6). In contrast, pDCs from blood or lymphoid organ did not cycle. These observations suggest that blood BDCA1+ and Clec9A+ DCs may not be fully differentiated.
Figure 6.
Cell cycle status of blood and lymphoid organ DCs. Blood PBMCs were enriched for DCs and stained for HLA-DR, CD11c, CD16, CD14, BDCA1, and BDCA3. Axillary LN or tonsil cells were enriched for DCs and stained for HLA-DR, CD11c, CD14, BDCA1, and BDCA3. Cells were fixed, permeabilized, and stained for Ki67 and DAPI. BDCA1+ DCs were gated as HLA-DR+CD11c+CD16−CD14−BDCA1+, Clec9A+ DCs were gated as HLA-DR+CD11c+CD16−CD14−BDCA3+, and pDCs were gated as HLA-DR+CD11c−. (A) Representative results for BDCA1+ DCs and pDCs are shown. (B) The percentage of Ki67+DAPIhigh cells is shown in six independent experiments for blood DCs and nine independent experiments for lymphoid organ DCs (three LNs and six tonsils). Horizontal bars indicate the mean. ***, P < 0.0001.
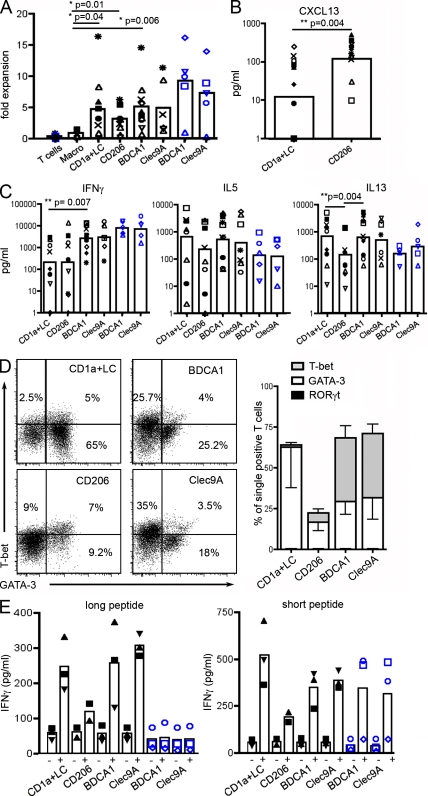
To investigate the functional properties of LN migratory and resident DCs, we isolated these DC populations. Because of technical limitations in cell sorting, we pooled LCs and CD1a+ DCs in some experiments, as these cells appear to have similar properties after ex vivo migration from the skin (Klechevsky et al., 2008). All DC types but not macrophages induced proliferation of allogeneic naive CD4+ T cells (Fig. 7 A). We examined the capacity of DC subtypes to polarize naive CD4+ T cells into helper T cells in an allogeneic mixed leukocyte reaction by measuring cytokine secretion (Fig. 7, B and C) and induction of Th subset–specifying transcription factors (Fig. 7 D). None of the DC subsets induced Th17 polarization, as IL-17A secretion and RORγt expression were undetectable (not depicted). LCs and CD1a+ DCs preferentially induced a Th2 profile, as indicated by secretion of IL-5 and IL-13 and expression of GATA-3, accompanied by little or no secretion of IFN-γ. LN BDCA1+ DCs and Clec9A+ DCs induced similar levels of Th1 and Th2 polarization. Skin CD14+ DCs have been shown to induce CD4+ T cells to secrete CXCL13 (Klechevsky et al., 2008), a chemokine associated with the T follicular helper cell profile (Kim et al., 2004; Crotty, 2011). As shown in Fig. 7 B, CD206+ DCs preferentially induced CXCL13 secretion, confirming our hypothesis that CD206+ DCs represent the LN counterpart of skin CD14+ DCs. Therefore, different DC subsets in LNs display selective capacities to influence CD4+ T cell differentiation ex vivo.
Figure 7.
Functional properties of LN DC subsets. DC subsets from LNs (black symbols) or blood (blue symbols) were purified and cultured with allogeneic naive CD4+ T cells for 6 d before T cell restimulation. (A–C) Symbols represent cells purified from the same donor (for LNs, n = 4 for macrophages and n = 7–11 for DCs; for blood, n = 5). Black closed symbols represent experiments with CD1a+ DCs alone, and other symbols represent experiments with pooled CD1a+ DCs and LCs. Mean is shown. (A) T cell proliferation was assessed by calculating fold expansion (ratio of the number of T cells at the end of the culture divided by the number of T cells plated at the start of the culture). (B and C) Cytokine concentration was measured in culture supernatant by ELISA or cytometric bead array. (D) Cultured T cells were permeabilized and stained for GATA-3, T-bet, and RORγt. Representative plots of five independent experiments and mean ± SD are shown. (E) Purified LN or blood DCs were incubated with (+) or without (−) MelanA long or short peptide and cultured with antigen-specific CD8+ T cell clones. Secretion of IFN-γ was assessed as a measure of T cell activation. Symbols represent DCs purified from the same donor (n = 3; except for CD206+ DCs n = 2). CD1a+ DCs and LCs were pooled. Mean is shown.
In comparison, blood BDCA1+ DCs and Clec9A+ DCs induced efficient Th1 polarization but poor Th2 polarization. For the two Th2 cytokine tested, IL-5 and IL-13, blood BDCA1+ and Clec9A+ DCs were less efficient than their corresponding counterparts present in LNs, although the difference did not reach statistical significance. This observation is consistent with the idea that blood cDCs are not fully differentiated, as it has been shown in mice that immediate precursors of resident DCs have not yet developed their full functional abilities (Bedoui et al., 2009). These results contrast with previous work showing that blood Clec9A+ DCs are more potent than blood BDCA1+ DCs at inducing Th1 responses by total CD4+ T cells (Jongbloed et al., 2010).
Finally, in a cross-presentation assay using long (requiring processing) and short (preprocessed) peptides of MelanA antigen, we found that pooled LC/CD1a+, BDCA1+, and Clec9A+ DCs were all able to cross-present efficiently (Fig. 7 E). CD206+ DCs were poor at cross-presentation but also poor activators of MelanA-specific CD8+ T cell clones when incubated with the short peptide. Because of the limited number of DCs obtained, we could not titrate antigen, and given the limited number of donors, it is difficult to assess whether Clec9A+ DCs cross-present more efficiently than other subsets, as previously suggested (Bachem et al., 2010; Crozat et al., 2010; Jongbloed et al., 2010; Poulin et al., 2010). Of note, blood DCs did not cross-present, although they could activate CD8+ T cell clones when incubated with the short peptide. This is consistent with observations that blood DCs do not cross-present antigens unless they are activated by Toll-like receptor ligands (Crozat et al., 2010; Jongbloed et al., 2010), again suggesting that blood DCs have not yet developed their full functional abilities. Importantly, Th polarization and cross-presentation by LCs, CD1a+ DCs, and CD206+ DCs were identical to that of the corresponding subsets directly purified from the skin (Klechevsky et al., 2008), showing that skin-derived DCs retain their functional specialization after migration into LNs.
These results suggest that the life cycle of the main DC subsets that has been reported in mice is conserved in humans. Skin-derived DCs constitutively migrate through the lymph into LNs, where they accumulate together with LN-resident DCs, which likely derive from blood DCs and only acquire their full functional abilities once they reach the lymphoid organs. Although our study was performed on LNs from cancer patients, the LNs used were not invaded, and the patients selected had not received any treatment. It is therefore most likely that our findings apply to healthy individuals. Our results showing the induction of different T cell responses by DC subsets have important implications for DC-based immunotherapies, in particular for DC-targeting vaccines and skin immunization strategies.
MATERIALS AND METHODS
Samples and cell isolation.
All experiments were approved by the Institut National de la Santé et de la Recherche Médicale ethics committee. Samples of LNs from untreated cancer patients undergoing diagnostic surgery were obtained from the Institut Curie hospital in accordance with institutional ethical guidelines. Only LNs considered healthy (noninvaded) after anatomopathological examination were included in the study. LNs studied were axillary LNs (skin draining), LNs draining the oropharynx (nonskin draining), and iliac LNs (nonskin draining). Normal skin was obtained from patients undergoing abdominal reconstructive plastic surgery or patients undergoing mastectomy in accordance with institutional ethical guidelines. Skin was split-cut with a Keratome set and placed epidermal side up on a 100-mm tissue culture Petri dish containing RPMI 1640 supplemented with 10% heat-inactivated FCS with 2 mM l-glutamine and 200 U/ml penicillin-streptomycin. After 2 d, nonadherent cells that had migrated out of the explants were collected and filtered through a 70-µm filter (BD) to remove residual tissue. Spleen samples from untreated cancer patients undergoing therapeutic surgery were obtained from the Institut Curie hospital in accordance with institutional ethical guidelines. Tonsils from healthy patients undergoing tonsillectomy were obtained from Hôpital Necker (Paris, France) in accordance with hospital ethical guidelines. Samples were cut into small fragments, digested with 0.1 mg/ml Liberase TL (Roche) in the presence of 0.1 mg/ml DNase (Roche) for 20 min before the addition of 10 mM EDTA. Cells were filtered on a 40-µm cell strainer (BD) and washed. For spleen and tonsils, light density cells were isolated by centrifugation on a Ficoll gradient (Lymphoprep; Greiner Bio-One). DCs were enriched by depletion of cells expressing CD3, CD15, CD19, CD56, and CD235a using antibody-coated magnetic beads and magnetic columns according to the manufacturer’s instructions (Miltenyi Biotec). Buffy coats from healthy donors were obtained from Etablissement Français du Sang. PBMCs were isolated after centrifugation on a Ficoll gradient. Blood DCs were isolated by depletion of cells expressing CD3, CD15, CD19, CD56, CD16, CD14, and CD235a using antibody-coated magnetic beads and magnetic columns according to the manufacturer’s instructions (Miltenyi Biotec) followed by cell sorting on a FACSAria instrument (BD). Cell subsets were further isolated by cell sorting on a FACSAria instrument (BD).
Flow cytometry.
Nonspecific binding was blocked using TruStain (BioLegend). Cells were stained with FITC or Pe/Cy5 anti-CD1a (BD), PE anti-CD14 (BD), Alexa Fluor 700 anti-CD14 (BioLegend), PE anti-CD83 (BD), FITC anti-CD86 (BD), PerCP–eFluor 710 anti–BDCA-1 (eBioscience), APC–eFluor 780 anti–HLA-DR (eBioscience), Pe/Cy7 anti-CD11c (BioLegend), PerCP–eFluor 710 anti-EpCAM (eBioscience), Alexa Fluor 647 anti-CD206 (BioLegend), PE or APC anti-BDCA3 (Miltenyi Biotec), PE anti-BDCA4 (Miltenyi Biotec), FITC or APC anti-CCR7 (R&D Systems), biotinylated anti-CD172a (BioLegend), biotinylated anti-CD163 (BioLegend), or biotinylated anti-CD209 (Miltenyi Biotec) followed by staining with PerCP–eFluor 710 streptavidin (eBioscience) or Alexa Fluor 647 streptavidin (Invitrogen) or Alexa Fluor 700 streptavidin (Invitrogen), or isotype-matched control antibodies. Anti-Clec9A antibody (clone 8F9; Sancho et al., 2008) was produced in-house and coupled to DyLight 488 (Thermo Fisher Scientific). For intracellular staining, cells were fixed and permeabilized with reagents according to the manufacturer’s instructions (eBioscience) and stained with PE anti-Ki67 (eBioscience) and DAPI (Sigma-Aldrich). Cells were analyzed on an LSR II (BD) or MACSQuant (Miltenyi Biotec) instrument. Data were analyzed with FlowJo software (Tree Star).
Morphological analysis.
Cells were subjected to cytospin and colored with May-Grünwald/Giemsa staining. Images were acquired with a CFW-1308C color digital camera (Scion Corporation) on a DM 4000 B microscope (Leica).
Apoptotic cells uptake assay.
HeLa cells were labeled with CellVue Claret Far Red Fluorescent cell linker (Sigma-Aldrich) according to the manufacturer’s instructions. To induce apoptosis, cells were incubated overnight with 10 µg/ml oxaliplatin (Sanofi-Aventis). After treatment, 70% of cells were apoptotic and 30% necrotic as assessed by Annexin V and propidium iodide staining (BD). After extensive washing, HeLa cells were incubated with LN cells enriched for DCs for 1 h at 4°C or 37°C. Cells were stained for flow cytometry and analyzed on an LSR II instrument.
Immunohistology.
LN samples were placed in Tissue-Tek (Sakura) and frozen at −80°C. Microscope slides of acetone-fixed cryocut tissue sections were incubated with anti-CLEC9A (clone 8F9) for 60 min and subsequently with the ImmPRESS anti–mouse Ig-peroxidase (Vector Laboratories) for 30 min. Peroxidase activity was developed using DAB substrate (Dako). Then, after blocking for 30 min with horse serum, slides were incubated with anti-CD1a (Beckman Coulter) or anti-CD3 (BD) and incubated again with ImmPRESS anti–mouse Ig-peroxidase. This second peroxidase staining was visualized using Elite Histogreen (AbCys Biology).
Confocal microscopy.
Cells were coated on glass slides, fixed with 2% paraformaldehyde and permeabilized in PBS containing 0.05% saponin and 10% bovine serum. Cells were stained with biotinylated anti-Langerin (Dendritics) followed by staining with Alexa Fluor 488–streptavidin (Invitrogen) and DAPI (Sigma-Aldrich). Slides were analyzed on an LSM 510 confocal microscope (Carl Zeiss).
T helper cell polarization.
Naive CD4+ T cells were isolated from healthy donors’ PBMCs by negative selection using magnetic beads (Miltenyi Biotec) followed by cell sorting on a FACSAria instrument. Naive CD4+ T cells were gated as CD4+CD25−CD45RA+CD45RO−. Antigen-presenting cells (5 × 10³ cells/well) were cultured with naive CD4+ T cells (1.5 × 10⁴ cells/well) for 6 d in Yssel’s medium supplemented with 10% FCS. After washing, cells were incubated with anti-CD3/CD28 beads (Invitrogen) for 24 h in X-VIVO 15 serum-free medium (Lonza). Supernatants were collected, and cytokine secretion was assessed by cytometric bead array (BD) or ELISA for CXCL13 (R&D Systems). Cells were fixed and permeabilized with intracellular staining reagents according to the manufacturer’s instructions (eBioscience) and stained with eFluor 660 anti-GATA3, PE anti-RORγt, or eFluor 780 or PE anti-Tbet (eBioscience). Cells were analyzed on an LSR II or MACSQuant instrument. Data were analyzed with FlowJo software.
Cross-presentation assay.
Purified HLA-A2+ DCs were incubated (5,000 cells/well) in V-bottom 96-well plates (Corning) with 30 µM MelanA long peptide (KGHGHSYTTAEEAAGIGILTVILGVL) or 10 µM MelanA short peptide (EAAGIGILTV) or without peptide for 3 h in Yssel’s medium. After extensive washing, DCs were cultured for 24 h with CD8 T cell MelanA–specific LT12 clones (20,000 cells/well; Dufour et al., 1997) in Yssel’s medium supplemented with 10% FCS. Supernatants were collected and kept at −20°C until measurement of IFN-γ concentration by ELISA (BD).
Statistical analysis.
Wilcoxon matched paired test or Mann-Whitney test was performed using Prism (GraphPad Software).
Online supplemental material.
Table S1 lists the phenotypes of skin-derived DCs in axillary LNs and skin. Online supplemental material is available at http://www.jem.org/cgi/content/full/jem.20111457/DC1.
Acknowledgments
We wish to thank the Institut Curie Flow Cytometry facility for cell sorting and Dr. E. Weill and his medical staff for providing skin samples.
This work is supported by Institut National de la Santé et de la Recherche Médicale. E. Segura is a fellow of the Association pour la Recherche sur le Cancer.
The authors have no competing financial interests.
Footnotes
Abbreviations used:
cDC
conventional DC
DN
double negative
LC
Langerhans cell
pDC
plasmacytoid DC
References
- Angel C.E., Chen C.J., Horlacher O.C., Winkler S., John T., Browning J., MacGregor D., Cebon J., Dunbar P.R. 2009. Distinctive localization of antigen-presenting cells in human lymph nodes. Blood. 113:1257–1267 10.1182/blood-2008-06-165266 [DOI] [PMC free article] [PubMed] [Google Scholar]
- Bachem A., Güttler S., Hartung E., Ebstein F., Schaefer M., Tannert A., Salama A., Movassaghi K., Opitz C., Mages H.W., et al. 2010. Superior antigen cross-presentation and XCR1 expression define human CD11c+CD141+ cells as homologues of mouse CD8+ dendritic cells. J. Exp. Med. 207:1273–1281 10.1084/jem.20100348 [DOI] [PMC free article] [PubMed] [Google Scholar]
- Bedoui S., Prato S., Mintern J., Gebhardt T., Zhan Y., Lew A.M., Heath W.R., Villadangos J.A., Segura E. 2009. Characterization of an immediate splenic precursor of CD8+ dendritic cells capable of inducing antiviral T cell responses. J. Immunol. 182:4200–4207 10.4049/jimmunol.0802286 [DOI] [PubMed] [Google Scholar]
- Crotty S. 2011. Follicular helper CD4 T cells (TFH). Annu. Rev. Immunol. 29:621–663 10.1146/annurev-immunol-031210-101400 [DOI] [PubMed] [Google Scholar]
- Crozat K., Guiton R., Contreras V., Feuillet V., Dutertre C.A., Ventre E., Vu Manh T.P., Baranek T., Storset A.K., Marvel J., et al. 2010. The XC chemokine receptor 1 is a conserved selective marker of mammalian cells homologous to mouse CD8α+ dendritic cells. J. Exp. Med. 207:1283–1292 10.1084/jem.20100223 [DOI] [PMC free article] [PubMed] [Google Scholar]
- Dufour E., Carcelain G., Gaudin C., Flament C., Avril M.F., Faure F. 1997. Diversity of the cytotoxic melanoma-specific immune response: some CTL clones recognize autologous fresh tumor cells and not tumor cell lines. J. Immunol. 158:3787–3795 [PubMed] [Google Scholar]
- Dzionek A., Fuchs A., Schmidt P., Cremer S., Zysk M., Miltenyi S., Buck D.W., Schmitz J. 2000. BDCA-2, BDCA-3, and BDCA-4: Three markers for distinct subsets of dendritic cells in human peripheral blood. J. Immunol. 165:6037–6046 [DOI] [PubMed] [Google Scholar]
- Galibert L., Diemer G.S., Liu Z., Johnson R.S., Smith J.L., Walzer T., Comeau M.R., Rauch C.T., Wolfson M.F., Sorensen R.A., et al. 2005. Nectin-like protein 2 defines a subset of T-cell zone dendritic cells and is a ligand for class-I-restricted T-cell-associated molecule. J. Biol. Chem. 280:21955–21964 10.1074/jbc.M502095200 [DOI] [PubMed] [Google Scholar]
- Haniffa M., Ginhoux F., Wang X.N., Bigley V., Abel M., Dimmick I., Bullock S., Grisotto M., Booth T., Taub P., et al. 2009. Differential rates of replacement of human dermal dendritic cells and macrophages during hematopoietic stem cell transplantation. J. Exp. Med. 206:371–385 10.1084/jem.20081633 [DOI] [PMC free article] [PubMed] [Google Scholar]
- Heath W.R., Carbone F.R. 2009. Dendritic cell subsets in primary and secondary T cell responses at body surfaces. Nat. Immunol. 10:1237–1244 10.1038/ni.1822 [DOI] [PubMed] [Google Scholar]
- Jongbloed S.L., Kassianos A.J., McDonald K.J., Clark G.J., Ju X., Angel C.E., Chen C.J., Dunbar P.R., Wadley R.B., Jeet V., et al. 2010. Human CD141+ (BDCA-3)+ dendritic cells (DCs) represent a unique myeloid DC subset that cross-presents necrotic cell antigens. J. Exp. Med. 207:1247–1260 10.1084/jem.20092140 [DOI] [PMC free article] [PubMed] [Google Scholar]
- Kim C.H., Lim H.W., Kim J.R., Rott L., Hillsamer P., Butcher E.C. 2004. Unique gene expression program of human germinal center T helper cells. Blood. 104:1952–1960 10.1182/blood-2004-03-1206 [DOI] [PubMed] [Google Scholar]
- Klechevsky E., Morita R., Liu M., Cao Y., Coquery S., Thompson-Snipes L., Briere F., Chaussabel D., Zurawski G., Palucka A.K., et al. 2008. Functional specializations of human epidermal Langerhans cells and CD14+ dermal dendritic cells. Immunity. 29:497–510 10.1016/j.immuni.2008.07.013 [DOI] [PMC free article] [PubMed] [Google Scholar]
- Lindstedt M., Lundberg K., Borrebaeck C.A. 2005. Gene family clustering identifies functionally associated subsets of human in vivo blood and tonsillar dendritic cells. J. Immunol. 175:4839–4846 [DOI] [PubMed] [Google Scholar]
- McIlroy D., Troadec C., Grassi F., Samri A., Barrou B., Autran B., Debré P., Feuillard J., Hosmalin A. 2001. Investigation of human spleen dendritic cell phenotype and distribution reveals evidence of in vivo activation in a subset of organ donors. Blood. 97:3470–3477 10.1182/blood.V97.11.3470 [DOI] [PubMed] [Google Scholar]
- Merad M., Manz M.G. 2009. Dendritic cell homeostasis. Blood. 113:3418–3427 10.1182/blood-2008-12-180646 [DOI] [PMC free article] [PubMed] [Google Scholar]
- Nestle F.O., Zheng X.G., Thompson C.B., Turka L.A., Nickoloff B.J. 1993. Characterization of dermal dendritic cells obtained from normal human skin reveals phenotypic and functionally distinctive subsets. J. Immunol. 151:6535–6545 [PubMed] [Google Scholar]
- Ohl L., Mohaupt M., Czeloth N., Hintzen G., Kiafard Z., Zwirner J., Blankenstein T., Henning G., Förster R. 2004. CCR7 governs skin dendritic cell migration under inflammatory and steady-state conditions. Immunity. 21:279–288 10.1016/j.immuni.2004.06.014 [DOI] [PubMed] [Google Scholar]
- Poulin L.F., Salio M., Griessinger E., Anjos-Afonso F., Craciun L., Chen J.L., Keller A.M., Joffre O., Zelenay S., Nye E., et al. 2010. Characterization of human DNGR-1+ BDCA3+ leukocytes as putative equivalents of mouse CD8α+ dendritic cells. J. Exp. Med. 207:1261–1271 10.1084/jem.20092618 [DOI] [PMC free article] [PubMed] [Google Scholar]
- Randolph G.J., Ochando J., Partida-Sánchez S. 2008. Migration of dendritic cell subsets and their precursors. Annu. Rev. Immunol. 26:293–316 10.1146/annurev.immunol.26.021607.090254 [DOI] [PubMed] [Google Scholar]
- Sancho D., Mourão-Sá D., Joffre O.P., Schulz O., Rogers N.C., Pennington D.J., Carlyle J.R., Reis e Sousa C. 2008. Tumor therapy in mice via antigen targeting to a novel, DC-restricted C-type lectin. J. Clin. Invest. 118:2098–2110 10.1172/JCI34584 [DOI] [PMC free article] [PubMed] [Google Scholar]
- Summers K.L., Hock B.D., McKenzie J.L., Hart D.N. 2001. Phenotypic characterization of five dendritic cell subsets in human tonsils. Am. J. Pathol. 159:285–295 10.1016/S0002-9440(10)61694-X [DOI] [PMC free article] [PubMed] [Google Scholar]
- Valladeau J., Duvert-Frances V., Pin J.J., Dezutter-Dambuyant C., Vincent C., Massacrier C., Vincent J., Yoneda K., Banchereau J., Caux C., et al. 1999. The monoclonal antibody DCGM4 recognizes Langerin, a protein specific of Langerhans cells, and is rapidly internalized from the cell surface. Eur. J. Immunol. 29:2695–2704 [DOI] [PubMed] [Google Scholar]
- van de Ven R., van den Hout M.F., Lindenberg J.J., Sluijter B.J., van Leeuwen P.A., Lougheed S.M., Meijer S., van den Tol M.P., Scheper R.J., de Gruijl T.D. 2011. Characterization of four conventional dendritic cell subsets in human skin-draining lymph nodes in relation to T-cell activation. Blood. 118:2502–2510 10.1182/blood-2011-03-344838 [DOI] [PubMed] [Google Scholar]
- Villadangos J.A., Heath W.R. 2005. Life cycle, migration and antigen presenting functions of spleen and lymph node dendritic cells: Limitations of the Langerhans cells paradigm. Semin. Immunol. 17:262–272 10.1016/j.smim.2005.05.015 [DOI] [PubMed] [Google Scholar]
