miR-93/106b and Their Host Gene, MCM7, Are Differentially Expressed in Leiomyomas and Functionally Target F3 and IL-8 (original) (raw)
Abstract
miR-93/106b and their host gene minichromosome maintenance complex component 7 (MCM7) reside at chr7q22, a region frequently rearranged in leiomyomas. We explored the expression of miR-93/106b in leiomyoma and paired myometrium (n = 63) from untreated and patients exposed to hormonal therapies (GnRH agonist, Depo-Provera, and oral contraceptives) from African-Americans and Caucasians and their regulatory functions in isolated paired (n = 15) leiomyoma and myometrial smooth muscle cells and the leiomyosarcoma cell line. At tissue level leiomyomas expressed significantly lower levels of miR-93 and elevated MCM7 as compared with myometrium with limited racial influence or hormonal exposure on their expression. Assessing the regulatory function of miR-93/106b through doxycycline-inducible lentiviral transduction in a microarray analysis, tissue factor (F3) and IL8 were identified as their possible targets. At the tissue level, leiomyomas expressed a significantly lower level of F3 and an elevated IL-8 level, which exhibited an inverse relationship with miR-93 but with limited racial or hormonal influences. The gain of function of miR-93/106b in leiomyoma smooth muscle cells, myometrial smooth muscle cells, and the leiomyosarcoma cell line dose dependently repressed F3 and IL8 through direct interactions with their respective 3′-untranslated region and indirectly through F3 repression inhibited IL8, CTGF, and PAI-1 expression, confirmed by using small interfering RNA silencing or factor Vlla (FVIIa) activation of F3, as well as reducing the rate of proliferation, while increasing caspase-3/7 activity. We concluded that differential expression of miR-93/106b and their direct and/or indirect regulatory functions on F3, IL8, CTGF, and PAI-1 expression, with key roles in inflammation and tissue turnover may be of significance in the outcome of leiomyoma growth and associated symptoms.
MicroRNA (miRNA) have emerged as key posttranscriptional regulators and through this mechanism they play a central role in various aspects of normal cellular activities ranging from cell proliferation, differentiation, apoptosis, inflammatory response, and tissue turnover (1–3). Conversely, aberrant expression of miRNA has been closely associated with various disorders, specifically cancers in which they function as oncogenes and/or tumor suppressors, resulting in cellular transformation and tumorigenesis (2, 4–7). The genomic regions encoding oncogenes, tumor suppressors, and miRNA that are located in fragile sites (hot spots) are often affected by chromosomal rearrangements characterized in various cancer cells and tissues (8). Leiomyomas are common benign uterine tumors that develop during the reproductive years with estimated 20–40% of the tumors characterized by chromosomal abnormalities, including 7q22 deletion (9–11). Although the identity of factors that mediate the development of leiomyomas remain elusive, conventional and array-based studies have identified a number of candidate genes, including a few genes residing in rearranged chromosomal regions, for their potential contribution to genesis of leiomyoma (12–16).
Chromosome 7q22 harbors many genes, including MCM7, which cotranscribes miR-106b∼25 cluster through interon 13. MCM7 is a member of family of DNA helicases with a central role in the initiation of DNA replication and cell cycle progression (17), which is overexpressed in various malignancies, including endometrial cancer (18–21). Aberrant expression of miR-106b∼25 has also been documented in several malignancies and predicted to target the expression of many genes functionally associated with cell proliferation, apoptosis, and tissue turnover or function as a protooncogene through cooperation with either MCM7 or Myc (22–26). Expression profiling has identified several hundred miRNA in leiomyomas in menstrual cycle-, tumor size-, and ethnic-dependent manners; however, only the expression of a few miRNA or their specific target genes has been confirmed or validated (27–30). Considering the cell- and tissue-dependent expression and function of miRNA (31, 32), the objective of the present study was to explore the expression and regulatory function of miR-93/106b in leiomyoma as compared with myometrium.
Using a large cohort of leiomyomas and paired myometrium from untreated and patients who were exposed to hormonal therapies we demonstrated that miR-93, miR-106b, and MCM7 are differentially expressed in leiomyomas. Through gain of function of miR-93/106b in isolated leiomyoma smooth muscle cells (LSMC), myometrial smooth muscle cells (MSMC), and the leiomyosarcoma cell line (SKLM-S1) as in vitro models, we identified F3 and IL8 as their direct targets and indirectly through tissue factor (F3)-mediated actions regulated the expression of CTGF and PAI-1. The gain of function of miR-93/106b or small interfering RNA (siRNA) silencing of F3 or IL8 also altered the LSMC rate of proliferation, caspase activity, and migration in wound-healing assay. Given the key regulatory function of F3, IL-8, CTGF, and PAI-1 in various cellular activities, including inflammation and tissue turnover, the results suggested that the altered expression of miR-93/106b may have a significant impact on the outcome of the above processes, which are central to leiomyoma growth and associated symptoms.
Results
miR-93/106b and their host gene MCM7 are differentially expressed in leiomyomas
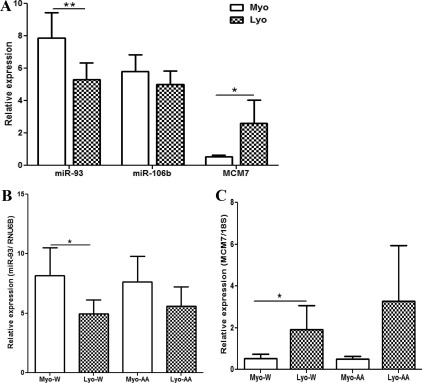
miR-93/106b as member of the miR106b∼25 cluster resides at the interon 13 of the MCM7 genome and with similar predicted target genes. We assessed the expression of miR-93, miR-106b, and MCM7 in leiomyoma and paired myometrium from several cohorts consisting of patients from the follicular and luteal phases of the menstrual cycle and those experiencing abnormal uterine bleeding as well as patients who were exposed to a GnRH agonist (GnRHa), Depo-Provera, or oral contraceptives (OCP). The analysis indicated a considerable variation in the level expression of miR-93, miR-106b, and MCM7 among the tissues from all cohorts. To illustrate the difference in miR-93, miR-106b, and MCM7 expression a summary of the ratio of their expression at 1.3-fold change cutoff (up or down) from each leiomyoma over its own paired myometrium is presented in Table 1, and their mean expression in leiomyomas and myometrium for each cohort is shown in Supplemental Fig. 1. In paired tissues from untreated group, miR-93, but not miR-106b, expressed at significantly lower levels (P < 0.05) with concurrent elevated expression of MCM7 (P < 0.01) in leiomyomas as compared with myometrium (Fig. 1A). Although considerable differences were detected in the level of miR-93, miR-106b, and MCM7 expression between untreated and those exposed to hormonal therapies, i.e. GnRHa and OCP, these values were not significantly different based on the influence of hormonal milieu (Supplemental Fig. 1). Leiomyomas from patients experiencing abnormal uterine bleeding expressed lower levels of miR-93 (P = 0.016) and elevated MCM7 (P = 0.0415), which was further elevated during the luteal phase (P = 0.051) and exhibited an inverse relationship with miR-93 expression (Supplemental Fig. 1, A–C). The analysis also indicated a lower miR-93 and elevated MCM7 expression in leiomyomas from both Caucasians (P < 0.05) and African-Americans as compared with their own corresponding myometrium (Fig. 1, B and C). Collectively the results indicated that miR-93, miR-106b, and MCM7 are differentially expressed in leiomyoma and myometrium with limited influence of racial or hormonal exposure on their mean expression, although differences exist based on individual patient.
Table 1.
Ratio of miR-93, miR106b, MCM7, F3, and IL8 expression
| L/M | Follicular | Luteal | AUB | GnRH | Depo | OCP |
|---|---|---|---|---|---|---|
| miR-93 | ||||||
| Up | 4/12 (0.333) | 4/17 (0.235) | 1/12 (0.083) | 2/6 (0.333) | 4/12 (0.333) | 2/3 (0.667) |
| Down | 6/12 (0.5) | 7/17 (0.412) | 8/12 (0.667) | 1/6 (0.167) | 4/12 (0.333) | 1/3 (0.333) |
| N value | 12 | 17 | 12 | 6 | 12 | 3 |
| miR-106b | ||||||
| Up | 6/12 (0.5) | 3/17 (0.176) | 2/12 (0.167) | 3/6 (0.5) | 2/12 (0.167) | 2/3 (0.667) |
| Down | 4/12 (0.333) | 4/17 (0.235) | 6/12 (0.5) | 1/6 (0.167) | 6/12 (0.5) | 1/3 (0.333) |
| N value | 12 | 17 | 12 | 6 | 12 | 3 |
| MCM7 | ||||||
| Up | 6/12 (0.5) | 8/16 (0.5) | 8/12 (0.667) | 3/6 (0.5) | 4/12 (0.333) | 0 |
| Down | 3/12 (0.25) | 3/16 (0.1875) | 1/12 (0.083) | 2/6 (0.333) | 2/12 (0.167) | 2/3 (0.667) |
| N value | 12 | 16 | 12 | 6 | 12 | 3 |
| F3 | ||||||
| Up | 1/12 (0.083) | 10/17 (0.588) | 4/12 (0.333) | 1/6 (0.167) | 4/12 (0.333) | 2/3 (0.667) |
| Down | 8/12 (0.667) | 6/17 (0.353) | 7/12 (0.583) | 4/6 (0.667) | 6/12 (0.5) | 1/3 (0.333) |
| N value | 12 | 17 | 12 | 6 | 12 | 3 |
| IL8 | ||||||
| Up | 6/12 (0.5) | 10/17 (0.588) | 6/12 (0.5) | 0 | 3/12 (0.25) | 0 |
| Down | 5/12 (0.417) | 2/17 (0.118) | 3/12 (0.25) | 3/6 (0.5) | 6/12 (0.5) | 1 (3/3) |
| N value | 12 | 17 | 12 | 6 | 12 | 3 |
Fig. 1.
A, The relative expression (mean ± sem) of miR-93, miR-106b, and MCM7 in leiomyoma (LYO) and paired myometrium (MYO) from the untreated group (n = 41) with the expression of miR-93 (B) and MCM7 (C) in paired tissues representing Caucasian (W; n = 18) and African-Americans (AA; n = 20). The data were analyzed using nonparametric Student t test (*, P < 0.05 and **, P < 0.01, indicating significant difference as indicated by the corresponding lines for each paired tissues).
Identification of F3 and IL-8 as targets of miR-93/106b
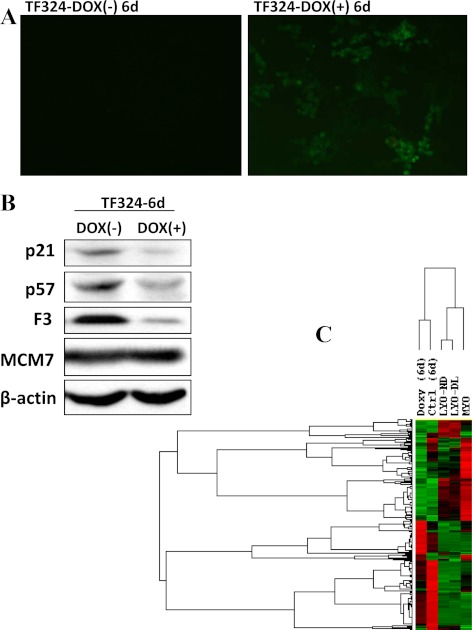
Using doxycycline (Dox)-inducible lentiviral vector, miR-106b∼25 cluster was transduced in TF324 cells to identify the overall genes targeted by miR-93/106b. Dox treatment significantly increased the expression of miR-106b∼25 (Fig. 2A) while repressing the expression of p21, p57, and F3, without affecting MCM7 expression (Fig. 2B). p21 and p57 were previously validated as direct targets of miR93/106b and miR-25, respectively, whereas F3 is a predicted target of miR-93/106b. To further assess the influence of miR-106b∼25 transduction on overall gene expression, total RNA isolated from Dox-treated and untreated TF324 cells were subjected to microarray gene profiling. Our microarray GEO accession number is GSE37122. The analysis identified the expression of a large number of genes altered after miR-106b∼25 transduction. Based on 1.5-fold change cutoff, the expression of 992 genes, including F3 and IL8, were either directly and/or indirectly altered by miR-106b∼25 trsnsduction of which the expression of 661 gene was down-regulated and 331 genes were up-regulated as compared with untreated control (Supplemental Table 1). Through data mining we assessed whether the expression of these 992 genes are altered in del(7q) and non-del(7q) leiomyomas using the data sets reported by Hodge et al. (16). The analysis identified 226 of the 992 genes as differentially expressed (P < 0.05 cutoff) in matched del(7q) and non-del(7q) leiomyomas and in TF324 cells transuding miR-106b∼25 cluster (Fig. 2C and Supplemental Table 2; see Supplemental Fig. 2). The results indicated that miR-93/106b either directly and/or indirectly regulate the expression of a significant number of genes, including F3 and IL8, although many miR-93/106b target genes are also predicted targets of multiple miRNA and other regulatory mechanisms.
Fig. 2.
Lentiviral transduction of miR-106b∼25 cluster in spontaneously transformed leiomyoma cells (TF324). A, Green fluorescent protein expression (derived miR-106b∼25cluster expression) transduced after treatments with 10 μg/ml of doxycycline (DOX+) or without (Dox−) for 6 d and Western blot analysis of p21 (miR-93/106b target), p57 (miR-25 target), and F3 and β-actin used as a loading control (B). Note a significant reduction in the level of p21, p57, and F3 but not MCM7, which is coexpressed in the same pre-mRNA with miR-106b∼25cluster, in cells with gain of function of miR-106∼25. C, Treeview analysis of 226 genes differentially expressed in TF324 after miR-106∼25 transduction (+Dox 6d) and untreated control (Ctrl, −Dox) and the pattern of same genes derived from del(7q) and none-del(7q) leiomyomas (LYO-ND and LYO-DL, respectively) and myometrium (MYO). Each column represents the mean expression values from 11 matched tissues as described by Hodge et al. (16).
F3 and IL-8 are differentially expressed in leiomyomas
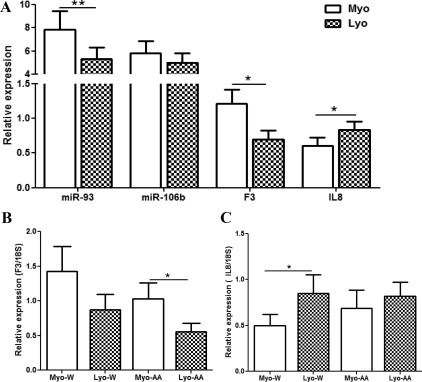
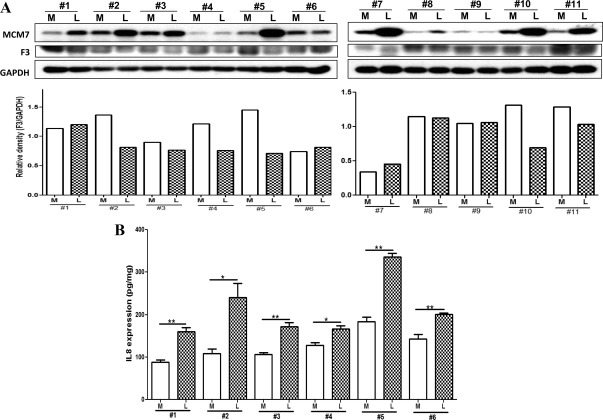
Because F3 and IL-8 were identified as possible targets of miR-93/106b, we first determined their expression at tissue levels using all leiomyomas and paired myometrium from the above cohorts. The analysis also indicated a considerable variation in the mean expression level of F3 and IL8 among leiomyomas and myometrium in each cohort (Supplemental Fig. 3) as shown based on the 1.3-fold change cutoff ratios for each leiomyoma over its own paired myometrium (Table 1). Comparatively, leiomyomas expressed lower levels of F3 and elevated levels of IL8, with IL8 levels exhibiting an inverse relationship with miR-93 expression (P < 0.05; Fig. 3A). However, F3 expression was elevated in leiomyomas from luteal phase and it exhibited an inverse relationship with miR-93 expression, in contrast to lower F3 levels in tissues from follicular phase (P = 0.0093) and abnormal uterine bleeding (Supplemental Fig. 3). A lower F3 and elevated IL8 were also detected in leiomyomas from both African-Americans and Caucasians (P < 0.05) as compared with myometrium (Fig. 3, B and C). Immunoblot analysis further indicated lower levels of F3 (Fig. 4A) but elevated IL8 (Fig. 4B) and MCM7 (Fig. 4A) productions in leiomyomas as compared with paired myometrium. The results provided support for the expression of IL8 and F3 in leiomyomas; however, at the tissue level, only IL8, but not F3, expression displayed an inverse relationship with miR-93 expression.
Fig. 3.
Relative expression (mean ± sem) of miR-93, miR-106b, F3, and IL8 in leiomyoma (LYO) and paired myometrium (MYO) from the untreated group (n = 41) and the expression of F3 (B) and IL8 (C) in paired tissues from Caucasian (W; n = 18) and African-Americans (AA; n = 20). The data were analyzed using a nonparametric Student t test (*, P < 0.05 and **, P < 0.01, indicating significant difference as shown by the corresponding lines for each paired tissues).
Fig. 4.
Western blot analysis of MCM7, F3, and glyceraldehyde-3-phosphate dehydrogenase (GAPDH) (loading control) (A) with the F3 band densities shown below as well as IL8 levels determined by ELISA (B) of tissue extracts prepared from 11 leiomyoma (L) and paired myometrium (M) from the untreated group. The results are presented as mean ± sem and analyzed using nonparametric student t test (*, P < 0.05; **, P < 0.01, indicating a significant difference and shown by the corresponding lines for each paired tissues).
F3 and IL8 are direct targets of miR-93 and miR-106b
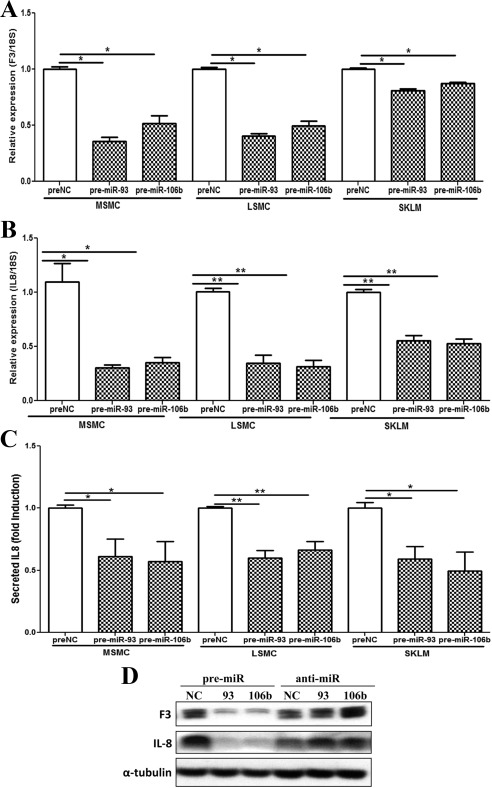
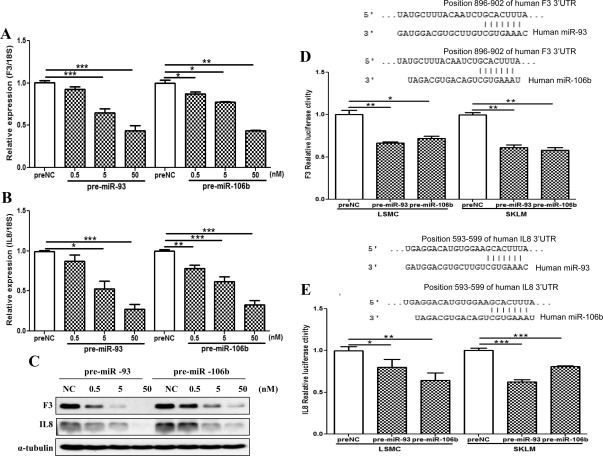
To provide experimental evidence that F3 and IL8 are potential targets of miR-93 and/or miR-106b, we used isolated MSMC and LSMC and SKLM-S1 and found that their gain of functions (pre-miR-93 and pre-miR-106b transfection) significantly repressed F3 and IL8 at mRNA (Fig. 5, A and B) and protein (Fig. 5, C and D) levels, respectively. The regulatory function of miR-93 and miR-106b on F3 and IL8 expression occurred dose dependently (Fig. 6, A–C) and through direct interactions with their respective 3′-untranslated regions (UTR) as demonstrated by luciferase reporter assay in LSMC and SKLM-S1 (Fig. 6, D and E).
Fig. 5.
Relative expression of F3 and IL8 (mean ± sem) in MSMC, LSMC, and SKLM-S1 transfected with pre-miR-93, pre-miR-106b (gain of function), and preNC (NC) determined by QRT-PCR (A and B), Western blot analysis (D), and ELISA (IL-8, C). The assays were performed using three to five sets of independent cell preparation, with QRT-PCR and ELISA assayed in triplicates, and α-tubulin was used as loading control for Western blotting. The data were analyzed using a nonparametric Student t test [*, P < 0.001 (A and C); *, P < 0.01 (B); *, P < 0.05 and **, P < 0.01 (D), indicated by the _corresponding lines_].
Fig. 6.
Dose-dependent influence of miR-93 and miR-106b gain of function (pre-miR transfected) on F3 (A) and IL8 (B) mRNA and protein (C) expression in LSMC as compared with control (preNC). The assays were performed using four sets of independent cell preparations with QRT-PCR assayed in triplicates, and in Western blotting, α-tubulin was used as a loading control. The data are presented as mean ± sem and analyzed using a nonparametric Student t test (*, P < 0.05, **, P < 0.01, ***, P < 0.001, as indicated by the corresponding lines). D and E, Firefly luciferase assay with pZEX-MT01 and pGL3 constructs carrying a 3′UTR fragments of F3 and IL8, respectively. LSMC and SKLM-S1 were cotransfected with firefly luciferase reporters, Renilla luciferase transfection control plasmid (in case of IL8), pre-miR-93, pre-miR-106b, or preNC. The ratio of firefly to Renilla was determined and reported as relative luciferase activity as compared with empty vector. The results are presented as the average fold change from three sets of independent experiments performed in duplicates and analyzed using a nonparametric Student t test [*, P < 0.01, **, P < 0.001 (D), and *, P < 0.05, **, P < 0.01, and ***, P < 0.001 (E) and shown by the _corresponding lines_]. The sequence alignment of the miR-93 and miR-106b seed regions and the F3 and IL-8 mRNA target sits at their 3′UTR are shown at the top of each graph.
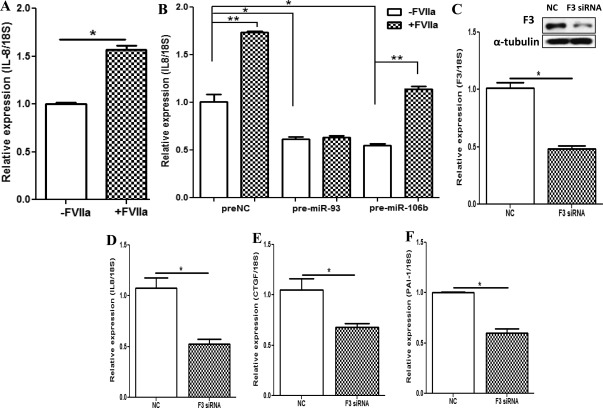
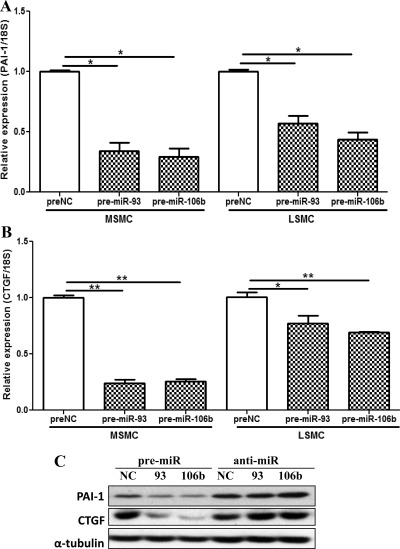
Because F3 is known to regulate IL8 expression in other cell types, we examined whether gain of function of miR-93 or miR-106b altered the expression of F3 downstream-regulated genes, including IL8 expression. As shown in Fig. 7, treatment of LSMC with factor Vlla (FVIIa), which activates the F3 pathway, significantly increased the expression of IL8 (Fig. 7A), which was blocked in cells overexpressing miR-93 and to lesser the extent with miR-106b overexpression (Fig. 7B). In addition to IL8, several other genes, including CTGF, PAI-1, uPA, and PTX3, have been identified as downstream targets of F3 in other cell types (33, 34). Using LSMC, we further demonstrated that in a time-dependent manner, activation of F3 by FVIIa increased (Supplemental Fig. 4, A–C), whereas siRNA silencing of F3 expression significantly decreased the expression of IL8, CTGF, and PAI-1 (P < 0.05; Fig. 7, C–F). As a proof of principle, we further showed that gain of function of miR-93 and miR-106b in MSMC and LSMC also repressed the expression of CTGF and PAI-1 (Fig. 8, A–C) as well as uPA and PTX3 (Supplemental Fig. 5, A and B). Collectively these results provided experimental evidence that F3 and IL8 are direct targets of miR-93/106b and further demonstrated their regulatory functions through _F3_-mediated actions on the expression of IL8, CTGF, and PAI-1, and possibly uPA and PTX3, which requires further investigation.
Fig. 7.
The expression of IL8 in LSMC after treatment with FVIIa (+FVIIa), which activates the endogenous F3 pathway (A) as compared with the untreated control (−FVlla) and LSMC transfected with pre-miR-93 and pre-miR-106b as compared with control (preNC transfected) treated with and without FVIIa (B). The assays were performed in two sets of independent experiments in triplicate and the data are reported as mean ± sem and analyzed by a nonparametric Student t test [*, P < 0.001 (A), *, P < 0.05 and **, P < 0.01 (B) as indicated by the _corresponding lines_]. C–F, The influence of F3 silencing (siRNA transfection) in LSMC on the expression of F3 (C) and downstream genes IL8 (D), CTGF (E), and PAI-1 (F). Western blot analysis of F3 in LSMC after transfection with F3 siRNA and scrambled siRNA (NC) is shown as an insert in C. The assays were performed in three independent cell preparations, and the results are reported as mean ± sem and analyzed by a nonparametric Student t test [*, P < 0.001 (C), *, P < 0.01 (D) *, P < 0.05 (E), and *, P < 0.001 (F) as compared with NC as indicated by the _corresponding lines_].
Fig. 8.
The expression of PAI-1 (A) and CTGF (B) in MSMC and LSMC after transfection with pre-miR-93, pre-miR-106b, and the corresponding controls (preNC) determined using QRT-PCR (A and B) and Western blot analysis (C). The assays were performed using four independent sets of cell preparations and the results are reported as mean ± sem and analyzed by a nonparametric Student t test [*, P < 0.001 (A) and P < 0.05 (B), and **, P < 0.001 (B) as indicated by the _corresponding lines_].
Gain of function of miR-93 and miR-106b alters LSMC viability, proliferation, and caspase activity
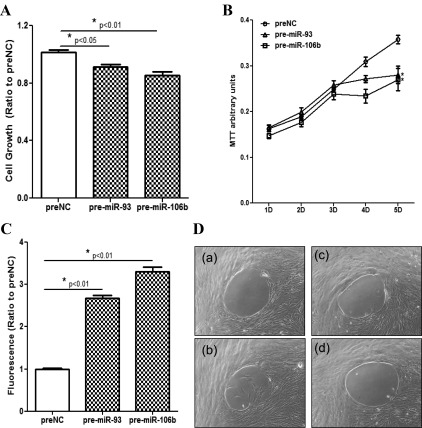
To further assess miR-93/106b regulatory actions in leiomyomas, we examined the influence of their gain of function on LSMC cell growth and migration. As shown in Fig. 9, the overexpression of miR-93 and miR-106b in LSMC in a time-dependent manner decreased the rate of their cellular viability, proliferation, but increased apoptosis as determined by a 3-(4,5-dimethylthiazol-2-yl)-2,5-diphenyltetrazolium bromide (MTT) assay (Fig. 9A), cell counting (Fig. 9B), and caspase activity (Fig. 9C), respectively, as well as their migration (proliferation) (Fig. 9D). The inhibitory action of miR-93/106b on LSMC viability was mimicked by F3 and IL8 siRNA transfection (Supplemental Fig. 6B); in contrast, the rate of the cell migration (proliferation) was increased by the F3 and IL8 treatments (Supplemental Fig. 6A). The results provided additional supports for miR-93/106b and their target genes, F3 and IL8, regulatory functions in the cellular activities associated with leiomyoma growth and regression.
Fig. 9.
The influence of gain of function of miR-93 and miR-106b and corresponding controls (preNC) on the LSMC growth rate (A), viability (B), and caspase-3/7 activity (C). The cell growth and caspase-3/7 activity were determined after 4 d of incubation, and the rate of cell viability was determined using an MTT assay on the indicated days with culture media changed every 2 d. D (a-d), Photomicrographs of LSMC transfected with pre-miR-93/106b or the corresponding negative controls (preNC) for 96 h, and the LSMC migration was determined for the last 24 h after the biocompatible gels were removed. The images represent preNC-transfected cells at 0 h (a) and 24 h (b) and cells transfected with pre-miR-93 (c) or pre-miR-106b (d). The cell growth, viability, caspase activity, and migration assays were performed, at least in triplicates, using three independent cell preparations. The results are shown as mean ± sem and analyzed using a nonparametric Student t test (*, P < 0.01 as compared with preNC).
Discussion
In the present study, we demonstrated the expression of miR-93/106b in leiomyoma and matched myometrium from untreated and patients exposed to hormonal therapies and their regulatory functions on the expression of specific target genes in isolated MSMC, LSMC, and SKLM-S1. Because the miR-93/106b genome resides at the interon 13 of the MCM7 genome and are cotranscribed in the same pre-mRNA, we also found their coexpression in the above tissues; however, their differential expression (lower miR-93, no change in miR-106b, and elevated MCM7) suggests possible posttranscriptional regulations, which requires detailed investigation. Through Dox-inducible lentiveral vector carrying miR-106b∼25 cluster and microarray analysis, we identified F3 and IL8, among other genes, as their possible direct and/or indirect targets. We confirmed and validated that miR-93/106b are expressed and directly regulated F3 and IL8 expression in MSMC, LSMC, and SKLM-S1 through interactions with their respective 3′UTR and further identified that miR-93/106b indirectly through F3-mediated signaling regulated the expression of CTGF and PAI1.
We confirmed that F3 and IL8 are expressed in leiomyomas and paired myometrium and as expected identified an inverse relationship between miR-93 and IL8 but not with F3 expression. Because miRNA through mechanisms involving mRNA decay and translational repression regulate the expression of their target genes, using ELISA and immunoblot analysis, we detected a higher level of IL-8 production but either equal or lower F3 expression in leiomyomas as compared with myometrium. Although our in vitro data clearly identified F3 as a direct target of miR-93/106b, at tissue level, a lower expression of F3 mRNA and protein, at least in leiomyomas, suggests that F3 is either not a major target of miR-93/106b, regulated by other miRNA, i.e. a member of the miR-17 family, miR-128, miR-148, and miR-19, which are predicted to target F3, or influenced by regulatory mechanisms of other gene products. Comparative analysis of miR-93, F3, and IL8 expression in each paired tissue (Table I) also suggested that their regulatory interaction between miR-93 may be tissue dependent, at least in leiomyomas, which are known to differ in their molecular environments and growth patterns. As such, a previous array profiling has identified a menstrual cycle-, tumor size-, and ethnic-dependent expression of miRNA in leiomyomas (35). In addition, ovarian steroids have been reported to regulate the expression of miRNA and processing machinery in several steroid-sensitive cells and tissues, including myometrium (36–38). Our results in leiomyoma and myometrium indicated a limited alteration in the mean expression of miR-93/106b, F3, and IL8 due to a difference in hormonal milieu, although the elevated expression of MCM7 during the luteal phase and suppression as a results of exposure to Depo-Provera and OCP imply possible hormonal regulation of MCM7. Taking racial origin of the tissues into consideration also revealed no significant difference in miR-93/106b, MCM7, F3, and IL8 expression in leiomyomas from African-Americans as compared with Caucasians, although individual difference was detected in their expression.
The biological significance of MCM7 in the genesis of leiomyoma is unknown and awaits further investigation; however, the elevated expression of MCM7 has been directly associated with increased cell proliferation, migration, and transformation as well as a progression of various malignancies (39, 40). Through microarray analysis, we identified the expression of many genes, either directly and/or indirectly regulated by miR-106b-25 cluster transduction, including p21 and p57, which are known to regulate cell cycle progression. miR-93/106b have been predicted to target the expression of many genes of which p21, p57, BIM, E2F1, PTEN, integrin_-β_8, VEGF-A, FUS1, and TGF_-β_RII have been experimentally validated as their direct targets in several cell types (25, 26, 41–45). In addition to F3 and IL8, the products of these genes are known to regulate cell cycle progression, migration, transformation, and angiogenesis, and their regulation by miR-93/106b along with regulatory function of MCM7 could play a key role in leiomyoma growth and regression. As such, we demonstrated that gain of function of miR-93/106b or silencing of F3 or IL8 expression altered the rate of LSMC proliferation, caspase-3/7 activity, and migration. Although the migratory response of LSMC to gain of function of miR-93/106b or silencing of F3 and IL8 expression was intriguing, we considered the migratory pattern to represent cell proliferation similar to what occurs in response to injury during wound healing rather than metastatic migration because leiomyomas are nonmetastatic benign tumors. Collectively these observations provided supports for miR-93/106b regulatory function on leiomyoma growth and regression, mediated through regulation of F3, IL8, and possibly other genes including p21, p57, BIM, E2F1, PTEN, VEGFA, and TGF_-β_RII.
To our knowledge there is no report demonstrating the expression of F3 in leiomyomas for comparative analysis. However, increased IL8 immunoreactive protein has been reported in myometrium adjacent to leiomyomas (46). The endometrial expression and activation of F3 has been reported to increase endometrial cell proliferation and IL6 and IL8 secretion (34). In addition, increased expression of IL8 and F3 has been associated with heavy menses and abnormal uterine bleeding in progestin-only-contraceptives users (47–49). Considering the _F3_-induced activation of prothrombin to thrombin is a key step in coagulation cascades (50) and regulated by proinflammatory mediators such as IL8, miR-93/106b regulation of either F3 and/or IL8 may have a profound biological and clinical significance, specifically in women with symptomatic leiomyomas experiencing abnormal bleeding. In addition, we found that miR-93 and miR-106b through F3-mediated action also regulated IL8 expression in LSMC; however, gain of function of miR-93 was more effective in repressing IL8 as compared with miR-106b. The functional significance of this finding may reflect the degree of regulatory function of different miRNA on their common target genes as well as their downstream signaling as illustrated for F3 regulation of IL8 and possibly other target genes.
We explored this possibility and identified PAI-1 and CTGF as indirect targets of miR-93/106b, which was mediated through _F3_-regulatory action. Interestingly, the PAI-1 genome also resides at Chr7q22, implying that any chromosomal rearrangement/deletion alters not only PAI-1 expression but also miR-93/106b indirect regulatory function of PAI-1. The potential regulatory significance of this finding relates to the importance of PAI-1 as a key component of fibrinolytic system, of which plasminogen activator and plasmin, among many of their functions, regulate extracellular matrix remodeling and releasing of various extracellular matrix-bound molecules, more specifically _TGF_-β and CTGF, which are known to serve as key mediators of inflammation, angiogenesis, and tissue fibrosis (51–53). Previous studies have reported the elevated expression of PAI-1 in leiomyomas (54, 55), and evidence suggests that the profibrotic action of _TGF_-β is mediated through the induction of CTGF (51, 56). Several components of the fibrinolytic system, including uPA and PAI-1, are also regulated by F3, IL8, and _TGF_-β and our preliminary observations indicated uPA and PTX3 as possible targets of miR-93/106b. PTX3 plays a key role in inflammation response and angiogenesis by inhibiting fibroblast growth factor 2-mediated action and F3 activity (57–60).
In addition to F3 and IL8 through data mining, we identified a significant number of other genes as possible direct and indirect targets of miR-106b∼25 in TF324 cells, also expressed in leiomyomas with and without del7q22 (16). These results further illustrated the potential consequence of chromosomal rearrangements, such as del7q22, not only on the expression of many genes located at these regions but also their downstream target genes with functional association with cell cycle progression, apoptosis, inflammation, angiogenesis, and tissue turnover, influencing the outcome of leiomyoma pathogenesis. However, many downstream genes targeted by miR-93/106b are also regulated by multiple miRNA as well as the byproduct of other genes, resulting in the multilayer regulatory function that may compensate for the loss of del7q22 only if any of the gene products in this region are functionally redundant.
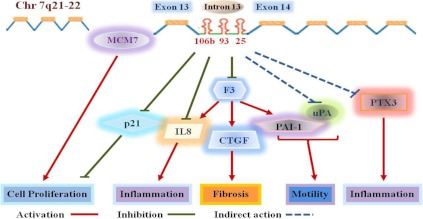
In conclusion, using a large cohort of leiomyoma and paired myometrium from untreated and patients exposed to different hormonal therapies, we demonstrated that miR-93, MCM7, F3, and IL8 are differentially expressed in leiomyomas with limited racial or hormonal influence on their expression. Although the expression of F3 did not display an inverse relation with miR-93/106b expression at the tissue level, in MSMC, LSMC, and SKLM-S1, miR93/106b directly targeted F3 expression and indirectly through F3-mediated actions regulated IL8, CTGF, PAI-1, uPA, and PTX3 expression and altered their cellular viability and caspase activity. Because the product of these genes are known to regulate diverse cellular activities, including cell cycle progression, inflammatory response, angiogenesis, and tissue turnover, we propose (Fig. 10) that miR-93/106b through direct and/or indirect regulation of these genes play a central role in the genesis of leiomyomas and possibly de novo development of leiomyosarcoma from myometrium. Although the results presented in this study increased our understanding of miR-93/106b expression and function, further investigation is required to address the regulatory function of MCM7 and other miR-93/106b target genes in pathogenesis of leiomyoma and other uterine disorders.
Fig. 10.
Schematic presentation of miR-106b∼25 cluster and their host gene, MCM7, expression with their posttranscriptional regulation as well as specific genes either directly (p21, F3, and IL8) or indirectly through the regulation of F3 (CTGF, PAI-1, uPA, PTX3) regulated by miR-106/93 in myometrium and leiomyoma cells. Through such regulatory functions and altered expression due to the chromosomal rearrangement of 7q22, miR-106/93 could influence the cell growth, migration, inflammation, and tissue turnover, events with central roles in leiomyoma development, growth, and associated symptoms.
Materials and Methods
Tissues
Portions of leiomyoma and matched myometrium were collected from patients (n = 63) scheduled to undergo hysterectomy for indications related to symptomatic tumors. The patients' ages ranged from 20 to 59 yr (median 42 ± 7.968 yr). Of these patients, 41 were not taking any hormonal medications for the previous 3 months before surgery, and based on their last menstrual periods, they were from the follicular (n = 12) and luteal (n = 17) phases of the menstrual cycle or experiencing abnormal uterine bleeding (n = 12). Patients who were exposed to hormonal therapies included GnRHa (n = 6), Depo-Provera (n = 12), and those taking OCP (n = 3). All leiomyomas used in this study were 3–5 cm in diameter and were collected at the University of Florida-affiliated Shands Hospital, with prior approval from the institutional review board. Immediately after collection the tissues were snapped frozen and kept in liquid nitrogen for further analysis or used for isolation of their smooth muscle cells.
Isolation and culture of leiomyoma and myometrial smooth muscle cells
Small portions of leiomyoma and matched myometrium from untreated group (n = 15) were used for the isolation of LSMC and MSMC as previously described (61). Briefly, LSMC and MSMC were cultured in DMEM supplemented with 10% fetal bovine serum until reaching confluence with a change of media every 2–3 d. A spontaneously transformed LSMC (TF324) derived from the transformation of LSMC at the fourth passage in our laboratory and a human leiomyosarcoma cell line, SKLM-S1, were also cultured in supplemented DMEM and used in some experiments. The TF324 and isolated MSMC (M324) were characterized using small tandem repeat profiling by Molecular Diagnostics Laboratory at the Dana-Farber Cancer Institute (Boston, MA) (Supplemental Table 3). All supplies for the isolation and culturing of these cells were purchased from Sigma-Aldrich (St. Louis, MO), Invitrogen (Carlsbad, CA), and Fisher Scientific (Atlanta, GA).
Quantitative real-time PCR (QRT-PCR)
Total RNA was extracted from paired tissues and cell cultures using Trizol (Invitrogen). The quantity and quality of the isolated RNA were determined using an ND-1000 spectrophotometer (NanoDrop Technologies, Wilmington, DE), and 10 ng (for miRNA) or 2 μg of total RNA was reverse transcribed using specific stem-loop primer for miR-93, miR-106b (Ambion, Foster City, CA), or a random primer with the high capacity cDNA reverse transcription kit (Applied Biosystems, Carlsbad, CA), respectively, according to the manufacturer's guidelines. Quantitative RT-PCR was carried out using a TaqMan or SYBR gene expression master mix, TaqMan miRNA, or TaqMan gene expression assays (MCM7 and PAI-1) (Applied Biosystems). Reactions were incubated for 10 min at 95 C followed by 40 cycles of 15 sec at 95 C and 1 min at 60 C, and the level of mRNA and miRNA expression was determined using an Applied Biosystems 7300 detection system with 18S and RNU6B used for normalization, respectively. All reactions were run in triplicate, and the relative expression was analyzed with the comparative cycle threshold method (2-ΔΔCT) according to the manufacturer (Applied Biosystems). Primers for the SYBR system are depicted in Supplemental Table 4.
Gain of function of miR-93 and miR-106b
MSMC, LSMC, and SKLM-S1 were seeded in six-well plates and cultured until reaching 50% confluence. The cells were then transfected with 50 nm of 2′-_O_-methoxyethyl (modified pre-miR-93, pre-miR-106b, and the corresponding pre-miR negative control (preNC) (Applied Biosystems) for 96 h using the PureFection transfection reagent (System Biosciences, Inc., Mountain View, CA) according to the manufacturer's protocol. Total RNA and proteins isolated from these cells were subjected to real-time PCR and Western blot analysis, respectively.
Activation and inhibition of F3 using FVIIa and siRNA
MSMC and LSMC were seeded in six-well plates and cultured until reaching 50% confluence. The cells were washed in serum-free media and then treated with 50 nm of FVIIa (Enzyme Research Laboratories, Inc., South Bend, IN) or 50 nm of F3 siRNA (Applied Biosystems) for the indicated time period. Total RNA and protein were isolated from the above experiments and subjected to QRT-PCR and Western blot analysis, respectively, and culture conditioned media were collected and stored at −80 C until use for ELISA.
Western blot analysis
Western blot analysis was carried out as previously described (62, 63). Briefly, total protein was isolated from the tissues and cells using a radioimmunoprecipitation assay (RIPA) lysis buffer (Cell Signaling Technology, Inc., Danvers, MA). The tissue and cell lysates were centrifuged, their supernatants were collected, and their total protein contents were determined using a bicinchoninic acid assay (BCA) protein assay kit (Pierce, Rockford, IL). A total of 30–50 μg of protein was then subjected to SDS-PAGE. After the transfer into polyvinylidene difluoride membranes, the blots were blocked and incubated with an antibody against F3, p21, p57, MCM7, CTGF, and IL-8 (Santa Cruz Biotechnology, Santa Cruz, CA) and PAI-1 (Abcam, Inc. Cambridge, MA) at 1:1000, 1:2500, 1:1000, 1:5000, 1:1000, 1:1000, and 1:5000 dilutions, respectively, with β-actin (Sigma), glyceraldehyde-3-phosphate dehydrogenase (Cell Signaling Technology), or α-tubulin (Abcam) serving as loading control. The membranes were exposed to horseradish peroxidase-labeled secondary antiserum, and the immunoreactive proteins were detected with the enhanced chemiluminescence Western blotting substrate (Fisher Scientific, Inc., Pittsburgh, PA).
Enzyme-linked immunosorbent assay
Culture conditioned media, tissues extracts, and cell lysates collected from the above experiments were centrifuged, supernatants were collected, and their total protein content was determined by standard method. The IL-8 content of the supernatants was determined using the Quantikine human CXCL8/IL-8 ELISA kit (R&D Systems, Minneapolis, MN) with a limited detection of 31.2 pg/ml and a sensitivity of 7.5pg/ml. The level of IL-8 was reported as picograms per milligram of protein or fold change compared with control experiments.
Luciferase reporter assay
Subconfluent MSMC, LSMC, and SKLM-S1 were transiently cotransfected with pre-miR-93, pre-miR-106b, or preNC and a luciferase reporter plasmid (1 μg/well) containing 3′UTR sequences of F3 (GeneCopoeia, Inc. Rockville, MD) or IL8 [gift from Dr. R.G. Pestell (64)]. For IL8 3′UTR reporter assay, the cells were cotransfected with a pRL-TK plasmid (Promega, Madison, WI) encoding Renilla luciferase (0.2 μg/well) as a control for assessing the transfection efficiency. Firefly and Renilla luciferase activities were measured using the dual-luciferase reporter assay system (Promega) according to the manufacturer's instruction, with some modification for measuring F3 3′UTR luciferase activity according to the recommendation from GeneCopoeia. Firefly luciferase activity was normalized to Renilla luciferase activity, and the level of induction was reported as the mean ± sem and compared with a ratio in cells transfected with preNC.
Cell viability assay
LSMC were seeded at 1000 cells/well in 96-well plates and cultured for 48 h. The cells were then transfected with preNC, pre-miR-93, and pre-miR-106b or with F3 and IL-8 siRNA as described above. The rate of cell viability was determined using the MTT assay at the indicated time. Briefly, MTT (Sigma) was added into the culture medium at a final concentration of 1 mg/ml and incubated for 2 h at 37 C. The medium was aspirated, and the formazan product was solubilized with dimethyl sulfoxide and the absorbance at 570 nm was determined and subtracted from the absorbance at 630 nm (background) for each well. The assay was performed in six replicates per condition and repeated four times using two independent cell preparations. The result was expressed as raw OD values.
Cell growth analysis
LSMC were seeded at 3.5 × 10⁴ cells/well in six-well plates and incubated for 48 h. The cells were then transfected with preNC, pre-miR-93, and pre-miR-106b, as described above. Cell numbers were counted 4 d after transfection, and the ratio of cell growth was calculated by normalizing the cell number to that of control. The result shown is the average from three sets of independent experiments in triplicates.
Caspase-3/7 activity assay
LSMC were seeded at 1000 cell/well in 96-well plates and cultured for 48 h. The cells were then transfected with preNC, pre-miR-93 and pre-miR-106b as described above and caspase-3/7 activity was determined using the Apo-One homogeneous caspase-3/7 assay (Promega) after the indicated time periods according to the manufacturer's protocol. The Apo-One caspase-3/7 reagent was added in a 1:1 ratio with the medium, and the rate of caspase-3/7 activity was determined by measuring the fluorescence using a multiplate reader (Molecular Devices, Inc., Sunnyvale, CA) at an excitation of 485 nm and an emission of 527 nm.
Cell-migration/wound-healing assay
The cell-migration activity was determined using a Radius 24-well assay kit (Cell Biolabs, San Diego, CA) consisting of a circular biocompatible gel in each well according to the manufacturer's instructions. Briefly, LSMC were seeded in the assay plates and cultured for 48 h and then transfected with pre-miR-93, pre-miR-106b, and preNC as described above. After 48 h of incubation, the biocompatible gels were removed and the cells were incubated for additional 24 h, and the images of the migratory cells were captured using an Olympus IX70 microscope equipped with digital camera (Olympus Inc., Melville, NY).
Lentiviral transduction of miR-25/93/106b cluster
Briefly, TF324 cells were seeded in 24-well plates and after 24 h transfected with the Dox-inducible lentiviral construct carrying miR-106b∼25 cluster (System Biosciences) according to the manufacturer's protocol. After 48 h of incubation, the cells were either treated with Dox (10 μg/ml) or untreated (−Dox) and incubated for 2, 4, and 6 d, and total RNA and protein were isolated and subjected to QRT-PCR and Western blot analysis, respectively. In addition, total RNA isolated from cells incubated for 6 d was subjected to microarray gene expression profiling.
Gene expression microarray and bioinformatic analysis
Total RNA isolated from TF324 cells transfected with Dox-inducible lentiviral construct carrying the miR-106b∼25 cluster with and without Dox treatments for 6 d was subjected to gene expression profiling using the Human Ref-12 version 3 Expression BeadChip (Illumina, Inc. San Diego, CA) consisting of 47,000 oligonucleotide probe sets representing 28,688 transcripts. The arrays were processed at the University of Florida Interdisciplinary Center for Biotechnology Research according to the manufacturer's protocol. The expression values were background subtracted, globally normalized using BeadStudio version 1.5.1.3 (Illumina), and the differentially expressed genes were selected based on the 1.5 fold change cutoff.
Data mining
A microarray data set from 11 matched del(7q) and non-del(7q) leiomyomas reported by Hodge et al. (16) were retrieved and used for data mining. The expression value of the differentially expressed genes identified in TF324 transfected with Dox-inducible lentiviral construct carrying the miR-106b∼25 cluster were retrieved from the gene array data sets in del(7q) and non-del(7q) leiomyomas and myometrium reported by Hodge et al. (16) using Microsoft Access (Richmond, CA). The gene expression values identified in these cohorts were sorted based on P < 0.05 and the 1.5-fold change cutoff and subjected to cluster and tree-view analysis and Ingenuity Pathways analysis (Ingenuity Systems, Redwood City, CA).
Statistical analysis
Whenever appropriate, the results were reported as mean ± sem. All in vitro experiments were performed using paired MSMC and LSMC from at least three different patients. Comparisons between two or among groups were made using a nonparametric Student t test and ANOVA followed by a post hoc multiple comparison, respectively. A P < 0.05 was considered statistically significant.
Supplementary Material
Supplemental Data
Supplemental Data
Acknowledgments
This work was supported by Grants HD37432 and HD58664 from the _Eunice Kennedy Shriver_National institute of Child Health and Human Development, National Institutes of Health.
Disclosure Summary: The authors declare no conflict of interest.
Footnotes
Abbreviations:
Dox
Doxycycline
F3
tissue factor
FVIIa
factor Vlla
GnRHa
GnRH agonist
LSMC
leiomyoma smooth muscle cell
miRNA
microRNA
MSMC
myometrial smooth muscle cell
MTT
3-(4,5-dimethylthiazol-2-yl)-2,5-diphenyltetrazolium bromide
OCP
oral contraceptive
preNC
pre-miR negative control
QRT-PCR
quantitative real-time PCR
siRNA
small interfering RNA
UTR
untranslated region.
References
- 1.Kim YK, Heo I, Kim VN. 2010. Modifications of small RNAs and their associated proteins. Cell 143:703–709 [DOI] [PubMed] [Google Scholar]
- 2.Medina PP, Slack FJ. 2008. microRNAs and cancer: an overview. Cell Cycle 7:2485–2492 [DOI] [PubMed] [Google Scholar]
- 3.Ruvkun G. 2008. The perfect storm of tiny RNAs. Nat Med 14:1041–1045 [DOI] [PubMed] [Google Scholar]
- 4.Almeida MI, Reis RM, Calin GA. 2011. MicroRNA history: discovery, recent applications, and next frontiers. Mutat Res 717:1–8 [DOI] [PubMed] [Google Scholar]
- 5.Cortez MA, Ivan C, Zhou P, Wu X, Ivan M, Calin GA. 2010. microRNAs in cancer: from bench to bedside. Adv Cancer Res 108:113–157 [DOI] [PubMed] [Google Scholar]
- 6.Lee YS, Dutta A. 2009. MicroRNAs in cancer. Annu Rev Pathol 4:199–227 [DOI] [PMC free article] [PubMed] [Google Scholar]
- 7.Schickel R, Boyerinas B, Park SM, Peter ME. 2008. MicroRNAs: key players in the immune system, differentiation, tumorigenesis and cell death. Oncogene 27:5959–5974 [DOI] [PubMed] [Google Scholar]
- 8.Calin GA, Croce CM. 2006. MicroRNAs and chromosomal abnormalities in cancer cells. Oncogene 25:6202–6210 [DOI] [PubMed] [Google Scholar]
- 9.Pedeutour F, Quade BJ, Sornberger K, Tallini G, Ligon AH, Weremowicz S, Morton CC. 2000. Dysregulation of HMGIC in a uterine lipoleiomyoma with a complex rearrangement including chromosomes 7, 12, and 14. Genes Chromosomes Cancer 27:209–215 [PubMed] [Google Scholar]
- 10.Vanharanta S, Wortham NC, Laiho P, Sjöberg J, Aittomäki K, Arola J, Tomlinson IP, Karhu A, Arango D, Aaltonen LA. 2005. 7q deletion mapping and expression profiling in uterine fibroids. Oncogene 24:6545–6554 [DOI] [PubMed] [Google Scholar]
- 11.Ishwad CS, Ferrell RE, Hanley K, Davare J, Meloni AM, Sandberg AA, Surti U. 1997. Two discrete regions of deletion at 7q in uterine leiomyomas. Genes Chromosomes Cancer 19:156–160 [DOI] [PubMed] [Google Scholar]
- 12.Ligon AH, Morton CC. 2001. Leiomyomata: heritability and cytogenetic studies. Hum Reprod Update 7:8–14 [DOI] [PubMed] [Google Scholar]
- 13.Al-Hendy A, Salama SA. 2006. Catechol-_O_-methyltransferase polymorphism is associated with increased uterine leiomyoma risk in different ethnic groups. J Soc Gynecol Investig 13:136–144 [DOI] [PubMed] [Google Scholar]
- 14.Denschlag D, Bentz EK, Hefler L, Pietrowski D, Zeillinger R, Tempfer C, Tong D. 2006. Genotype distribution of estrogen receptor-α, catechol-_O_-methyltransferase, and cytochrome P450 17 gene polymorphisms in Caucasian women with uterine leiomyomas. Fertil Steril 85:462–467 [DOI] [PubMed] [Google Scholar]
- 15.Pan Q, Luo X, Chegini N. 2007. Genomic and proteomic profiling I: leiomyomas in African Americans and Caucasians. Reprod Biol Endocrinol 5:34. [DOI] [PMC free article] [PubMed] [Google Scholar]
- 16.Hodge JC, Park PJ, Dreyfuss JM, Assil-Kishawi I, Somasundaram P, Semere LG, Quade BJ, Lynch AM, Stewart EA, Morton CC. 2009. Identifying the molecular signature of the interstitial deletion 7q subgroup of uterine leiomyomata using a paired analysis. Genes Chromosomes Cancer 48:865–885 [DOI] [PMC free article] [PubMed] [Google Scholar]
- 17.Forsburg SL. 2008. The MCM helicase: linking checkpoints to the replication fork. Biochem Soc Trans 36:114–119 [DOI] [PubMed] [Google Scholar]
- 18.Fujioka S, Shomori K, Nishihara K, Yamaga K, Nosaka K, Araki K, Haruki T, Taniguchi Y, Nakamura H, Ito H. 2009. Expression of minichromosome maintenance 7 (MCM7) in small lung adenocarcinomas (pT1): prognostic implication. Lung Cancer 65:223–229 [DOI] [PubMed] [Google Scholar]
- 19.Li SS, Xue WC, Khoo US, Ngan HY, Chan KY, Tam IY, Chiu PM, Ip PP, Tam KF, Cheung AN. 2005. Replicative MCM7 protein as a proliferation marker in endometrial carcinoma: a tissue microarray and clinicopathological analysis. Histopathology 46:307–313 [DOI] [PubMed] [Google Scholar]
- 20.Ota T, Clayton AC, Minot DM, Shridhar V, Hartmann LC, Gilks CB, Chien JR. 2011. Minichromosome maintenance protein 7 as a potential prognostic factor for progression-free survival in high-grade serous carcinomas of the ovary 1. Mod Pathol 24:277–287 [DOI] [PMC free article] [PubMed] [Google Scholar]
- 21.Ren B, Yu G, Tseng GC, Cieply K, Gavel T, Nelson J, Michalopoulos G, Yu YP, Luo JH. 2006. MCM7 amplification and overexpression are associated with prostate cancer progression. Oncogene 25:1090–1098 [DOI] [PubMed] [Google Scholar]
- 22.Flynt AS, Lai EC. 2008. Biological principles of microRNA-mediated regulation: shared themes amid diversity. Nat Rev Genet 9:831–842 [DOI] [PMC free article] [PubMed] [Google Scholar]
- 23.Petrocca F, Visone R, Onelli MR, Shah MH, Nicoloso MS, de Martino I, Iliopoulos D, Pilozzi E, Liu CG, Negrini M, Cavazzini L, Volinia S, Alder H, Ruco LP, Baldassarre G, Croce CM, Vecchione A. 2008. E2F1-regulated microRNAs impair TGFβ-dependent cell-cycle arrest and apoptosis in gastric cancer. Cancer Cell 13:272–286 [DOI] [PubMed] [Google Scholar]
- 24.Ventura A, Young AG, Winslow MM, Lintault L, Meissner A, Erkeland SJ, Newman J, Bronson RT, Crowley D, Stone JR, Jaenisch R, Sharp PA, Jacks T. 2008. Targeted deletion reveals essential and overlapping functions of the miR-17 through 92 family of miRNA clusters. Cell 132:875–886 [DOI] [PMC free article] [PubMed] [Google Scholar]
- 25.Kan T, Sato F, Ito T, Matsumura N, David S, Cheng Y, Agarwal R, Paun BC, Jin Z, Olaru AV, Selaru FM, Hamilton JP, Yang J, Abraham JM, Mori Y, Meltzer SJ. 2009. The miR-106b-25 polycistron, activated by genomic amplification, functions as an oncogene by suppressing p21 and Bim. Gastroenterology 136:1689–1700 [DOI] [PMC free article] [PubMed] [Google Scholar]
- 26.Poliseno L, Salmena L, Riccardi L, Fornari A, Song MS, Hobbs RM, Sportoletti P, Varmeh S, Egia A, Fedele G, Rameh L, Loda M, Pandolfi PP. 2010. Identification of the miR-106b∼25 microRNA cluster as a proto-oncogenic PTEN-targeting intron that cooperates with its host gene MCM7 in transformation 3. Sci Signal 3:ra29. [DOI] [PMC free article] [PubMed] [Google Scholar]
- 27.Marsh EE, Lin Z, Yin P, Milad M, Chakravarti D, Bulun SE. 2008. Differential expression of microRNA species in human uterine leiomyoma versus normal myometrium. Fertil Steril 89:1771–1776 [DOI] [PMC free article] [PubMed] [Google Scholar]
- 28.Pan Q, Luo X, Chegini N. 2008. Differential expression of microRNAs in myometrium and leiomyomas and regulation by ovarian steroids. J Cell Mol Med 12:227–240 [DOI] [PMC free article] [PubMed] [Google Scholar] [Retracted]
- 29.Wang H, Mahadevappa M, Yamamoto K, Wen Y, Chen B, Warrington JA, Polan ML. 2003. Distinctive proliferative phase differences in gene expression in human myometrium and leiomyomata. Fertil Steril 80:266–276 [DOI] [PubMed] [Google Scholar]
- 30.Zavadil J, Ye H, Liu Z, Wu J, Lee P, Hernando E, Soteropoulos P, Toruner GA, Wei JJ. 2010. Profiling and functional analyses of microRNAs and their target gene products in human uterine leiomyomas. PLoS ONE 5:e12362. [DOI] [PMC free article] [PubMed] [Google Scholar]
- 31.Dahiya N, Sherman-Baust CA, Wang TL, Davidson B, Shih IeM, Zhang Y, Wood W, 3rd, Becker KG, Morin PJ. 2008. MicroRNA expression and identification of putative miRNA targets in ovarian cancer. PLoS ONE 3:e2436. [DOI] [PMC free article] [PubMed] [Google Scholar]
- 32.Inomata M, Tagawa H, Guo YM, Kameoka Y, Takahashi N, Sawada K. 2009. MicroRNA-17-92 down-regulates expression of distinct targets in different B-cell lymphoma subtypes. Blood 113:396–402 [DOI] [PubMed] [Google Scholar]
- 33.Albrektsen T, Sorensen BB, Hjortø GM, Fleckner J, Rao LV, Petersen LC. 2007. Transcriptional program induced by factor VIIa-tissue factor, PAR1 and PAR2 in MDA-MB-231 cells. J Thromb Haemost 5:1588–1597 [DOI] [PMC free article] [PubMed] [Google Scholar]
- 34.Krikun G, Lockwood CJ, Paidas MJ. 2009. Tissue factor and the endometrium: from physiology to pathology. Thromb Res 124:393–396 [DOI] [PubMed] [Google Scholar]
- 35.Wang T, Zhang X, Obijuru L, Laser J, Aris V, Lee P, Mittal K, Soteropoulos P, Wei JJ. 2007. A micro-RNA signature associated with race, tumor size, and target gene activity in human uterine leiomyomas. Genes Chromosomes Cancer 46:336–347 [DOI] [PubMed] [Google Scholar]
- 36.Bhat-Nakshatri P, Wang G, Collins NR, Thomson MJ, Geistlinger TR, Carroll JS, Brown M, Hammond S, Srour EF, Liu Y, Nakshatri H. 2009. Estradiol-regulated microRNAs control estradiol response in breast cancer cells. Nucleic Acids Res 37:4850–4861 [DOI] [PMC free article] [PubMed] [Google Scholar]
- 37.Luo X, Chegini N. 2008. The expression and potential regulatory function of microRNAs in the pathogenesis of leiomyoma. Semin Reprod Med 26:500–514 [DOI] [PMC free article] [PubMed] [Google Scholar]
- 38.Yamagata K, Fujiyama S, Ito S, Ueda T, Murata T, Naitou M, Takeyama K, Minami Y, O'Malley BW, Kato S. 2009. Maturation of microRNA is hormonally regulated by a nuclear receptor. Mol Cell 36:340–347 [DOI] [PubMed] [Google Scholar]
- 39.Lau KM, Chan QK, Pang JC, Li KK, Yeung WW, Chung NY, Lui PC, Tam YS, Li HM, Zhou L, Wang Y, Mao Y, Ng HK. 2010. Minichromosome maintenance proteins 2, 3 and 7 in medulloblastoma: overexpression and involvement in regulation of cell migration and invasion. Oncogene 29:5475–5489 [DOI] [PubMed] [Google Scholar]
- 40.Nishihara K, Shomori K, Fujioka S, Tokuyasu N, Inaba A, Osaki M, Ogawa T, Ito H. 2008. Minichromosome maintenance protein 7 in colorectal cancer: implication of prognostic significance. Int J Oncol 33:245–251 [PubMed] [Google Scholar]
- 41.Du L, Schageman JJ, Subauste MC, Saber B, Hammond SM, Prudkin L, Wistuba II, Ji L, Roth JA, Minna JD, Pertsemlidis A. 2009. miR-93, miR-98, and miR-197 regulate expression of tumor suppressor gene FUS1. Mol Cancer Res 7:1234–1243 [DOI] [PMC free article] [PubMed] [Google Scholar]
- 42.Fang L, Deng Z, Shatseva T, Yang J, Peng C, Du WW, Yee AJ, Ang LC, He C, Shan SW, Yang BB. 2011. MicroRNA miR-93 promotes tumor growth and angiogenesis by targeting integrin-β8 3. Oncogene 30:806–821 [DOI] [PubMed] [Google Scholar]
- 43.Long J, Wang Y, Wang W, Chang BH, Danesh FR. 2010. Identification of microRNA-93 as a novel regulator of vascular endothelial growth factor in hyperglycemic conditions. J Biol Chem 285:23457–23465 [DOI] [PMC free article] [PubMed] [Google Scholar]
- 44.Wang H, Liu J, Zong Y, Xu Y, Deng W, Zhu H, Liu Y, Ma C, Huang L, Zhang L, Qin C. 2010. miR-106b aberrantly expressed in a double transgenic mouse model for Alzheimer's disease targets TGF-β type II receptor. Brain Res 1357:166–174 [DOI] [PubMed] [Google Scholar]
- 45.Li Y, Tan W, Neo TW, Aung MO, Wasser S, Lim SG, Tan TM. 2009. Role of the miR-106b-25 microRNA cluster in hepatocellular carcinoma. Cancer Sci 100:1234–1242 [DOI] [PubMed] [Google Scholar]
- 46.Senturk LM, Sozen I, Gutierrez L, Arici A. 2001. Interleukin 8 production and interleukin 8 receptor expression in human myometrium and leiomyoma. Am J Obstet Gynecol 184:559–566 [DOI] [PubMed] [Google Scholar]
- 47.Liu X, Nie J, Guo SW. 2011. Elevated immunoreactivity to tissue factor and its association with dysmenorrhea severity and the amount of menses in adenomyosis. Hum Reprod 26:337–345 [DOI] [PubMed] [Google Scholar]
- 48.Lockwood CJ, Murk W, Kayisli UA, Buchwalder LF, Huang ST, Funai EF, Krikun G, Schatz F. 2009. Progestin and thrombin regulate tissue factor expression in human term decidual cells. J Clin Endocrinol Metab 94:2164–2170 [DOI] [PMC free article] [PubMed] [Google Scholar]
- 49.Runic R, Schatz F, Krey L, Demopoulos R, Thung S, Wan L, Lockwood CJ. 1997. Alterations in endometrial stromal cell tissue factor protein and messenger ribonucleic acid expression in patients experiencing abnormal uterine bleeding while using Norplant-2 contraception. J Clin Endocrinol Metab 82:1983–1988 [DOI] [PubMed] [Google Scholar]
- 50.Versteeg HH, Schaffner F, Kerver M, Petersen HH, Ahamed J, Felding-Habermann B, Takada Y, Mueller BM, Ruf W. 2008. Inhibition of tissue factor signaling suppresses tumor growth. Blood 111:190–199 [DOI] [PMC free article] [PubMed] [Google Scholar]
- 51.Chegini N. 2010. Proinflammatory and profibrotic mediators: principal effectors of leiomyoma development as a fibrotic disorder. Semin Reprod Med 28:180–203 [DOI] [PMC free article] [PubMed] [Google Scholar]
- 52.Pendurthi UR, Allen KE, Ezban M, Rao LV. 2000. Factor VIIa and thrombin induce the expression of Cyr61 and connective tissue growth factor, extracellular matrix signaling proteins that could act as possible downstream mediators in factor VIIa x tissue factor-induced signal transduction. J Biol Chem 275:14632–14641 [DOI] [PubMed] [Google Scholar]
- 53.Pendurthi UR, Tran TT, Post M, Rao LV. 2005. Proteolysis of CCN1 by plasmin: functional implications. Cancer Res 65:9705–9711 [DOI] [PMC free article] [PubMed] [Google Scholar]
- 54.Cheng Z, Xie Y, Dai H, Hu L, Zhu Y, Gong J. 2008. Unequal tissue expression of proteins from the PA/PAI system, myoma necrosis, and uterus survival after uterine artery occlusion. Int J Gynaecol Obstet 102:55–59 [DOI] [PubMed] [Google Scholar]
- 55.Sourla A, Polychronakos C, Zeng WR, Nepveu A, Kukuvitis A, Naud F, Koutsilieris M. 1996. Plasminogen activator inhibitor 1 messenger RNA expression and molecular evidence for del(7)(q22) in uterine leiomyomas. Cancer Res 56:3123–3128 [PubMed] [Google Scholar]
- 56.Leask A. 2010. Potential therapeutic targets for cardiac fibrosis. Circ Res 106:1675–1680 [DOI] [PubMed] [Google Scholar]
- 57.Inforzato A, Baldock C, Jowitt TA, Holmes DF, Lindstedt R, Marcellini M, Rivieccio V, Briggs DC, Kadler KE, Verdoliva A, Bottazzi B, Mantovani A, Salvatori G, Day AJ. 2010. The angiogenic inhibitor long pentraxin PTX3 forms an asymmetric octamer with two binding sites for FGF2. J Biol Chem 285:17681–17692 [DOI] [PMC free article] [PubMed] [Google Scholar]
- 58.Napoleone E, Di Santo A, Bastone A, Peri G, Mantovani A, de Gaetano G, Donati MB, Lorenzet R. 2002. Long pentraxin PTX3 upregulates tissue factor expression in human endothelial cells: a novel link between vascular inflammation and clotting activation. Arterioscler Thromb Vasc Biol 22:782–787 [DOI] [PubMed] [Google Scholar]
- 59.Norata GD, Marchesi P, Pulakazhi Venu VK, Pasqualini F, Anselmo A, Moalli F, Pizzitola I, Garlanda C, Mantovani A, Catapano AL. 2009. Deficiency of the long pentraxin PTX3 promotes vascular inflammation and atherosclerosis. Circulation 120:699–708 [DOI] [PubMed] [Google Scholar]
- 60.Varani S, Elvin JA, Yan C, DeMayo J, DeMayo FJ, Horton HF, Byrne MC, Matzuk MM. 2002. Knockout of pentraxin 3, a downstream target of growth differentiation factor-9, causes female subfertility. Mol Endocrinol 16:1154–1167 [DOI] [PubMed] [Google Scholar]
- 61.Chegini N, Ma C, Tang XM, Williams RS. 2002. Effects of GnRH analogues, 'add-back' steroid therapy, antiestrogen and antiprogestins on leiomyoma and myometrial smooth muscle cell growth and transforming growth factor-β expression. Mol Hum Reprod 8:1071–1078 [DOI] [PubMed] [Google Scholar]
- 62.Chuang TD, Guh JY, Chiou SJ, Chen HC, Huang JS, Yang YL, Chuang LY. 2007. Phosphoinositide 3-kinase is required for high glucose-induced hypertrophy and p21WAF1 expression in LLC-PK1 cells. Kidney Int 71:867–874 [DOI] [PubMed] [Google Scholar]
- 63.Ding L, Xu J, Luo X, Chegini N. 2004. Gonadotropin releasing hormone and transforming growth factor β activate mitogen-activated protein kinase/extracellularly regulated kinase and differentially regulate fibronectin, type I collagen, and plasminogen activator inhibitor-1 expression in leiomyoma and myometrial smooth muscle cells. J Clin Endocrinol Metab 89:5549–5557 [DOI] [PubMed] [Google Scholar]
- 64.Yu Z, Willmarth NE, Zhou J, Katiyar S, Wang M, Liu Y, McCue PA, Quong AA, Lisanti MP, Pestell RG. 2010. microRNA 17/20 inhibits cellular invasion and tumor metastasis in breast cancer by heterotypic signaling. Proc Natl Acad Sci USA 107:8231–8236 [DOI] [PMC free article] [PubMed] [Google Scholar]
Associated Data
This section collects any data citations, data availability statements, or supplementary materials included in this article.
Supplementary Materials
Supplemental Data
Supplemental Data
