Statistical colocalization of monocyte gene expression and genetic risk variants for type 1 diabetes (original) (raw)
Abstract
One mechanism by which disease-associated DNA variation can alter disease risk is altering gene expression. However, linkage disequilibrium (LD) between variants, mostly single-nucleotide polymorphisms (SNPs), means it is not sufficient to show that a particular variant associates with both disease and expression, as there could be two distinct causal variants in LD. Here, we describe a formal statistical test of colocalization and apply it to type 1 diabetes (T1D)-associated regions identified mostly through genome-wide association studies and expression quantitative trait loci (eQTLs) discovered in a recently determined large monocyte expression data set from the Gutenberg Health Study (1370 individuals), with confirmation sought in an additional data set from the Cardiogenics Transcriptome Study (558 individuals). We excluded 39 out of 60 overlapping eQTLs in 49 T1D regions from possible colocalization and identified 21 coincident eQTLs, representing 21 genes in 14 distinct T1D regions. Our results reflect the importance of monocyte (and their derivatives, macrophage and dendritic cell) gene expression in human T1D and support the candidacy of several genes as causal factors in autoimmune pancreatic beta-cell destruction, including AFF3, CD226, CLECL1, DEXI, FKRP, PRKD2, RNLS, SMARCE1 and SUOX, in addition to the recently described GPR183 (EBI2) gene.
INTRODUCTION
Genome-wide association studies (GWAS) have identified multiple markers, usually single-nucleotide polymorphisms (SNPs), associated with risk of common diseases, and attention has now turned to explaining the underlying molecular mechanisms. Currently, a common hypothesis is that a proportion of the causal variants tagged by these disease-associated markers may affect the abundance of a protein or the relative abundance of its different isoforms by altering transcription and/or splicing. Indeed, researchers have identified several SNPs associated with both a disease and expression of a nearby gene and proposed that this reflects a common causal molecular mechanism (1). However, linkage disequilibrium (LD) between variants means it is possible that the two traits, disease susceptibility and gene expression, are affected by distinct causal variants in LD. For example, association of the same SNPs with both type 1 diabetes (T1D) and RPS26 expression in lymphoblastoid cell lines was previously interpreted to imply that RPS26 was the T1D causal gene in the region (2). However, a formal statistical analysis demonstrated that it was considerably more likely that two distinct causal variants existed, one underlying each trait (3).
T1D has now been associated with 53 loci across the human genome (4–6). Although we, and others, have named attractive candidate genes in >60% of these regions (6), the evidence from direct functional studies supporting causality is often limited. Many T1D loci will overlap with expression quantitative trait loci (eQTLs), either by chance or due to common mechanism, and therefore will contain SNPs associated with expression of nearby or distant genes. Together with other functional evidence and results such as animal model data, such observations have led to the localization of causal genes and pathways, improving knowledge of the aetiology of this multifactorial disease. For example, the correlation between INS alleles and INS expression in human thymus (7) and correlations between IL2RA SNPs and levels of RNA and protein (8) have led to the identification of INS and IL2RA as causal for T1D. Statistical evidence that the T1D and expression signals colocalize, i.e. are compatible with the hypothesis of a common causal variant, would help prioritize a particular gene as potentially causal in T1D and justify further exploration of the relevant physiological pathway.
As gene expression and eQTLs may be tissue specific (8–10), it is important to study disease-relevant tissues. T1D is very strongly associated with functional amino acid polymorphisms of the antigen-presenting HLA class II molecules (11), and one of the relevant cell types in T1D are monocytes, which are the circulating precursors of the major antigen-presenting cells in the immune system, dendritic cells and macrophages. The T1D susceptibility gene, GPR183, is associated with monocyte gene expression (12); macrophages are evident in the autoimmune infiltrate of pancreatic islets in histological analysis of autopsy tissue from patients with T1D (13); and their blockade reduces T1D frequency in non-obese diabetic mice (14). The Gutenberg Health Study (GHS) (15) has measured gene expression in fresh (purified) monocytes in 1490 (1370 non-diabetic) subjects and, as such, is the largest available data set for conducting colocalization analysis with T1D (12).
In order to conduct a formal colocalization analysis across all known T1D loci, we first considered an alternative derivation of the statistical test presented by Plagnol et al. (3). The original test relied on standard statistical asymptotics which may not hold, because the likelihood is commonly bimodal and rarely quadratic near a maximum (Supplementary Material, Fig. S1). Here, we present this statistical method and use it to formally test for colocalization between eQTLs in the GHS and T1D signals across 49 regions outside of HLA known to be associated with T1D (6). We use an additional monocyte expression data set from the Cardiogenics Transcriptome Study (CTS) to seek confirmation. Our results, identifying genes whose eQTL signals colocalize with T1D signals, can be used to direct detailed future study of certain T1D loci.
RESULTS
We generated a comprehensive map of both cis and trans monocyte eQTL patterns found in 1370 non-diabetic subjects from the GHS across 49 associated T1D loci listed in T1DBase (6) (Supplementary Material, Table S1). The 49 regions in total comprise 19 Mb. The HLA region was excluded from analysis as the complex pattern of LD, which differs between cases and controls, would violate one of the assumptions of the test—that LD does not differ between cohorts. We identified a total of 60 genotype-probe expression associations with _P <_10−8 (53 cis effects) or _P <_10−10 (7 trans effects) in the GHS data set (Supplementary Material, Table S2). Fifty of these probes were also available in the CTS and all showed normalized fold changes in the same direction in the two data sets.
There are a number of differences between the GHS and CTS data sets; chief among them, the GHS is a cohort study which used negative selection to isolate monocytes, whereas the CTS is a study of coronary artery disease (CAD) and myocardial infarction (MI) cases and controls which used positive selection. Either case status or positive selection, which can activate cells, may create differences in expression and hence in eQTLs. For this reason, we took a cautious approach to the inclusion of the CTS data, testing first for a significant eQTL effect in the CTS data, and second for evidence of colocalization of the GHS and CTS, only including the CTS data when there was no evidence against colocalization at a conservative threshold of _P >0._01.
It is important to note that our statistical test is constructed with a null hypothesis of colocalization. Thus, small _P-_values allow us to reject the null and to conclude it is unlikely that disease susceptibility and gene expression share the same underlying causal variant, i.e. unlikely that T1D association in a region is mediated by monocyte expression differences of the gene under test. However, larger _P-_values could correspond either to genuine colocalization or failure to reject the null due to insufficient statistical power. For this reason, we present our complete results sorted by an overall _P-_value (Supplementary Material, Table S3). We could exclude colocalization of T1D and monocyte expression signals for probes in 39 genes (_P <0._0008; Bonferroni correction of α_= 0._05 for 60 tests), including RPS26. This left 21 probes for which we cannot exclude colocalization (Table 1), which are now worthy of follow-up. These include one potential trans effect at the T1D locus 12q13.2 corresponding to a probe in DCAF16 on chromosome 4p15 (6), a region which does not contain any known T1D-associated SNPs, with the remainder acting in cis.
Table 1.
Twenty-one probes which are consistent with colocalization of monocyte expression signals and T1D association (P > 0.0008)
| Region | Probe | Gene | GHS-CTS | _r_2 | Sign (η) | _P_-value |
|---|---|---|---|---|---|---|
| 2q11.2 | ILMN_1775235 | AFF3 | No | 0.030 | + | 0.082 |
| 6q25.3 | ILMN_1795937 | EZR | Yes | 0.027 | − | 0.00486 |
| 6q25.3 | ILMN_1788223 | RSPH3 | Yes | 0.359 | + | 0.196 |
| 10q23.31 | ILMN_1718520 | RNLS | Yes | 0.043 | + | 0.252 |
| 12p13.31 | ILMN_1782729 | CLECL1 | No | 0.711 | + | 0.0804 |
| 12q13.2 | ILMN_1753440 | DCAF16 | Yes | 0.122 | + | 0.109 |
| 12q13.2 | ILMN_1803745 | SUOX | Yes | 0.062 | − | 0.00171 |
| 12q13.3 | ILMN_1725079 | TSPAN31 | ‡ | 0.041 | + | 0.0238 |
| 12q13.3 | ILMN_1723846 | FAM119B | Yes | 0.518 | − | 0.0014 |
| 12q13.3 | ILMN_2097954 | TSFM | ‡ | 0.058 | + | 0.0027 |
| 13q32 | ILMN_2168217 | GPR183 | Yes | 0.043 | − | 0.214 |
| 16p11.2 | ILMN_1701477 | CCDC101 | Yes | 0.117 | + | 0.135 |
| 16p13.13 | ILMN_1738866 | DEXI | Yes | 0.132 | − | 0.00245 |
| 16p13.13 | ILMN_1655244 | LOC642755 | — | 0.131 | − | 0.0010 |
| 17q21.2 | ILMN_1747857 | SMARCE1 | No | 0.260 | − | 0.139 |
| 18q22.2 | ILMN_1687825 | CD226 | ‡ | 0.047 | − | ^ |
| 19q13.2 | ILMN_1681296 | ICAM4 | Yes | 0.142 | − | 0.00145 |
| 19q13.2 | ILMN_2212763 | ICAM3 | Yes | 0.047 | + | 0.00195 |
| 19q13.32 | ILMN_1753805 | PRKD2 | Yes | 0.089 | − | 0.114 |
| 19q13.32 | ILMN_2368617 | FKRP | Yes | 0.085 | − | 0.00732 |
| Xq28 | ILMN_1808356 | FAM3A | Yes | 0.185 | + | 0.0101 |
The test statistic from our alternatively derived colocalization test is, in fact, identical to that from Plagnol et al.'s (3) asymptotic derivation (see Supplementary Material), but inference is clearer under our alternative derivation, where we use posterior predictive _P-_values (16,17) to evaluate significance. We find that posterior predictive _P-_values are very close to asymptotic _P_-values (Fig. 1), suggesting that our concerns about the asymptotics were unfounded, in data sets of this size at least. In smaller sample sizes, the new approach could still be preferred.
Figure 1.

Comparison of asymptotic and posterior predictive _P-_values, log10 scale.
Finally, one region included here, on chromosome 2q11.2, has been associated with rheumatoid arthritis (18–20) and juvenile idiopathic arthritis (21) and is known to function in the immune system. It has been assigned previously as a T1D locus (22) based on its association with the other autoimmune diseases and on evidence of association of SNPs in the region with T1D at a threshold of _P <_10−4. In the present study, we present stronger evidence that the 2q11.2 locus is significantly associated with T1D risk (P_= 8._95 × 10−8; Table 2), using additional genotyping and samples. We find no evidence against colocalization of increased monocyte AFF3 expression with T1D risk in this region, suggesting AFF3 as the potential causal gene in the region.
Table 2.
Association of rs4851256 C >T/rs4851253 T > G with T1D in case, control and family samples
| Cohort | N | MAF | OR/RR (minor) | 95% CI | _P_-value |
|---|---|---|---|---|---|
| Barrett et al. (4): rs4851256 C >T | |||||
| 4913/7341 | 0.384a | 0.86b | 0.79–0.94b | 8.6 × 10⁻⁷ | |
| Replication: rs4851253 T >G | |||||
| Families | 3411 | 0.376 | 0.93 | 0.87–1.00 | 0.0489 |
| Replication case–control | 4215/4428 | 0.366 | 0.93 | 0.88–0.99 | 0.0317 |
| Combined (Mantel–Haenszel method) | 0.00358 | ||||
| Combined result (Fisher's method) | 8.95 × 10⁻⁸ |
We have prepared an R (23) package, coloc, which implements the tests described here and is available from CRAN (http://cran.r-project.org).
DISCUSSION
The close correspondence between the asymptotic and the posterior predictive _P_-values suggests that our caution regarding whether asymptotics would hold for non-quadratic, bimodal likelihood was overstated. However, we show (Supplementary Material, Fig. S2) that, with smaller sample sizes, this is generally not the case and we recommend that both tests are considered, rather than assuming the asymptotic theory will always hold.
Previous colocalization analyses have taken a conditional approach, considering the degree to which each expression trait was explained by the most strongly disease-associated SNP in a region [e.g. using lymphoblastoid cell lines expression data (24)] or examining by eye the similarity between the association profiles [e.g. comparing expression from whole blood and celiac disease association (1)]. Conditional approaches tend to begin with the most strongly associated SNP in each data set and then consider how the evidence for association in one data set changes when the best SNP from the other data set is included in the model. Methods which depend on single-SNP analyses may fail to capture the complexity of the data when either multiple signals exist or multiple SNPs are needed to explain a signal. Even where a single SNP is sufficient, if the most associated SNP is not the causal variant, as is commonly the case in existing GWAS, we would expect some residual association to remain even in the case where the two traits share a causal variant, potentially biasing any test towards rejecting colocalization. Further, the null hypothesis implicitly tested by conditional methods, namely that the most associated SNP in one data set can completely explain the genetic association in a region in a different data set, is not the same as the null hypothesis that is likely to be of scientific interest, namely that the same variants underlie both traits. We do not replicate here any of the putative T1D colocalizations identified by these studies. Of the three colocalized loci identified by Nica et al. (24), we excluded the HLA locus from study and the other two do not appear to be monocyte eQTLs. We also rejected colocalization of T1D with monocyte expression of the genes listed by Dubois et al. (1) in these regions: TMEM116 and ALDH2 in 12q24.2 (_P_= 1 × 10⁻²³ and _P_= 1 × 10⁻²⁰, respectively) and TLR8 in Xp22.2 (_P_= 3 × 10⁻⁴).
One of the most striking features of our results is that the expression of relatively few genes appears consistent with colocalized T1D signals. Colocalization can be excluded for 39 out of 60 probes (_P <_0_._0008), and none of these is among our online list of the 36 most likely T1D candidate genes in 35 regions (6) (http://wwww.t1dbase.org/page/Regions). Among the remaining 21 probes which were consistent with colocalization (_P >0._0008, Table 1), the _P_-values appear to be skewed towards smaller values than might be expected by chance if all were genuinely colocalized. This may reflect the method by which eight of these _P-_values were calculated (the minimum of _P-_values from three non-independent tests in the case where colocalization testing was not possible in the CTS), a lack of power to detect departures from the null, and/or a combination of subtle differences in LD between populations and the use of imputation, all of which would tend to create bias against the null. This emphasizes that neither the existence of an eQTL nor lack of evidence against colocalization is enough to confirm a gene as causal for T1D. As with any colocalization analysis, these results are merely a tool that will enable prioritization of genes for detailed functional follow-up work.
Partially as a consequence of these results, we are actively pursuing DEXI (16p13.3) as a T1D candidate gene, finding, for example, that sequences in intron 19 of CLEC16A, where many of the most strongly T1D associated SNPs lie, interact physically with the promoter of DEXI, supporting our hypothesis that DEXI expression is a causal factor in T1D (25). Previously, CLEC16A itself was considered the favoured candidate gene (26). SUOX, one of a cluster of eQTL genes in the 12q13.2 region, most of which can be comprehensively rejected (_P <_1 × 10−7), encodes sulphite oxidase and occurs in the mitochondrial membrane. Our results point to SUOX as a potential candidate for T1D, and, despite a lack of strong candidature, links can be drawn from the literature (27). Bisulphite and sulphite food preservatives have been associated with allergy and asthma and could affect the immune system and beta-cell functions, and our results point to SUOX as a new candidate gene for T1D. Similarly, our results suggest that, in 19p13.2, ICAM4 and/or ICAM3 may be worth consideration alongside the currently favoured TYK2 (5).
A very strong candidate gene that our results point to is CLECL1, and this could be particularly informative since the region contains two other strong functional candidates, CD69 and CLEC2D. The CLECL1 eQTL is particularly strong, with associated SNPs explaining 71% of the variation in expression levels (Table 1) and each copy of the A allele of the most associated SNP, rs7970116, leading to a 0.6-fold increase in normalized expression (Supplementary Material, Table S2). CLECL1 encodes C-type lectin 1 or DCAL1 (dendritic cell associated lectin 1), which functions as a receptor on myeloid cells, such as dendritic cells, to deliver costimulatory signals to subsets of T cells, and can affect the maturation of monocytes into dendritic cells (28). Coincident T1D and expression signals for both 12p13.31/CLECL1 and 12q13.2/SUOX were also identified in a recent study in CD4+ lymphocytes (29). A smaller expression data set was available (200 samples), and the analysis was restricted to testing whether the disease-associated SNP showed association with the expression, but our evidence which suggests cross-tissue colocalization adds further support to these genes as possible T1D candidates.
Two regions with eQTL-associated genes which are consistent with colocalization, RSPH3 and EZR (or VIL) in 6q25.3, and _CCDC_101 in 16p11.2 (Table 1), contain previously identified strong immune functional candidate genes, TAGAP and IL27, respectively. However, as neither of the candidate genes shows an eQTL in monocytes in the GHS data set, these data cannot provide further information on their candidacy, and they remain strong candidates because of their major roles in the adaptive immune system. Expression of IL27, in particular, has been correlated with an inflammatory bowel disease-associated SNP (30), emphasizing the tissue-specific nature of gene expression and the need to study a relevant tissue for any colocalization study.
Another region of interest is on chromosome 13q32. We, and collaborators, recently identified an interferon regulatory factor 7 (IRF7)-driven inflammatory network (IDIN) in both rats and humans. This was controlled in humans by a locus on chromosome 13q32 which was also associated with T1D (12). The gene regulating this IDIN was shown to be GPR183, a G-protein-coupled receptor that controls B-cell migration and for which the ligands, oxysterols, have recently been discovered (31–34). However, we could not demonstrate that the T1D association in the region was mediated by GPR183 expression because the likelihood for Plagnol et al.'s (3) test was bimodal and we were not confident in the statistical asymptotics. GPR183 has a strong monocyte eQTL in the region, and with the newly developed test presented here, we find no evidence against colocalization (P_= 0._13), supporting GPR183 as potentially causal for T1D in this region. Also interesting are AFF3, in 2q11.2, a region previously associated with arthritis (18,21) and for which we present further evidence of association with T1D in this paper (Table 2) and SMARCE1 in 17q21.2.
In one region, 18q22.2, we did not apply our test because a single SNP was sufficient to capture both the expression and T1D signals, a situation which is compatible with the null. CD226 encodes a cell surface receptor involved in adhesion, signalling and effector functions of lymphocytes and natural killer cells and is thought likely to be the causal gene in the 18q22.2 interval, given that the same non-synonymous SNP (Gly307Ser, rs763361) is associated with multiple autoimmune diseases, including multiple sclerosis (MS) (35), and that anti-CD226 treatment can delay the onset of disease in an experimental model of MS (36). However, our results, which imply that T1D risk correlates with reduced CD226 mRNA, suggest that the T1D association may also be mediated by the direct effect of Gly307Ser on the CD226 protein (35), and it has been proposed previously that this variant could affect splicing of exon 7, which contains the SNP (26). Reduced CD226 mRNA could cause reduced cell activation on cross-linking, and these results highlight the importance of studying the expression and function of CD226 in purified monocytes and the interactions of monocytes with lymphocytes and other immune cells and the CD226 receptors, CD112 and CD155.
As the adoption of dense, disease-specific genotyping chips such as Immunochip (37; Immunobase, http://www.immunobase.org) increases, it is possible that the situation of single SNPs explaining two trait signals may become more common, implying that any formal colocalization test would become redundant. This scenario would be consistent with a hypothesis of a single causal variant common to both traits. Alternatively, if there exist multiple common causal variants, then dense genotyping should enable the multiple SNPs required to describe the SNP-trait associations to be identified, and this test will be more widely applicable, with the caveat that all causal variants must operate in the same manner for the data to appear consistent with the null. Early indications are that both of these situations will arise, with multiple signal regions forming a substantial minority (38).
All of our results will need follow-up work, and we have begun this with CD226. As a first step, we have confirmed the existence of the eQTL in monocytes, using the alternative approach of allele-specific expression and observed that the direction of allelic imbalance is the same as observed here, with reduced expression correlated with the T1D risk allele (see Supplementary Material).
Our formal colocalization analysis of T1D and monocyte gene expression has identified genes that should be prioritized for follow-up work in regions associated with T1D, and excluded some genes as likely to be causal through their action in monocytes. However, as eQTLs can be tissue specific, we cannot exclude the possibility that there is an alternative expression altering mechanism in another relevant tissue (such as CD4+ T cells) which would explain the T1D association. The test as designed could be applied to any pair of traits, and interesting future applications of our test include analysis of eQTL signals from different tissues or overlapping disease loci for T1D and other autoimmune diseases. A formal analysis is particularly useful, we believe, because it allows the researcher to explicitly evaluate the strength of evidence against colocalization and to rank genes for follow-up. Further analysis with denser SNP genotyping chips, locus-specific allele-specific expression analyses and more informative arrays (or even RNA sequencing) is now strongly justified, alongside investigations of which cellular phenotypes are altered by the CD226 causal variant, using flow cytometry as we have previously described for the T1D and MS locus IL2RA (8).
MATERIALS AND METHODS
Samples
Gutenberg Health Study samples
Subjects
A total of 1490 study participants of both sexes aged 35–74 years were successively enrolled into the GHS, a white European, community-based, single centre, prospective cohort study in the Rhein-Main region in western mid-Germany (15). All subjects gave written informed consent. Ethical approval was given by the local ethics committee and by the local and federal data safety commissioners.
Genotype Data
Genome-wide variability genotyping was performed using the Affymetrix Genome-Wide Human SNP Array 6.0 and the Genome-Wide Human SNP _Nsp_I/_Sty_I 5.0 Assay kit. Genotypes were called using the Affymetrix Birdseed-V2 calling algorithm and quality control was performed using GenABEL (39). Sample and SNP exclusion criteria were as applied previously (15). Briefly, samples were excluded if the per-sample call rate fell below 97%, if the autosomal heterozygosity (false discovery rate, FDR _<_0.01) was too high or if they duplicated or were closely related to another sample in the study. Relatedness between study participants was estimated by the identity-by-state (IBS) statistic. In each pair showing an estimated proportion of alleles IBS ≥ 0.95, the sample with the lower call rate was excluded from further analyses. Quality control was performed on 900 392 SNPs. SNPs were excluded if the minor allele frequency (MAF) fell below 1%, if they deviated from Hardy–Weinberg equilibrium (HWE) (_P <_10−4) or if the per-SNP call rate fell below 98%; 675 350 SNPs were left for analysis.
Expression Data
Separation of monocytes was conducted within 60 min of blood collection. Blood was collected using the Vacutainer CPT Cell Preparation Tube System (BD, Heidelberg, Germany) and the blood samples were enriched in monocytes by negative selection, using RosetteSep Monocyte Enrichment Cocktail (StemCell Technologies, Vancouver, Canada). This cocktail contains antibodies directed against cell surface antigens on human haematopoietic cells (CD2, CD3, CD8, CD19, CD56, CD66b) and glycophorin A on red blood cells. Total RNA was extracted the same day using Trizol extraction and purification by silica-based columns. Genome-wide expression assessment was performed using the Illumina HT-12 v3 BeadChip. Raw intensities were normalized in R (23), using VST transformation and quantile normalization as implemented in the lumi package (40,41). Probes were included in analysis if expression was considered detected (Illumina detection _P <0._01) in at least 90% of samples.
Cardiogenics Transcriptome Study Samples
Subjects
A total of 917 patients and healthy individuals of European descent were recruited in five centres within the CTS. Healthy individuals were recruited in Cambridge (_n_= 458; UK). CAD and MI patients (_n_= 459) were recruited in Leicester (_n_= 161; UK), Lübeck (_n_= 102; Germany), Regensburg (_n_= 122; Germany) and Paris (_n_= 74; France). The study was approved by the Institutional Ethical Committee of each participating centre. We restricted analysis to 558 non-diabetic samples who had genetic, phenotypic and expression data available at the time of this study.
RNA Extraction
Monocyte isolation and RNA extraction were performed separately in each centre according to standardized procedures. All RNA samples were subsequently sent to the Paris centre for amplification, whole-genome microarray gene expression profiling and bioinformatics analysis.
Blood samples (30 ml) from fasting subjects were collected into EDTA, and monocytes were isolated by positive selection with CD14 microbeads (Miltenyi) according to the manufacturer's instructions. Monocyte purity was measured as the percentage of CD14+ cells analysed by flow cytometry. Half of the isolated cell preparation was immediately used for RNA extraction. Isolated monocytes were lysed in Trizol, and RNA was extracted in chloroform and ethanol, washed in RNeasy columns and incubated with DNaseI before extracting in RNase-free water (Qiagen). RNA was quantified by the Nanodrop method before being transferred to Paris on dry ice.
Genotyping
EDTA anticoagulated venous blood samples were collected from all participants. Genomic DNA was extracted from peripheral blood monocytes by standard procedures (Qiagen) and genotyped at either the Wellcome Trust Sanger Institute on the Human 610 Quad Custom Array (594 398 SNPs and 66 049 CNVs), or the SNP&SEQ Technology Platform at Uppsala University, using the Sentrix Human Custom 1.2 M array (1 115 839 SNPs and 80 128 CNVs). Samples were excluded based on per-sample call rate, outlying autosomal heterozygosity, non-European ancestry, duplication and being closely related to another sample in the study; 802 samples were kept for eQTL analyses. SNPs were excluded if the MAF fell below 1% in cases or in controls, if they deviated from HWE (_P <_10−5) in controls, if the per-SNP call rate fell below 95% in cases or controls on the two Illumina arrays or if the MAF in controls was significantly different between the two Illumina arrays (_P <_10−5).
Expression Data
Gene expression profiling was performed using the Illumina Human Ref-8 Sentrix Bead Chip arrays (Illumina Inc., San Diego, CA, USA) containing 24 516 probes corresponding to 18 311 distinct genes and 21 793 Ref Seq annotated transcripts. mRNA was amplified and labelled using the Illumina Total Prep RNA Amplification Kit (Ambion, Inc., Austin, TX, USA). After hybridization, array images were scanned using the Illumina BeadArray Reader, and probe intensities were extracted using the Gene expression module (version 3.3.8) of the Illumina BeadStudio software (version 3.1.30). Raw intensities were processed using the lumi (40,41) and beadarray (42) packages in R (23). All array outliers were excluded and only arrays with high concordance in terms of gene expression measures (pairwise Spearman correlation coefficients within each cell type >0.85) were included in the analyses. After data quality control, 849 monocyte RNA samples were available for statistical analyses. We analysed 558 non-diabetic samples in the eQTL analyses.
T1D Case and Control Samples
The case and control samples have been described before (4,43). Samples come from the Wellcome Trust Case Control Consortium (WTCCC) and the Type 1 Diabetes Genetics Consortium (T1DGC) GWAS. The WTCCC samples consist of 1930 T1D cases and 3342 controls genotyped on the Affymetrix 500 k chip, and the T1DGC samples consist of 3983 T1D cases and 3999 controls genotyped on the Illumina 500 k chip. Sample and SNP exclusion criteria were as applied previously (4). All subjects were of self-reported white European ancestry, samples were excluded based on per-sample call rate, outlying autosomal heterozygosity, non-European ancestry, duplication and being closely related to another sample in the study. SNPs were excluded if the MAF fell below 1% in cases or controls, if they deviated from HWE (_P <5._7 × 10−7) in controls or if the per-SNP call rate fell below 95%.
Alternative derivation of colocalization test
We developed an alternative to the asymptotic likelihood-based approach of Plagnol et al. (3). Our alternative approach was necessary because the likelihood can be bimodal and is rarely quadratic near a maximum (Supplementary Material, Fig. S1), rendering the applicability of asymptotic likelihood ratio test theory questionable. There are some parallels between the alternative derivation and Fieller's theorem (44), which allows for disjoint confidence intervals when likelihoods are multimodal.
We have two traits measured in independent cohorts _Y_1 and _Y_2. Assume these traits are regressed (using linear or generalized linear regression, as appropriate) on genotypes from the same set of p explanatory SNPs, X, producing maximum-likelihood estimates _b_1 and _b_2 of regression coefficients _β_1 and _β_2 with variance–covariance matrices _V_1 and _V_2, respectively. Since sample sizes are very large, the combined likelihood may be closely approximated by a Gaussian likelihood for _b_1 and _b_2, assuming _V_1 and _V_2 are known and that cov(_b_1, _b_2) = 0.
We assume equal LD in the two cohorts, i.e. that the relationship between the causal variant and the genotyped SNPs associated with either trait does not differ between cohorts. Then, under the null hypothesis of colocalization, _β_1 ∝ _β_2, i.e. _β_1 = (1/η)_β_2 = β (3). From Fieller's theorem (44), we may derive the _χ_2 statistic:
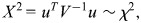
where 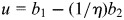 and
and 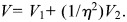
Note that this test statistic turns out to be identical to that proposed by Plagnol et al. (3) (see Supplementary Material). If η were known, _X_2 would have a _χ_2 distribution on p degrees of freedom. The difficulty arises because it is not known, and we must replace it by its maximum-likelihood estimate,  (which also minimizes _X_2). The asymptotic likelihood theory advanced by Plagnol et al. suggests that this results in min(_X_2) having a _χ_2 distribution on _p_− 1 degrees of freedom, but this requires the log-likelihood for η to be well behaved (i.e. near quadratic) and this is not always the case; indeed, it is often bimodal. It is this behaviour of the likelihood for the ratio of regression coefficients which has given rise to the extended literature on Fieller's theorem.
Instead, we use a posterior predictive _P-_value, first proposed by Rubin (16) and further developed by Meng (17) to allow for nuisance parameters (η in our case). We begin by reparameterizing the problem in terms of θ_= tan−1_η. Then, replacing _X_2 by
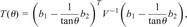
the posterior predictive _P-_value is defined as
where T*(θ) is the _P-_value associated with T(θ), and  (θ) is the posterior distribution of θ, which we estimate assuming flat priors for θ and β (see Supplementary Material).
We also estimate a 95% credible interval for η by choosing values of η which have equal probability such that the area included between these limits is 95% of the total area under the posterior. Note that the credible interval may be disjoint in the case of a bimodal likelihood, as with Fieller's confidence intervals. In all cases where the credible interval is disjoint, the two peaks of the bimodal likelihood are either side of zero, and therefore both positive and negative values of η are supported.
T1D association testing of AFF3/2q11.2
Previously, we found an association between T1D and AFF3/2q11.2 in a GWAS meta-analysis (4). The most associated SNP in the region was rs4851256, but we could not design a TaqMan assay to genotype the replication resource. In the present study, a proxy was selected, rs4851253, which has _r_2 = 1, with rs4851256 in the HapMap CEU samples.
The replication case and control samples and family samples have been described previously (4). Case and control samples were analysed using logistic regression, adjusting for 12 broad geographical regions within Great Britain (southwestern, southern, southeastern, London, eastern, Wales, Midlands, North Midlands, northwestern, East and West Riding, northern and Scotland) to exclude the possibility of confounding by geography. These regions correspond to the place of collection for case and control subjects. We performed a 1 degree of freedom (df) likelihood ratio test to determine whether a 1 df multiplicative allelic effects model or a 2 df genotype effects model (no specific mode of inheritance assumed) was more appropriate. We assumed a multiplicative allelic effects model because it was not significantly different from the genotype model for rs4851253.
The replication family samples were analysed using the transmission disequilibrium test and conditional logistic regression. The method proposed by Mantel (45) was used to combine the scores from replication case, control and family samples. However, as the SNP genotyped in the replication was a proxy SNP for rs4851256, we used Fisher's combined probability test to produce an overall statistic for association with T1D summarizing evidence in the GWAS and replication samples combined.
eQTL identification
We first used genome-wide genotype and fresh monocyte expression data from 1370 non-diabetic subjects from the GHS (15) to generate a comprehensive map of both cis and trans monocyte eQTL patterns across known T1D loci listed in T1DBase (6) (Supplementary Material, Table S1). We conducted T1D locus-wide association testing of every probe in the GHS data set against every genotyped SNP which lay within the 19 Mb which comprise the T1D regions, using the snpMatrix (46) package in R (23). We excluded probes which were not determined to be expressed significantly above background in 90% of samples; annotated as ‘bad’ quality according to detailed analysis of Illumina expression arrays (47) or overlapped SNPs which were validated in dbSNP version 131 and, if frequency information was available, not monomorphic in Europeans. We defined significant associations as those which had _P <_10−8 for _cis_ effects (SNP ≤ 5 Mb from probe) or _P <_10−10 for _trans_ (SNP _>_5 Mb from probe or located on different chromosome) effects. These thresholds are two orders of magnitude lower than those established in the eQTL literature, as we are studying <1% of the genome and because our aim here is to find results worthy of follow-up, rather than to identify eQTLs definitively.
Application of colocalization test
Expression and disease status are rarely available in a single large cohort; the T1D GWAS and the GHS have been carried out using samples from different individuals. Instead, we test whether the coefficients from two separate regressions (expression and T1D against the same SNPs) may be considered proportional. T1D cases and controls came from two GWAS, which had used different genome-wide SNP chips: the WTCCC (43) used the Affymetrix 500 k chip and the T1DGC (4) used the Illumina 550 k chip. In contrast, the GHS used the more recent Affymetrix 1 M chip and the CTS a combination of the Illumina 670 k and 1.2 M chips. Consequently, we need to take special care with imputation, which is now commonly used to expand the number of SNPs tested. When SNPs are imperfectly imputed, regression coefficients are biased towards the null. Thus, if the same SNP is imputed with different efficiency in the T1D and expression data sets, this could lead to perhaps false evidence against the null hypothesis of colocalization. On the other hand, restriction to SNPs directly genotyped in both data sets may not be appropriate when different chips have been used, as this can restrict the number of SNPs available to test and fail to capture the individual association signals adequately. We chose to use imputed SNPs across chips, using IMPUTE v2 (48), but restricted analysis to well-imputed SNPs (info _>_0.8), likely to induce only small bias in coefficients.
We, therefore, conducted an initial colocalization analysis on these 60 genotype-expression associations, using directly genotyped and well-imputed SNPs in the GHS and WTCCC, both of which used Affymetrix chips. We attempted to expand the analysis into the CTS when data for the same probe were available; there was evidence of probe–genotype association in the region in the CTS (_P <_0_._0008; Bonferroni correction of _α_= 0_._05 for 60 tests) and there was no strong evidence against colocalization of the GHS and CTS signals (_P >0._01). For such probes (50/60 occasions), we compared expression and T1D signals in the CTS and T1DGC data, using directly genotyped and well-imputed SNPs (both studies used Illumina chips). We combined the _P-_values from the two tests, using Fisher's method. When it was not possible to extend the analysis into the CTS, we used imputation to compare signals from the GHS with the T1DGC, the WTCCC and the combined T1D data in turn. In this case, the tests are not independent, and we used the minimum observed _P-_value as an overall measure of significance.
For each putative eQTL, we extended the T1D region to include a 0.1 cM window surrounding the best eQTL SNP. Then, for each expression-T1D data set under test, we took all SNPs in the extended window, and used lasso regression (49) to determine a subset which best explained the association of both the probe and T1D, according to the Bayesian information criterion. We tried two approaches: lasso on the expression data set first, followed by the T1D data set including all SNPs chosen in the first stage, or vice versa. The model with the smallest combined Bayesian information criterion was preferred.
Genotypes were imputed using CEU data from HapMap version 2, release 24, using IMPUTE v2 (48). All analysis was carried out using R (23) and the packages snpMatrix (46) for initial association testing of expression measures and glmnet (50) for lasso regression.
URLs
1000 Genomes, http://www.1000genomes.org; Cardiogenics Transcriptome Study, http://www.cardiogenics.eu; CRAN, http://cran.r-project.org; HapMap, http://www.hapmap.org; T1DBase, http://www.t1dbase.org; Immunobase, http://www.immunobase.org.
SUPPLEMENTARY MATERIAL
Supplementary Material is available at HMG online.
FUNDING
This work was supported by the Juvenile Diabetes Research Foundation International, the Wellcome Trust and the National Institute for Health Research Cambridge Biomedical Centre. The collection of DNA for the British 1958 Birth Cohort was supported by the UK Medical Research Council (G0000934) and the Wellcome Trust (068545/Z/02). C.W. is supported by the Wellcome Trust (089989). The Cambridge Institute for Medical Research (CIMR) is in receipt of a Wellcome Trust Strategic Award (079895). The Gutenberg Health Study is supported by the government of Rheinland-Pfalz (Stiftung Rheinland Pfalz fr Innovation, contract AZ 961-386261/733), the research programmes Wissen schafft Zukunft and Schwerpunkt Vaskuläre Prävention of the Johannes Gutenberg-University of Mainz and its contract with Boehringer Ingelheim and PHILIPS Medical Systems, including an unrestricted grant for the Gutenberg Health Study. The present study was supported by the National Genome Network NGFNplus (contract A3 01GS0833 and 01GS0831) and by a joint funding from the Federal Ministry of Education and Research, Germany (contract BMBF 01KU0908A) and from the Agence Nationale de la Recherche, France (contract ANR 09 GENO 106 01) for the project CARDomics. M.R. is supported by a grant from the Fondation pour la Recherche Mdicale (FDT20101220928). The Cardiogenics study was funded by the European Union (LSHM-CT 2006-037593). The healthy subjects within this study form part of the National Institute for Health Research (NIHR)-funded Cambridge BioResource. We acknowledge the use of DNA from The UK Blood Services collection of Common Controls (UKBS-CC collection), funded by the Wellcome Trust grant 076113/C/04/Z, by the Wellcome Trust/Juvenile Diabetes Research Foundation grant 061858 and by the National Institute of Health Research of England. Funding for this project was provided by the Wellcome Trust under award 076113. This research utilizes resources provided by the Type 1 Diabetes Genetics Consortium, a collaborative clinical study sponsored by the National Institute of Diabetes and Digestive and Kidney Diseases (NIDDK), National Institute of Allergy and Infectious Diseases (NIAID), National Human Genome Research Institute (NHGRI), National Institute of Child Health and Human Development (NICHD) and Juvenile Diabetes Research Foundation International (JDRF) and supported by U01 DK062418. This work was funded by the Juvenile Diabetes Research Foundation International, the Wellcome Trust and the National Institute for Health Research Cambridge Biomedical Centre. The research leading to these results has received funding from the European Union's 7th Framework Programme (FP7/2007-2013) under grant agreement no. 241447 (NAIMIT). The Cambridge Institute for Medical Research (CIMR) is in receipt of a Wellcome Trust Strategic Award (079895). Funding to pay the Open Access publication charges for this article was provided by the Wellcome Trust.
Supplementary Material
Supplementary Data
ACKNOWLEDGEMENTS
We gratefully acknowledge the participation of all the patients, control subjects and family members. We thank David Dunger and Barry Widmer of the University of Cambridge, and the British Society for Paediatric Endocrinology and Diabetes for the T1D case collection. We thank Paul Lyons for providing CD14+ monocyte samples. DNA control samples were prepared and provided by S. Ring, R. Jones, M. and W. McArdle of the University of Bristol, D. Strachan of the University of London and P. Burton of the University of Leicester. The collection was established as part of the Wellcome Trust Case-Control Consortium. This study makes use of data generated by the Wellcome Trust Case Control Consortium. A full list of the investigators who contributed to the generation of the data are available from http://www.wtccc.org.uk/. We also thank H. Stevens, P. Clarke, G. Coleman, S. Duley, D. Harrison, S. Hawkins, M. Maisuria, T. Mistry and N. Taylor from the JDRF/WT Diabetes and Inflammation Laboratory for preparation of DNA samples.
Conflict of Interest statement. None declared.
REFERENCES
- 1.Dubois P.C.A., Trynka G., Franke L., Hunt K.A., Romanos J., Curtotti A., Zhernakova A., Heap G.A.R., Adny R., Aromaa A., et al. Multiple common variants for celiac disease influencing immune gene expression. Nat. Genet. 2010;42:295–302. doi: 10.1038/ng.543. [DOI] [PMC free article] [PubMed] [Google Scholar]
- 2.Schadt E.E., Molony C., Chudin E., Hao K., Yang X., Lum P.Y., Kasarskis A., Zhang B., Wang S., Suver C., et al. Mapping the genetic architecture of gene expression in human liver. PLoS Biol. 2008;6:e107. doi: 10.1371/journal.pbio.0060107. [DOI] [PMC free article] [PubMed] [Google Scholar]
- 3.Plagnol V., Smyth D.J., Todd J.A., Clayton D.G. Statistical independence of the colocalized association signals for type 1 diabetes and RPS26 gene expression on chromosome 12q13. Biostatistics. 2009;10:327–334. doi: 10.1093/biostatistics/kxn039. [DOI] [PMC free article] [PubMed] [Google Scholar]
- 4.Barrett J.C., Clayton D.G., Concannon P., Akolkar B., Cooper J.D., Erlich H.A., Julier C., Morahan G., Nerup J., Nierras C., et al. Genome-wide association study and meta-analysis find that over 40 loci affect risk of type 1 diabetes. Nat. Genet. 2009;41:703–707. doi: 10.1038/ng.381. [DOI] [PMC free article] [PubMed] [Google Scholar]
- 5.Wallace C., Smyth D.J., Maisuria-Armer M., Walker N.M., Todd J.A., Clayton D.G. The imprinted DLK1-MEG3 gene region on chromosome 14q32.2 alters susceptibility to type 1 diabetes. Nat. Genet. 2010;42:68–71. doi: 10.1038/ng.493. [DOI] [PMC free article] [PubMed] [Google Scholar]
- 6.T1DBase. http://www.t1dbase.org .
- 7.Vafiadis P., Bennett S.T., Todd J.A., Nadeau J., Grabs R., Goodyer C.G., Wickramasinghe S., Colle E., Polychronakos C. Insulin expression in human thymus is modulated by INS VNTR alleles at the IDDM2 locus. Nat. Genet. 1997;15:289–292. doi: 10.1038/ng0397-289. [DOI] [PubMed] [Google Scholar]
- 8.Dendrou C.A., Plagnol V., Fung E., Yang J.H.M., Downes K., Cooper J.D., Nutland S., Coleman G., Himsworth M., Hardy M., et al. Cell-specific protein phenotypes for the autoimmune locus IL2RA using a genotype-selectable human bioresource. Nat. Genet. 2009;41:1011–1015. doi: 10.1038/ng.434. [DOI] [PMC free article] [PubMed] [Google Scholar]
- 9.Heinzen E.L., Ge D., Cronin K.D., Maia J.M., Shianna K.V., Gabriel W.N., Welsh-Bohmer K.A., Hulette C.M., Denny T.N., Goldstein D.B. Tissue-specific genetic control of splicing: implications for the study of complex traits. PLoS Biol. 2008;6:e1000001. doi: 10.1371/journal.pbio.1000001. [DOI] [PMC free article] [PubMed] [Google Scholar]
- 10.Dimas A.S., Deutsch S., Stranger B.E., Montgomery S.B., Borel C., Attar-Cohen H., Ingle C., Beazley C., Arcelus M.G., Sekowska M., et al. Common regulatory variation impacts gene expression in a cell type-dependent manner. Science. 2009;325:1246–1250. doi: 10.1126/science.1174148. [DOI] [PMC free article] [PubMed] [Google Scholar]
- 11.Todd J.A. Etiology of type 1 diabetes. Immunity. 2010;32:457–467. doi: 10.1016/j.immuni.2010.04.001. [DOI] [PubMed] [Google Scholar]
- 12.Heinig M., Petretto E., Wallace C., Bottolo L., Rotival M., Lu H., Li Y., Sarwar R., Langley S.R., Bauerfeind A., et al. A trans-acting locus regulates an anti-viral expression network and type 1 diabetes risk. Nature. 2010;467:460–464. doi: 10.1038/nature09386. [DOI] [PMC free article] [PubMed] [Google Scholar]
- 13.Richardson S.J., Willcox A., Bone A.J., Morgan N.G., Foulis A.K. Immunopathology of the human pancreas in type-I diabetes. Semin. Immunopathol. 2011;33:9–21. doi: 10.1007/s00281-010-0205-0. [DOI] [PubMed] [Google Scholar]
- 14.Jun H.-S., Yoon C.-S., Zbytnuik L., van Rooijen N., Yoon J.-W. The role of macrophages in T cell-mediated autoimmune diabetes in nonobese diabetic mice. J. Exp. Med. 1999;189:347–358. doi: 10.1084/jem.189.2.347. [DOI] [PMC free article] [PubMed] [Google Scholar]
- 15.Zeller T., Wild P., Szymczak S., Rotival M., Schillert A., Castagne R., Maouche S., Germain M., Lackner K., Rossmann H., et al. Genetics and beyond—the transcriptome of human monocytes and disease susceptibility. PLoS One. 2010;5:e10693. doi: 10.1371/journal.pone.0010693. [DOI] [PMC free article] [PubMed] [Google Scholar]
- 16.Rubin D.B. Bayesianly justifiable and relevant frequency calculations for the applied statistician. Ann. Statist. 1984;12:1151–1172. [Google Scholar]
- 17.Meng X.-L. Posterior predictive p-Values. Ann. Statist. 1994;22:1142–1160. [Google Scholar]
- 18.Barton A., Eyre S., Ke X., Hinks A., Bowes J., Flynn E., Martin P. Wilson A.G., et al. Y.E.A.R. Consortium B.I.R.A.C. Consortium. Identification of AF4/FMR2 family, member 3 (AFF3) as a novel rheumatoid arthritis susceptibility locus and confirmation of two further pan-autoimmune susceptibility genes. Hum. Mol. Genet. 2009;18:2518–2522. doi: 10.1093/hmg/ddp177. [DOI] [PMC free article] [PubMed] [Google Scholar]
- 19.Stahl E.A., Raychaudhuri S., Remmers E.F., Xie G., Eyre S., Thomson B.P., Li Y., Kurreeman F.A.S., Zhernakova A., Hinks A., et al. Genome-wide association study meta-analysis identifies seven new rheumatoid arthritis risk loci. Nat. Genet. 2010;42:508–514. doi: 10.1038/ng.582. [DOI] [PMC free article] [PubMed] [Google Scholar]
- 20.Plant D., Flynn E., Mbarek H., Dieud P., Cornelis F., Arlestig L., Dahlqvist S.R., Goulielmos G., Boumpas D.T., Sidiropoulos P., et al. Investigation of potential non-HLA rheumatoid arthritis susceptibility loci in a European cohort increases the evidence for nine markers. Ann. Rheum. Dis. 2010;69:1548–1553. doi: 10.1136/ard.2009.121020. [DOI] [PMC free article] [PubMed] [Google Scholar]
- 21.Hinks A., Eyre S., Ke X., Barton A., Martin P., Flynn E., Packham J., Worthington J., et al. C.A.P. Study U.K.R.A.G. Consortium. Association of the AFF3 gene and IL2/IL21 gene region with juvenile idiopathic arthritis. Genes Immun. 2010;11:194–198. doi: 10.1038/gene.2009.105. [DOI] [PMC free article] [PubMed] [Google Scholar]
- 22.Smyth D.J., Plagnol V., Walker N.M., Cooper J.D., Downes K., Yang J.H.M., Howson J.M.M., Stevens H., McManus R., Wijmenga C., et al. Shared and distinct genetic variants in type 1 diabetes and celiac disease. N. Engl. J. Med. 2008;359:2767–2777. doi: 10.1056/NEJMoa0807917. [DOI] [PMC free article] [PubMed] [Google Scholar]
- 23.R Development Core Team. R: A Language and Environment for Statistical Computing. Vienna, Austria: R Foundation for Statistical Computing; 2010. ISBN 3-900051-07-0. [Google Scholar]
- 24.Nica A.C., Montgomery S.B., Dimas A.S., Stranger B.E., Beazley C., Barroso I., Dermitzakis E.T. Candidate causal regulatory effects by integration of expression QTLs with complex trait genetic associations. PLoS Genet. 2010;6:e1000895. doi: 10.1371/journal.pgen.1000895. [DOI] [PMC free article] [PubMed] [Google Scholar]
- 25.Davison L.J., Wallace C., Cooper J.D., Cope N.F., Wilson N.K., Smyth D.J., Howson J.M.M., Saleh N., Al-Jeffery A., Angus K.L., et al. Long-range DNA looping and gene expression analyses identify DEXI as an autoimmune disease candidate gene. Hum. Mol. Genet. 2012;21:322–333. doi: 10.1093/hmg/ddr468. [DOI] [PMC free article] [PubMed] [Google Scholar]
- 26.Todd J.A., Walker N.M., Cooper J.D., Smyth D.J., Downes K., Plagnol V., Bailey R., Nejentsev S., Field S.F., Payne F., et al. Robust associations of four new chromosome regions from genome-wide analyses of type 1 diabetes. Nat. Genet. 2007;39:857–864. doi: 10.1038/ng2068. [DOI] [PMC free article] [PubMed] [Google Scholar]
- 27.Ranguelova K., Bonini M., Mason R. (Bi)sulfite oxidation by copper, zinc-superoxide dismutase: sulfite-derived, radical-initiated protein radical formation. Environ. Health Perspect. 2010;118:970–975. doi: 10.1289/ehp.0901533. [DOI] [PMC free article] [PubMed] [Google Scholar]
- 28.Ryan E.J., Magaletti D., Draves K.E., Clark E.A. Ligation of dendritic cell-associated lectin-1 induces partial maturation of human monocyte derived dendritic cells. Hum. Immunol. 2009;70:1–5. doi: 10.1016/j.humimm.2008.10.019. [DOI] [PMC free article] [PubMed] [Google Scholar]
- 29.Murphy A., Chu J.-H., Xu M., Carey V.J., Lazarus R., Liu A., Szefler S.J., Strunk R., Demuth K., Castro M., et al. Mapping of numerous disease-associated expression polymorphisms in primary peripheral blood CD4+ lymphocytes. Hum. Mol. Genet. 2010;19:4745–4757. doi: 10.1093/hmg/ddq392. [DOI] [PMC free article] [PubMed] [Google Scholar]
- 30.Imielinski M., Baldassano R.N., Griffiths A., Russell R.K., Annese V., Dubinsky M., Kugathasan S., Bradfield J.P., Walters T.D., Sleiman P., et al. Common variants at five new loci associated with early-onset inflammatory bowel disease. Nat. Genet. 2009;41:1335–1340. doi: 10.1038/ng.489. [DOI] [PMC free article] [PubMed] [Google Scholar]
- 31.Pereira J.P., Kelly L.M., Xu Y., Cyster J.G. EBI2 mediates B cell segregation between the outer and centre follicle. Nature. 2009;460:1122–1126. doi: 10.1038/nature08226. [DOI] [PMC free article] [PubMed] [Google Scholar]
- 32.Gatto D., Paus D., Basten A., Mackay C.R., Brink R. Guidance of B cells by the orphan G protein-coupled receptor EBI2 shapes humoral immune responses. Immunity. 2009;31:259–269. doi: 10.1016/j.immuni.2009.06.016. [DOI] [PubMed] [Google Scholar]
- 33.Hannedouche S., Zhang J., Yi T., Shen W., Nguyen D., Pereira J.P., Guerini D., Baumgarten B.U., Roggo S., Wen B., et al. Oxysterols direct immune cell migration via EBI2. Nature. 2011;475:524–527. doi: 10.1038/nature10280. [DOI] [PMC free article] [PubMed] [Google Scholar]
- 34.Liu C., Yang X.V., Wu J., Kuei C., Mani N.S., Zhang L., Yu J., Sutton S.W., Qin N., Banie H., et al. Oxysterols direct B-cell migration through EBI2. Nature. 2011;475:519–523. doi: 10.1038/nature10226. [DOI] [PubMed] [Google Scholar]
- 35.Hafler J.P., Maier L.M., Cooper J.D., Plagnol V., Hinks A., Simmonds M.J., Stevens H.E., Walker N.M., Healy B., Howson J.M.M., et al. CD226 Gly307Ser association with multiple autoimmune diseases. Genes Immun. 2008;10:5–10. doi: 10.1038/gene.2008.82. [DOI] [PMC free article] [PubMed] [Google Scholar]
- 36.Dardalhon V., Schubart A.S., Reddy J., Meyers J.H., Monney L., Sabatos C.A., Ahuja R., Nguyen K., Freeman G.J., Greenfield E.A., et al. CD226 is specifically expressed on the surface of Th1 cells and regulates their expansion and effector functions. J. Immunol. 2005;175:1558–1565. doi: 10.4049/jimmunol.175.3.1558. [DOI] [PubMed] [Google Scholar]
- 37.Cortes A., Brown M.A. Promise and pitfalls of the Immunochip. Arthritis Res. Ther. 2011;13:101. doi: 10.1186/ar3204. [DOI] [PMC free article] [PubMed] [Google Scholar]
- 38.Trynka G., Hunt K.A., Bockett N.A., Romanos J., Mistry V., Szperl A., Bakker S.F., Bardella M.T., Bhaw-Rosun L., Castillejo G., et al. Dense genotyping identifies and localizes multiple common and rare variant association signals in celiac disease. Nat. Genet. 2011;43:1193–1201. doi: 10.1038/ng.998. [DOI] [PMC free article] [PubMed] [Google Scholar]
- 39.Aulchenko Y.S., Ripke S., Isaacs A., van Duijn C.M. GenABEL: an R library for genome-wide association analysis. Bioinformatics. 2007;23:1294–1296. doi: 10.1093/bioinformatics/btm108. [DOI] [PubMed] [Google Scholar]
- 40.Du P., Kibbe W.A., Lin S.M. lumi: a pipeline for processing Illumina microarray. Bioinformatics. 2008;24:1547–1548. doi: 10.1093/bioinformatics/btn224. [DOI] [PubMed] [Google Scholar]
- 41.Lin S.M., Du P., Huber W., Kibbe W.A. Model-based variance-stabilizing transformation for Illumina microarray data. Nucleic Acids Res. 2008;36:e11. doi: 10.1093/nar/gkm1075. [DOI] [PMC free article] [PubMed] [Google Scholar]
- 42.Dunning M.J., Smith M.L., Ritchie M.E., Tavar S. beadarray: R classes and methods for Illumina bead-based data. Bioinformatics. 2007;23:2183–2184. doi: 10.1093/bioinformatics/btm311. [DOI] [PubMed] [Google Scholar]
- 43.Wellcome Trust Case Control Consortium. Genome-wide association study of 14,000 cases of seven common diseases and 3,000 shared controls. Nature. 2007;447:661–678. doi: 10.1038/nature05911. [DOI] [PMC free article] [PubMed] [Google Scholar]
- 44.Fieller E.C. Some problems in interval estimation. J. R. Statist. Soc. B. 1954;16:175–185. [Google Scholar]
- 45.Mantel N. Chi-square tests with one degree of freedom: extensions of the Mantel-Haenszel procedure. J. Am. Stat. Assoc. 1963;58:690–700. [Google Scholar]
- 46.Clayton D., Leung H.-T. An R package for analysis of whole-genome association studies. Hum. Hered. 2007;64:45–51. doi: 10.1159/000101422. [DOI] [PubMed] [Google Scholar]
- 47.Barbosa-Morais N.L., Dunning M.J., Samarajiwa S.A., Darot J.F.J., Ritchie M.E., Lynch A.G., Tavare S. A re-annotation pipeline for Illumina BeadArrays: improving the interpretation of gene expression data. Nucl. Acids Res. 2010;38:e17. doi: 10.1093/nar/gkp942. [DOI] [PMC free article] [PubMed] [Google Scholar]
- 48.Howie B.N., Donnelly P., Marchini J. A flexible and accurate genotype imputation method for the next generation of genome-wide association studies. PLoS Genet. 2009;5:e1000529. doi: 10.1371/journal.pgen.1000529. [DOI] [PMC free article] [PubMed] [Google Scholar]
- 49.Tibshirani R. Optimal reinsertion:regression shrinkage and selection via the lasso. J. R. Statist. Soc. B. 1996;58:267–288. [Google Scholar]
- 50.Friedman J.H., Hastie T., Tibshirani R. Regularization paths for generalized linear models via coordinate descent. J. Stat. Soft. 2010;33:1–22. [PMC free article] [PubMed] [Google Scholar]
Associated Data
This section collects any data citations, data availability statements, or supplementary materials included in this article.
Supplementary Materials
Supplementary Data