A quantitative atlas of polyadenylation in five mammals (original) (raw)
Abstract
We developed PolyA-seq, a strand-specific and quantitative method for high-throughput sequencing of 3′ ends of polyadenylated transcripts, and used it to globally map polyadenylation (polyA) sites in 24 matched tissues in human, rhesus, dog, mouse, and rat. We show that PolyA-seq is as accurate as existing RNA sequencing (RNA-seq) approaches for digital gene expression (DGE), enabling simultaneous mapping of polyA sites and quantitative measurement of their usage. In human, we confirmed 158,533 known sites and discovered 280,857 novel sites (FDR < 2.5%). On average 10% of novel human sites were also detected in matched tissues in other species. Most novel sites represent uncharacterized alternative polyA events and extensions of known transcripts in human and mouse, but primarily delineate novel transcripts in the other three species. A total of 69.1% of known human genes that we detected have multiple polyA sites in their 3′UTRs, with 49.3% having three or more. We also detected polyadenylation of noncoding and antisense transcripts, including constitutive and tissue-specific primary microRNAs. The canonical polyA signal was strongly enriched and positionally conserved in all species. In general, usage of polyA sites is more similar within the same tissues across different species than within a species. These quantitative maps of polyA usage in evolutionarily and functionally related samples constitute a resource for understanding the regulatory mechanisms underlying alternative polyadenylation.
Sequencing of mRNA and noncoding RNA has made important contributions to our understanding of biology and disease, with numerous implications for diagnostics and therapeutics. As an outcome of rapidly expanding sequencing capabilities, recently described methods produce comprehensive representations of the transcriptome (Mortazavi et al. 2008; Armour et al. 2009; Wang et al. 2009; Levin et al. 2010) and have been used to discover and monitor alternative splicing (Sultan et al. 2008; Wang et al. 2008; Wilhelm et al. 2008), as well as gene expression (Marioni et al. 2008) and its underlying regulatory genetic variation (Montgomery et al. 2010; Pickrell et al. 2010). While transcriptome sequencing studies continue to focus on gene expression and RNA processing, mapping of polyA sites has received considerably less attention, despite evidence suggesting that alternative polyadenylation is common in metazoans (Lee et al. 2007; Ozsolak et al. 2010) and contributes to phenotypic variation and disease. Avoidance of microRNA regulation via alternative polyA sites, for example, plays a role in development (Mangone et al. 2010; Thomsen et al. 2010; Jan et al. 2011) and cancer (Sandberg et al. 2008; Mayr and Bartel 2009). Furthermore, extensive usage of tissue-specific sites, some of which are associated with _cis_-regulatory elements, suggests that alternative polyadenylation is tightly regulated (Proudfoot et al. 2002) and has important physiological implications. Lastly, the 3′UTRs of some genes are expressed independently of the cognate coding regions, and may thus possess previously unappreciated regulatory functions (Mercer et al. 2011).
A simple and reliable method for high-throughput mapping of polyA sites is needed to help define the complete set of transcripts present in a dynamic transcriptome and to better understand the role of alternative polyadenylation. ESTs and full-length cDNAs have traditionally been used for defining primary transcripts, but become expensive and laborious on a large scale; consequently, the genomes of many species remain sparsely annotated. High-throughput variations on serial analysis of gene expression (SAGE) (Velculescu et al. 1995) have proven useful in DGE applications (Asmann et al. 2009), but their reliance on restriction sites precludes precise mapping and excludes some genes entirely. Paired-End diTags (PETs) simultaneously capture 5′ and 3′ ends of mRNAs (Ng et al. 2005, 2006; Fullwood et al. 2009), although the short tag sequences and complex cloning protocol impose practical challenges for genomic alignment and assay scalability.
Recently, several studies have described methods that leverage high-throughput sequencing to map 3′ transcript termini. The earliest was a modified RNA-seq protocol, where reverse transcription is primed with a T20VN oligo (20 Ts followed by a non-T, then a random base) and the second strand is made with RNase H + DNA Pol I, followed by standard library construction (Yoon and Brem 2010). Using paired-end sequencing, one mate captures sequence near the end of the transcript, while a stretch of either As or Ts in the other mate reveals the orientation relative to genomic DNA. In a method called MAPS, Fox-Walsh et al. (2011) use a biotinylated variant of T20 that enables bypassing mRNA isolation from total RNA and produces multiplexing-enabled 3′-biased cDNA libraries. The main limitations of both of these approaches are that the majority of sequencing reads do not precisely map to the transcript termini and libraries are contaminated with internally primed fragments. Jan et al. (2011) developed an elegant molecular approach that minimizes representation of internal priming events by requiring ligation of a splint-oligo to the end of the polyA tail. The method was used to reveal thousands of novel polyA sites in C. elegans, but requires many steps during library construction and has not been shown to be quantitative. Lastly, PAS-seq is similar to MAPS in that a universal sequence is upstream of the T20VN, which enables direct amplification by serving as a PCR anchor (Shepard et al. 2011), but enables precise definition of the polyA site by sequencing directly into the end of the transcript. All approaches were thus far applied to small numbers of samples.
We developed a novel method that is similar to PAS-seq (Shepard et al. 2011), but differs in its use of random priming for second-strand synthesis, enabling rapid library generation. Our protocol takes 6 h, of which only 2 h are hands-on. Instead of T20VN, we used a T10VN, which also facilitates the use of a custom sequencing primer with more favorable hybridization kinetics during sequencing. Our method, called PolyA-seq, captures transcript sequence immediately upstream of polyA stretches, retains strand specificity, and accurately represents transcriptional abundances as demonstrated by agreement with MAQC data (Shi et al. 2006). Thus, it also quantitatively captures the usage of any given polyA site. We developed a robust filtering scheme to remove internal priming events and calibrated the false-discovery rate through experimental validation. Here, we describe the method and an exploratory analysis of a polyA site atlas that we generated in five mammals, focusing on tissue and species specificity to gain insight into general evolutionary trends in polyadenylation.
Results
PolyA-seq is a simple high-throughput strategy for sequencing 3′ transcript termini
Library construction consists of the following steps: (1) reverse-transcription primed with an oligonucleotide consisting of a universal sequence that serves downstream as a PCR anchor, followed by T(10)VN (i.e., 10 thymidines, then a random base other than a thymidine, then a random base), (2) second-strand synthesis using random hexamers linked to a second PCR anchor, and (3) nested PCR to add Illumina-specific adapters while preserving strand orientation (Fig. 1A; See Supplemental File 1 for detailed protocol). A primer ending in 10 Ts is then used for sequencing. This protocol yields an antisense read beginning with the base immediately upstream of the polyA stretch. Amplicons are typically 200–500 bp after accounting for adapter sequences (Fig. 1B) and are compatible with standard cluster generation protocols. We applied PolyA-seq to 24 samples from five species, with each sample sequenced in one lane on an Illumina GAIIx sequencer. We aligned reads to the genome, transcripts, and exon–exon splice junctions, and retained all uniquely mapped reads for further analysis (Fig. 1C; see Methods for more details).
Figure 1.

(A) Schematic overview of PolyA-seq. Input was polyA+ selected RNA (green). Reverse transcription using U1-T10VN was followed by RNase H treatment to degrade RNA. Second-strand synthesis using U2-N6 was achieved through a random-primed Klenow extension. U1 and U2 have sequence complementarity to Illumina-specific adapters, which are added through PCR. This yields DNA libraries that can be directly sequenced. (B) A typical library consists of amplicons ranging from 200 to 500 bp (Illumina adapters account for 79 bp). (NTC) No-template control. (C) Computational procedure: reads were aligned to the genome and transcriptome ([*] defined here as known and predicted splice junctions extracted from UCSC Known Genes, RefSeq, and Ensembl, followed by conversion to genomic coordinates; see Methods for more details). Matches with unique loci were then filtered on internal priming potential and clustered into polyA sites.
PolyA-seq is an accurate approach for DGE
To assess the quantitative potential of PolyA-seq, we assayed the Human Brain Reference and Universal Human Reference (UHR) MAQC samples (Shi et al. 2006) in technical replicates. We measured expression as reads per million, namely, the number of reads aligned to a transcript divided by the total number of uniquely aligned reads in the experiment (in millions). Since we were interested in demonstrating that PolyA-seq is a simple approach for DGE applications, we used all mapped reads for this analysis, rather than filtered reads (see below); however, using filtered reads had a negligible impact on DGE accuracy (data not shown). We found reproducibility to be high (Brain technical replicate Pearson r = 0.994, Fig. 2A; UHR technical replicate Pearson r = 0.988). We also observed good agreement with qRT–PCR (Pearson r = 0.948 for Brain/UHR ratio; Fig. 2B). In a systematic comparison of six expression profiling approaches applied to MAQC data (qRT–PCR [Shi et al. 2006], Affymetrix microarrays [Shi et al. 2006], Agilent microarrays [Shi et al. 2006], RNA-seq [Bullard et al. 2010], and 3′-tag DGE [Asmann et al. 2009]), PolyA-seq performed at least as well as any other method in both ratio and absolute gene-expression quantification (Fig. 2C; see Methods for details). RNA-seq and PolyA-seq attained the highest agreement with qRT–PCR in the ratio-based comparisons. Motivated by the possibility that one of these approaches may be superior when sequencing throughput is limited (e.g., when multiplexing), we assessed correlation with qRT–PCR with expression values computed from randomly selected subsets of mapped reads. Both methods were considerably less accurate with fewer than 1 million mapped reads, but did not differ significantly in their performance at any level of input (Fig. 2D). Both approaches yielded similar proportions of uniquely mappable reads (71% for RNA-seq; see Table 1 for PolyA-seq).
Figure 2.

PolyA-seq DGE. (A) DGE correlation of MAQC Human Brain technical replicates independently processed from total RNA (Pearson r = 0.994). (B) DGE correlation of PolyA-seq with MAQC qRT–PCR for Brain/UHR ratio (r = 0.948). (C) Correlation values among commonly used expression technologies applied to MAQC (Shi et al. 2006) samples. Bottom, left of diagonal are correlations based on Brain/UHR ratios; top, right are correlations based on the absolute expression values (average r of brain vs. brain and UHR vs. UHR). All comparison data are published: qRT–PCR (Shi et al. 2006), Agilent (Shi et al. 2006) and Affymetrix (Shi et al. 2006) microarray data, RNA-seq (Bullard et al. 2010), 3′DGE (Asmann et al. 2009), NSR (Armour et al. 2009). (D) Pearson correlations of Brain/UHR qRT–PCR improve with increasing numbers of mapped reads for PolyA-seq and RNA-seq. Values represent the average from 100 random sampling iterations and error bars indicate standard deviation. See Methods for further details on processing of expression data.
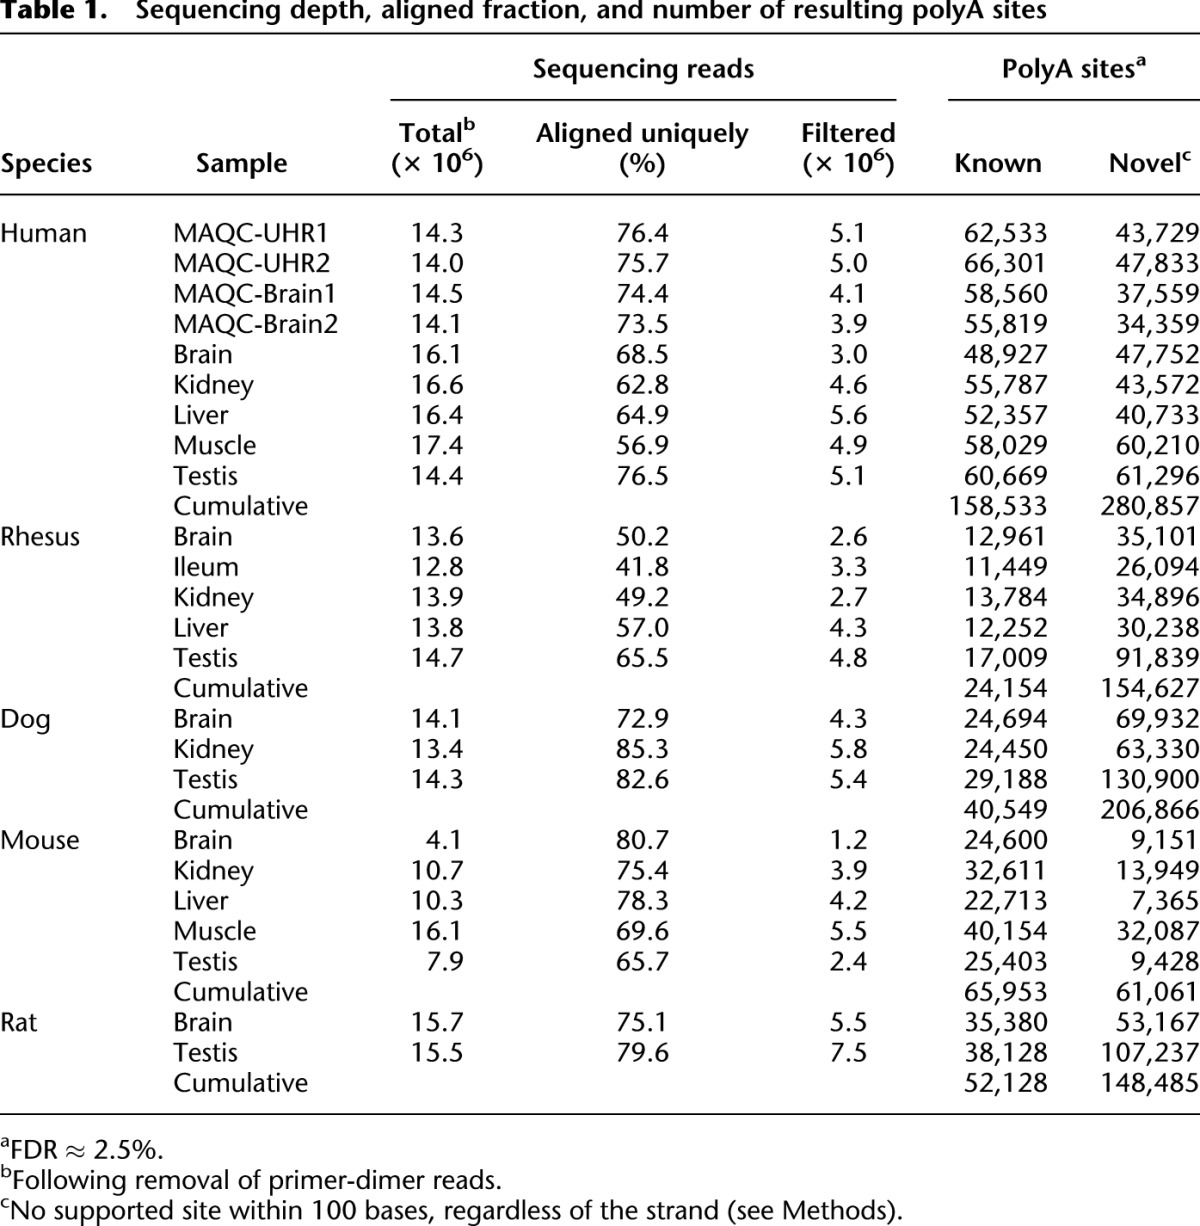
Table 1.
Sequencing depth, aligned fraction, and number of resulting polyA sites
Discriminating genuine polyA sites from internal priming events
Since PolyA-seq relies on priming from a stretch of adenines, it captures polyA tails added post-transcriptionally, as well as internal (i.e., transcribed) stretches of adenines encoded in the genome. EST, full-length cDNA, GIS-PET (Fullwood et al. 2009), PAS-seq (Shepard et al. 2011), and polyA capture cloning and sequencing (Mangone et al. 2010) strategies also exhibit some degree of internal priming. Building on previous efforts (Lee et al. 2007), we used genomic sequence immediately downstream from our reads to distinguish genuine polyA sites from internal priming events. We built an empirical model that estimates the probability that any given site reflects a genuine polyadenylation event based on the 10 bases immediately downstream from the site (corresponding to the length of the RT primer). To build the model, we first compiled lists of internal priming events and genuine polyA sites experimentally. We generated PolyA-seq libraries from UHR, but used an oligo ending with 10 Ts (i.e., no VN) for first-strand synthesis. This led to random placement of PolyA-seq reads within A-stretches. A total of 923,911 reads contained genome-alignable 5′ ends, but ended with unalignable stretches of As, thereby defining 28,818 unique genuine polyA sites (see Methods for further details). Reads whose 3′ ends could be perfectly aligned to the genome were treated as internal priming events (see Methods and Supplemental Figure 1 for more details). Some of these reads may, in fact, represent polyA sites, since the T10 primer can hybridize to the 5′ end of a polyA tail by chance. However, we estimate this proportion to be small, and these false-negatives can only lead to an underestimate of false discovery (see Methods).
We found a striking difference between priming site base frequencies at internal and polyA sites (Supplemental Fig. 1), and used these distributions to construct a log-odds scoring model that estimates the probability of a site being genuine vs. internally primed. Leveraging this model and the map of internal priming and polyA events in UHR, we calibrated our filtering threshold to a sensitivity of 85.6%. In the UHR data set this corresponds to a false-discovery rate (FDR) of 2.5% (Supplemental Fig. 2; see Methods) that was also consistent with additional RT–PCR based validation (Supplemental Figs. 3–5). Given the similar genomic and transcriptional complexities of all samples sequenced (Chan et al. 2009), we expect this number to be generally representative of the FDR in mammalian samples. Base frequencies of filtered sites strongly resemble those of well-established gene termini (Supplemental Fig. 6A), and our model is substantially better than simple filtering based on the number of downstream adenines as implemented previously (Lee et al. 2007; Shepard et al. 2011) (Supplemental Table 1; e.g., Supplemental Fig. 6B). Furthermore, we observed hundreds of previously reported polyA sites that are likely internal priming events (e.g., Supplemental Fig. 6C). We note that simply using a sequencing primer that lacks 10 terminal Ts to identify genuine polyA sites would not reveal the original RNA priming site, since the primer used in first-strand synthesis is incorporated into the sequencing library (not the RNA priming site) (Fig. 1A). Finally, we note that including a parameter that represents the read counts for each site to aid in discriminating real sites from internally primed sites did not improve performance (data not shown). We reasoned that real sites may have overall higher usage (i.e., more reads supporting them), but this was not the case.
From visual inspection of the data it was apparent that known polyA sites typically corresponded to a major cluster of reads mapped to a single position, with several minor peaks within a few bases. This “wiggle” is also evident in EST and cDNA alignments (Fujita et al. 2011) and is a likely consequence of the inexact nature of transcriptional cleavage (Proudfoot et al. 2002). We therefore clustered all peaks within 30 bases on the same strand, and retained only the highest peak within each cluster; varying this window from 10 to 200 bp did not significantly impact the number of sites (Supplemental Fig. 7). Table 1 summarizes the number of PolyA-seq reads and polyA sites that we identified in each sample. Reproducibility of PolyA-seq is high; 83% and 84% of Brain and UHR polyA sites detected in the MAQC samples, respectively, were also identified in the corresponding technical replicate.
PolyA-seq is precise and captures many known, novel, and alternative polyA sites in all species
We evaluated the precision and complexity of our atlas in human, where the transcriptome is extensively annotated (compared with rhesus, for example), and where we had the most data (9/24 samples). A total of 99.3% of UHR PolyA-seq reads that overlapped with a known RefSeq 3′UTR (excluding 8% of 3′UTRs that overlapped other genes on opposite strands) agreed on strand of origin, demonstrating the high strand specificity of PolyA-seq (example shown in Fig. 3A). The vast majority of our human polyA sites agree with known transcript termini to single-base precision (Fig. 3A–C). The single dominant peak in Figure 3B corresponds to known transcript termini (see Methods for further details), and the sites situated upstream are likely alternative polyA sites (tissue-dependent example shown in Fig. 3C), which, in human, outnumber uncharacterized transcript extensions (Fig. 3B).
Figure 3.

Assessment of basic features of the PolyA-seq atlas. (A) PolyA-seq detects polyA sites in a strand-specific manner. Two polyA sites (vertical spikes) are detected in human splicing factor PTBP1 (forward genomic strand, indicated by arrows) in all tissues, while LPPR3 (reverse strand) has a single polyA site, detected only in brain. _Y_-axis units are reads per million (see Methods; note that _y_-axis scales vary among tissues). PolyA-seq sites on the forward and reverse genomic strands are shown in different colors. (B) Human sites agree to single-base precision with known transcript termini. Known termini represent the 3′-most site reported by RefSeq, UCSC KG, or Ensembl per gene. (C) PolyA-seq reveals constitutive and tissue-dependent polyA sites. In human LGI4, polyA site choice is governed by alternative splicing. The 5′-most site is used in all tissues even as absolute expression levels fluctuate (see A for details). The intermediate site is used primarily in liver, while the downstream site is repressed in kidney, but is otherwise expressed at levels similar to the upstream site. (D) Number of polyA sites/3′UTR in five human tissues and UHR (navg/tissue = 16,387, ntotal uniq = 20,873; see Methods for 3′UTR compilation). All samples were normalized to equal numbers of aligned sequencing reads by random selection. (Black lines) Sites/3′UTR for aggregated data from these six samples. (E) Number of sequencing reads/site; sites were selected based on decreasing order of usage per 3′UTR. (F) Lineage-dependent polyadenylation of a pri-microRNA transcript. PolyA-seq detects polyadenylation downstream from the microRNA cluster containing let7a1, let7f1, and let7d in all tissues assayed in all species (data not shown, but see Supplemental Fig. 8 for additional details; for simplicity, PolyA-seq data and polyA signals are shown here only for human, rhesus, and mouse kidney, and only for the sense strand; arrows within microRNA precursors indicate the direction of transcription). In human and rhesus, two polyA sites (purple spikes) correspond to two canonical polyA signals (AATAAA; black tick marks), the first of which is present only in primate genomes (data not shown). In rat, mouse, and dog, only the downstream polyA site is detected, in accordance with the absence of the upstream polyA signal. (G) Distribution of reads and polyA sites across genomic features. All reads were aggregated in each species and then filtered and clustered as described in the main text.
To begin to explore the distribution of alternative polyA sites, we first clustered 3′UTRs annotated by RefSeq (Wheeler et al. 2003), UCSC Known Genes (KG) (Fujita et al. 2011), and Ensembl into 27,175 unique 3′UTR models (see Methods for further details). We also extended each model by 1 kb to capture uncharacterized transcript extensions. We then asked how many sites are detected per UTR model in each human tissue. To enable comparative analysis we accounted for different numbers of aligned input reads by subsetting each human sample to 9,886,234 aligned reads (to match human muscle) by random selection. A total of 20,873 (76.8%) 3′UTR models were detected in at least one human tissue; on average, 46.3%, 27.9%, and 30.7% of UTRs had one, two, and three or more detected sites (Fig. 3D). Aggregating reads across tissues revealed a shift toward more sites per gene, indicating that many of these sites are tissue-dependent (Fig. 3C). Overall, dominant (most utilized) sites account for >90% reads (Fig. 3D), suggesting that, although prevalent, secondary sites tend to be used much less frequently than dominant sites.
In all five species we observe excellent concordance with known polyA sites. Most PolyA-seq reads map to known polyA sites, although most polyA sites are novel, particularly in rat, dog, and rhesus, where existing annotations are not as extensive as in human and mouse (Fig. 3G; see Methods for further details). This result is consistent with our observation regarding usage of dominant sites, suggesting that novel sites are often used at lower levels, and may explain why they have not been previously reported. It is unlikely that low-frequency sites are enriched for false-positives, since inclusion of a parameter that captures site usage in our filtering model did not improve performance. In other words, low-frequency sites are just as likely to be real sites as are high-frequency sites. A primate-specific polyA site in a microRNA cluster is shown in Figure 3F, occurring 75 bp upstream of a conserved site.
Polyadenylation in noncoding RNAs
In addition to detecting polyadenylation in mRNAs, PolyA-seq captures polyadenylated noncoding RNAs, including primary microRNA transcripts and antisense RNAs. For example, polyA sites are detected downstream from numerous let-7 and other microRNA clusters in all or nearly all tissues, corroborated by ESTs in human, mouse, and rat, but not dog or rhesus, where ESTs are scarce (e.g., Fig. 3F; Supplemental Fig. 8). Polyadenylation downstream from the liver-specific microRNA MIR122 is detected very highly in liver but not in any other tissue (Supplemental Fig. 9A); similarly, MIR124-1, known to be brain-specific, is primarily detected in brain (Supplemental Fig. 9B). In species with abundant EST data, such as human and mouse, ESTs corroborate PolyA-seq sites. In other species, particularly dog and rhesus, PolyA-seq supplements predictions based on sequence conservation by providing direct evidence of transcription. Noncoding RNAs detected via PolyA-seq also include the human accelerated region (HAR) transcripts HAR1A and HAR1B (Supplemental Fig. 10A), XIST (Supplemental Fig. 10B), and HOTAIR (Supplemental Fig. 10C), as well as transcripts antisense to DLX1 (Supplemental Fig. 11A) and HOXA11 (Supplemental Fig. 11B).
Motif enrichment analysis
In each tissue, and for all possible 6-mers, we assessed the frequency of 6-mer occurrence within 150 bp of all polyA sites and compared it with that observed in randomly selected 3′UTR sequences of the same length (Table 2). The top 100 most statistically enriched 6-mers were identified by calculating _Z_-scores for the difference between tissue and background using a normal approximation to the binomial distribution. Positional bias for each k-mer was then assessed by calculating a χ2 statistic assessing the null hypothesis of uniform positional distribution of the k-mer within 150 bp of polyA sites in a tissue. The top 10 positionally enriched k-mers from each tissue, as well as the frequency of occurrence of the 6-mer at any position near a polyA site are provided. In all cases, these frequencies are highly enriched relative to background (Fisher's exact test _P_-values below the level of computing precision in all cases). A total of 98% of all polyA sites identified contained a match to one of these hexamers and we observed the expected enrichment upstream of sites (Fig. 4A). Individual base frequencies (Fig. 4B) also supported the known CA dinucleotide enrichment at the cleavage site (Sheets et al. 1990; Chen et al. 1995).
Table 2.
Observed 6-mer frequencies near polyA sites in five human tissues and random 3′UTR background sequence
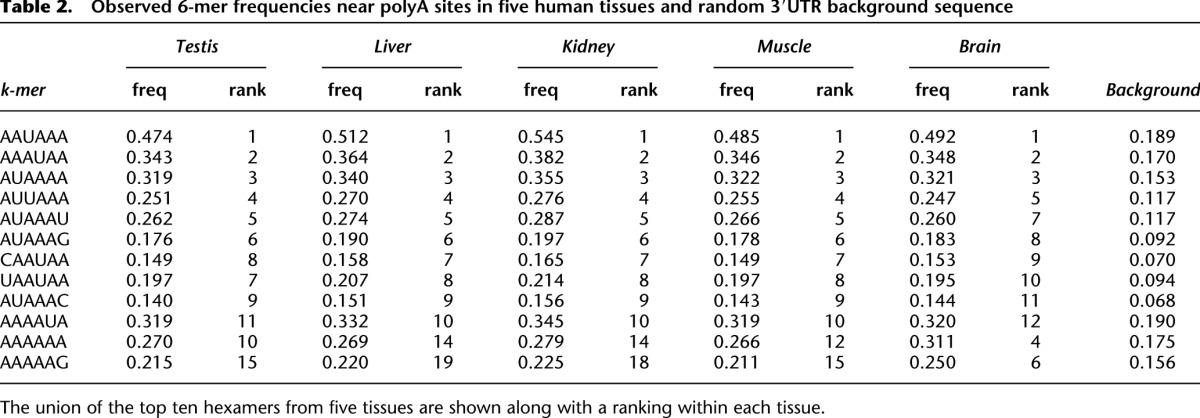
Figure 4.

Presence of the canonical polyadenylation sequence signal at filtered polyA sites. (A) The distribution of polyadenylation motif locations relative to polyA sites is enriched at a position 20–22 bp upstream of the polyA site, with a secondary peak at 10–11 bp. Positional frequencies of the 12 top-scoring hexamers (Table 2) are shown. The majority of sequences (98%) have either a perfect match or a site with a single mismatch to the canonical sequence. (B) Mean base content surrounding polyA sites computed at each base.
Evolutionary conservation of polyA site usage
To our knowledge, this study is the first systematic and unbiased effort to compile polyA sites in matched tissues across multiple species in parallel. Given the extent of tissue-specific alternative polyA-site usage, an obvious evolutionary question is whether polyA-site usage is conserved across species or whether species carry unique polyadenylation signatures that may drive phenotypic variation. We reasoned that if polyA-site usage was in general under purifying selection, usage should be more conserved in the same tissue across species than in different tissues within the same species.
To begin to address this question we compiled a five-way orthologous set of genomic coordinates for each polyA site in our atlas. A total of 2590 polyA sites were detected in at least one tissue of every species (Fig. 5A). We normalized site usage in each sample to _Z_-scores (number of standard deviations away from the mean number of reads/site) and clustered sites (Fig. 5B; hierarchical, Pearson correlation-based distance, average linkage). To comprehensively represent the similarities among samples, we also clustered the Pearson similarity values (Fig. 5C). We found that polyA-site usage is often strikingly similar in orthologous tissues, particularly in brain, kidney, and liver (Fig. 5C). Clusters of similar tissues are also better pronounced between closely related species. Rhesus and human tissues, for example, as well as mouse and rat tissues, tend to be more strongly correlated. Conservation of gene expression across similar tissues has been shown previously (Chan et al. 2009) and may be contributing to the general conservation of polyadenylation that we observe. In any case, this observation suggests that alternative polyadenylation is not a dominant force driving phenotypic diversity. Differences in conservation patterns among tissues present an opportunity for future research.
Figure 5.

Evolutionary conservation of polyA site usage. (A) Nonhuman polyA sites were transferred to human coordinates (see Methods), combined with human polyA sites, and clustered. (B) 2D clustering of 2590 orthologous sites detected in at least one sample in each species based on polyA site usage/expression. PolyA site expression was normalized to _Z_-scores (standard deviations away from mean) within each sample. (C) 2D clustering of Pearson correlation coefficients between all pairwise sample combinations. Most samples exhibit higher correlation with cognate samples in other species than with samples in the same species (e.g., brain, liver, and testis). All clustering was performed hierarchically using Pearson correlation as a measure of distance and average linkage for grouping.
Discussion
Our primary intent was to generate an accurate, comprehensive, and systematic mapping resource to augment gene structure annotation efforts and to empower additional functional studies. Following our robust filtering scheme, experimental validation revealed high sensitivity (∼85%) and low false discovery (∼2.5%), and strong agreement with previously defined polyA sites (Fig. 3; Table 1). Positional enrichment for the canonical polyA signal (Fig. 3) supports these strong performance metrics. We discovered more than 60,000 novel polyA sites in each of the five species, and more than ∼150,000 in rat, dog, and rhesus, where previous annotation is limited (Table 1). In all species the ratio of novel to known sites is greater in the cumulative tally of unique sites than in any individual tissue, suggesting that most of the novel sites are tissue-specific. While some genes appear to predominantly express a single polyA site across normal tissues and others harbor tissue-dependent sites (e.g., ELAVL1; Supplemental Fig. 6B), close to 70% of genes consistently use multiple polyA sites across all tissues in which they are expressed.
Although the majority of sequencing reads support known polyA sites, most sites, particularly in species where annotation is extensive (e.g., human, mouse), are novel (Fig. 3G). This implies that polyadenylation at novel sites tend to be low-frequency events (i.e., supported by few reads). Our validation/filtering efforts strongly suggest that these sites are genuine polyadenylation events (see Results), although their physiological roles are unclear. Similar to early reports of widespread transcription (Cheng et al. 2005), it was later shown that by mass the transcriptional origin of most nonribosomal RNA in a cell can be traced to coding exons or pre-mRNAs (van Bakel et al. 2010). Indeed, the functional roles of thousands of novel transcripts were widely debated, although it was later shown that a substantial class of “novel transcripts” plays more general roles in transcriptional regulation (Neil et al. 2009; Xu et al. 2009). Similarly, we believe that there will be examples of novel low-frequency polyA sites that have important functional implications, but the majority are likely polyadenylation events of cryptic transcripts or aberrant events that are tolerated by the cell. Nonetheless, this atlas contains thousands of novel high-frequency sites that will aid transcriptional annotation efforts, particularly in less defined species (e.g., rhesus, dog).
PolyA-seq provides concrete evidence of transcription, which is particularly important for rare transcripts (e.g., Supplemental Figs. 8–12) and generally in species with few ESTs, such as rhesus and dog. For example, human DLX1-AS (antisense to DLX1) was previously annotated only via its mouse orthologs (Supplemental Fig. 11B), and the let-7a-1 cluster in rhesus was previously annotated with a single EST (Fig. 3F). By extension, PolyA-seq results can be used to identify novel transcripts and can serve to complement RNA-seq data as well as data sets capturing 5′ ends of mRNAs (Yamashita et al. 2011) and microRNAs (Chien et al. 2011). We observed a low level of polyadenylation in the body of some microRNA precursors (e.g., Supplemental Fig. 9B,C). Since transient RNA polyadenylation is reported to occur during RNA degradation (Slomovic et al. 2010), we hypothesized that PolyA-seq captures the 5′ portion of primary transcripts following cleavage by DROSHA. We therefore examined the precise location of these polyA sites, and found that they lie immediately upstream of the mature transcripts (e.g., Supplemental Fig. 9C,D), consistent with transient polyadenylation of degradation precursors.
A major outstanding biological question is how alternative polyadenylation (APA) is regulated. In general, we observed similar proportions of usage between the dominant and alternative sites, even as absolute expression fluctuates (Supplemental Fig. 9). Even genes with splicing-dependent APA (e.g., Fig. 3C; Supplemental Fig. 13) tend to behave consistently across tissues. This supports the theory that APA is regulated by _cis_-acting regulatory effects such as sequence motifs and secondary structure within the transcripts and/or _cis_-acting DNA regulatory elements that impact transcription, which, in turn, affects 3′ end processing (Di Giammartino et al. 2011). However, numerous studies have reported dynamic behavior of APA; 3′UTR length can vary during development (Ji et al. 2009; Mangone et al. 2010), for example, and some 3′UTRs become truncated in cancer samples (Sandberg et al. 2008). These and other observations support a second theory that it is the environment, namely, the concentrations of _trans_-acting factors, that regulate polyA site selection and usage. We believe that our five-species tissue atlas and PolyA-seq are uniquely positioned to help reveal the mechanisms underlying APA. To this end we envision the following future studies:
- An array of approaches aimed at discovery of _cis_-acting regulatory elements, such as sequence motifs and nucleic acid structural elements, are possible. The atlas offers three dimensions of evidence for functional significance: quantitative levels of site usage, tissue specificity, and conservation of usage in other species. Motifs/structural elements that are enriched in many combinations of these three criteria (e.g., brain-specific motif present in humans and rhesus, but not in other mammals, that is associated with promoter-distal alternative polyA sites) will yield interesting biological insights into APA.
- Correlation of APA with additional data, such as RNA-seq, ChIP-seq, and DNase sensitivity maps to identify novel candidate _trans_-acting factors involved in regulating APA. Global genome binding maps of numerous transcription factors, histone modifiers, and RNA Pol II activities in many mammalian tissues are becoming available. A significant spatial correlation between binding affinity and a specific type of APA from the three-dimensional sampling space of this atlas (see 1 above) may yield novel factors involved in APA.
- Correlations of APA with gene expression to identify _trans_-acting APA regulators. Previous studies have revealed up-regulated levels of the core polyadenylation factors in iPS cells (Shi et al. 2009) and a general down-regulation in differentiated tissues, where 3′UTRs tend to be longer (Ji et al. 2009), suggesting that this approach is worthwhile. An atlas of many tissues where both expression and polyA site usage are computed from the same data set offers a powerful resource to identify patterns of gene expression that correlate with APA (and possibly presence of _cis_-acting factors). This may be a powerful approach to narrow the list of candidate factors thought to play a role in specific instances of APA.
- Application of PolyA-seq to mouse knockouts or other genetic models, particularly systems where RNA-binding proteins are perturbed, could yield additional insight into APA. An example where this was done successfully was with NOVA2, which was ultimately shown to regulate APA (Licatalosi et al. 2008).
PolyA-seq as a method is also a practical approach for DGE and eliminates the need to account for transcript length when quantifying DGE, which is essential when using traditional RNA-seq. PolyA-seq is thus better powered over RNA-seq to detect expression differences in short transcripts. Furthermore, since priming of reverse transcription is driven solely by adenines, biases in hybridization kinetics caused by transcript sequence differences are also averted. PolyA-seq can also accommodate paired-end reads, which could link polyA sites with upstream exons; we have done this successfully by simply changing one of the PCR primers to be compatible with paired-end flow cells (data not shown). One could also incorporate barcodes into the second-strand sequencing primer, which would further extend the scalability of the assay by enabling multiplexing. Application of PolyA-seq to disease states may reveal aberrant polyA-site usage, potentially leading to a novel class of biomarkers and candidates to explain disease etiology.
Methods
Tissues
FirstChoice Human Reference brain total RNA was obtained from Ambion (Applied Biosystems). UHR RNA was purchased from Stratagene Corp. Mouse and dog tissue total RNAs were purchased from BioChain. Total RNA from rat tissues and remaining human tissues were purchased from Zyagen. Rhesus tissue RNAs were provided by Merck & Co., Inc. PolyA+ RNA was isolated using the Dynabead mRNA Purification Kit according to the manufacturer's instructions (Invitrogen, cat # 610.06). Supplemental Table 2 contains a summary of all RNA samples used in this study.
PolyA-seq library preparation and sequencing
Two microliters of 0.1 uM-tailed dT primer T(10)VN was combined with 150 ng of polyA+ RNA in a final volume of 11 μL (see Supplemental File 1 for all primer sequences and detailed protocol). The primer-template mix was heated at 65°C for 5 min and chilled on ice before adding 9 μL of reverse transcription master mix (4 μL of 5x buffer, 2 μL of 10 mM dNTPs, 1 μL of 100 mM DTT, 1 μL of RNaseOUT, and 1 μL of SuperScript III enzyme). The 20-μL reverse-transcription reaction was incubated at 40°C for 90 min, 70°C for 15 min, and cooled to 4°C. RNA template was degraded by adding 1 μL of RNase H (Invitrogen Corp.) and incubating at 37°C for 20 min, 75°C for 15 min, and cooling to 4°C. DNA was subsequently purified using the QIAquick PCR Purification kit and eluted with 65 μL of elution buffer (Qiagen, Inc.). For second-strand synthesis, 60 μL of purified cDNA was added to 40 μL of Klenow master mix (12 μL of water, 10 μL of 10x NEBuffer 2, 5 μL of 10 mM dNTPs, 3 μL of 5 units/ul exo-Klenow fragment; M0212L, New England Biolabs, Inc.) and 10 μL of 10 uM-tailed random hexamer primer. The 100-μL reaction was incubated at 37°C for 30 min and cooled to 4°C. DNA was purified from the second-strand reaction by incubating with 1.8 volumes of Agencourt AMPure XP beads (Beckman Coulter) for 5 min, washing twice with 70% EtOH, and eluting with 50 μL of elution buffer. This step greatly reduced the number of clones with inserts <40 nt. For PCR amplification, 33 μL of purified second-strand synthesis reaction was combined with 17 μL of PCR master mix (10 μL of 5x Buffer 2, 1 μL of 25 mM MgCl2, 1 μL of 10 mM dNTPs, 2 μL of 10 uM forward primer, 2 μL of 10 uM reverse primer, 1 μL of ExpandPLUS enzyme; Roche Diagnostics Corp.). Samples were denatured for 2 min at 94°C, followed by two cycles of 94°C for 10 sec, 40°C for 2 min, 72°C for 1 min; 8 cycles of 94°C for 10 sec, 60°C for 30 sec, 72°C for 1 min; 15 cycles of 94°C for 15 sec, 60°C for 30 sec, 72°C for 1 min; and 72°C for 5 min to polish ends before cooling to 4°C. Double-stranded DNA was purified using AMPure XP beads as described above. Libraries were sequenced on an Illumina Genome Analyzer IIx using v4 reagents, and bases were called using the Illumina Analysis Pipeline (v1.4). PolyA-seq raw read sequences can be found at the NCBI Sequence Read Archive (submission SRA039286), while alignments and filtered sites are available at GEO (GSE30198). Note that PolyA-seq reads are antisense.
Read alignment
Reads were reverse-complemented, then aligned with SOAP2 (Li et al. 2009) to the respective genome and to the set of splice junctions generated from RefSeq genes (Wheeler et al. 2003), Ensembl genes, and UCSC KG. All transcript/gene databases used in this study were downloaded from UCSC on May 2, 2011. Predicted splice junctions from ESTs, GENSCAN, and N-SCAN predictions were also used for genomic regions where experimentally defined transcript evidence was not available. All possible splice junctions corresponding to one- and two-exon skipping events in gene/transcript models above were represented; a minimum of 5 nt overlap per flanking exonic sequence was required for an alignment to be considered. Splice-junction alignments were converted into genomic coordinates, and reads that aligned uniquely were retained for further analysis. 3P-seq C. elegans reads (Mayr and Bartel 2009) were aligned with BLAT (Kent 2002), which is better able to cope with 3′-A overhangs.
Filtering internal priming events and estimating FDR
To generate a map of genuine polyA sites we ran PolyA-seq on UHR RNA as above, but used a primer ending in T10 instead of T10VN, and sequenced to 76 bp in single-end mode. Reads were aligned using BLAT (Kent 2002). Supplemental Figure 1 outlines our procedure for constructing the filtering model. Cases with perfectly aligned 5′ ends, but unaligned 3′ adenines (three or more), were considered genuine polyA sites. Cases where the entire read aligned perfectly were considered potential internal priming events, excluding sites with an AAUAAA motif or its variants (Beaudoing et al. 2000) at −40 to −10 nt and/or sites overlapping a 3′ end of a RefSeq transcript or EST (±10 bases from the end). The two distributions of priming site base frequencies were used to generate a log-odds model, where

pA and I are the genuine polyA site and internal-priming base frequencies, respectively. xi (Ai,Ci,Gi,Ti) denotes the base identity at position i within the downstream site being assessed, where Ai, Ci, Gi, Ti, are the frequencies of As, Cs, Gs, and Ts, at position i in the matrix. Thus, any 10-base sequence can be used to compute a polyA score, and performance on UHR T10VN data was excellent. The test set comprised 22,551 sites that agreed with genuine polyA sites above (positives) and 15,530 sites that agreed with internal priming events (negatives). At a score threshold of 3.0, we obtained a sensitivity of 85.6% and a specificity of 97.5% (1 - false-positive rate) on the test set.
Estimating the false-discovery rate (FDR; proportion of all predicted polyA sites that are incorrect) is more challenging than determining the false-positive rate (FPR; proportion of known negatives that are incorrectly called), since it requires knowledge about sites outside of the validated test set. Ideally, one would know where all the internal priming sites are and could measure FDR directly, since it would be exactly the same as FPR. Nonetheless, FDR can be estimated from the test set if the ratio of positives to negatives in the test set reflects the true underlying ratio in the complete set (i.e., the genome). In other words, if polyA sites and internal priming events are randomly sampled from the genome to construct the test set, FDR can be estimated as one minus the precision [i.e., the proportion of all predicted positives that are correct, or TP/(TP+FP)]. This lack of sampling bias is true for our test set; the ratio of polyA sites to internal priming sites was 1.45 (22,551/15,530) and the ratio of genuine polyA sites to internal priming stretches (measured from T10 reads) was 1.61 (0.92 million reads that are genuine polyA sites plus 5.7 million reads which are >98% As and likely derived from polyA tails, divided by 4.1 million reads that are likely internal priming events; see Supplemental Fig. 1); 1.61 is greater than 1.45, thus, we reduced the precision by this factor to estimate FDR (Supplemental Fig. 2D). At a polyA score threshold of 3.0, we estimate FDR to be 2.5%.
Comparison with known polyA sites
Coordinates of known transcript termini (Fig. 3B) were compiled from RefSeq, UCSC KG, and Ensembl transcript models (downloaded from UCSC) (Fujita et al. 2011), taking the 3′-most site when transcript isoforms overlapped on the same genomic strand. Known 3′UTR coordinates (Fig. 3D,E) were also compiled from RefSeq, UCSC KG, and Ensembl transcripts by collapsing overlapping isoforms (on the same strand) into a single 3′UTR model that represented the union of genomic coordinates. A total of 122,215 UTRs from these transcript sources were collapsed into 27,175 UTR models, of which 20,873 were detected in at least one human sample (16,387 were detected on average in each tissue). Previously reported polyA sites (Fig. 3G) were compiled from PolyA-DB2 (Lee et al. 2007), dbEST (Boguski et al. 1993), GenBank mRNAs (Wheeler et al. 2003), UCSC Known Genes (Fujita et al. 2011), RefSeq genes (Wheeler et al. 2003), and Ensembl genes (Flicek et al. 2011). Coordinates were obtained from UCSC (Fujita et al. 2011) when available, or by aligning against the respective genomes using BLAT (Kent 2002) (using default settings and taking the best alignment).
Evolutionary conservation of sites
To minimize differences due to sequencing depth, we randomly removed mapped reads within each sample to match mouse testis (5.2 million mapped reads), so that all samples had the same number of input reads (except for mouse brain, which had 3.3 million in toto). We then translated site coordinates from mouse, rat, dog, and rhesus to human using the LiftOver program and corresponding chain files, all obtained from UCSC; strandedness was preserved during this step. Sites lying within 30 bp on the same strand were clustered, and read counts were summed for each sample within each cluster. Multispecies clusters were retained only if they contained a site detected in at least one sample in every species (n = 2590). For every pair of samples, we calculated the Pearson correlation coefficient of the natural log of read counts across all polyA site clusters. Samples were then clustered based on these correlations. We used LiftOver in a similar manner to determine the number of human polyA sites lying in regions conserved in all other species and the fraction supported by PolyA-seq data in the other species.
Data access
PolyA-seq raw read sequences have been submitted to the NCBI Sequence Read Archive (SRA) (http://trace.ncbi.nlm.nih.gov/Traces/sra/sra.cgi) under accession number SRA039286. Alignments and filtered sites are available at the NCBI Gene Expression Omnibus (GEO) (http://www.ncbi.nlm.nih.gov/geo/) (study GSE30198). Filtered sites with normalized read counts are available via the UCSC Genome Browser (http://genome.ucsc.edu/).
Footnotes
[Supplemental material is available for this article.]
References
- Armour CD, Castle JC, Chen R, Babak T, Loerch P, Jackson S, Shah JK, Dey J, Rohl CA, Johnson JM, et al. 2009. Digital transcriptome profiling using selective hexamer priming for cDNA synthesis. Nat Methods 6: 647–649 [DOI] [PubMed] [Google Scholar]
- Asmann YW, Klee EW, Thompson EA, Perez EA, Middha S, Oberg AL, Therneau TM, Smith DI, Poland GA, Wieben ED, et al. 2009. 3′ tag digital gene expression profiling of human brain and universal reference RNA using Illumina Genome Analyzer. BMC Genomics 10: 531 doi: 10.1186/1471-2164-10-531 [DOI] [PMC free article] [PubMed] [Google Scholar]
- Beaudoing E, Freier S, Wyatt JR, Claverie JM, Gautheret D 2000. Patterns of variant polyadenylation signal usage in human genes. Genome Res 10: 1001–1010 [DOI] [PMC free article] [PubMed] [Google Scholar]
- Boguski MS, Lowe TM, Tolstoshev CM 1993. dbEST–database for “expressed sequence tags.” Nat Genet 4: 332–333 [DOI] [PubMed] [Google Scholar]
- Bullard JH, Purdom E, Hansen KD, Dudoit S 2010. Evaluation of statistical methods for normalization and differential expression in mRNA-Seq experiments. BMC Bioinformatics 11: 94 doi: 10.1186/1471-2105-11-94 [DOI] [PMC free article] [PubMed] [Google Scholar]
- Chan ET, Quon GT, Chua G, Babak T, Trochesset M, Zirngibl RA, Aubin J, Ratcliffe MJ, Wilde A, Brudno M, et al. 2009. Conservation of core gene expression in vertebrate tissues. J Biol 8: 33 doi: 10.1186/jbiol130 [DOI] [PMC free article] [PubMed] [Google Scholar]
- Chen F, MacDonald CC, Wilusz J 1995. Cleavage site determinants in the mammalian polyadenylation signal. Nucleic Acids Res 23: 2614–2620 [DOI] [PMC free article] [PubMed] [Google Scholar]
- Cheng J, Kapranov P, Drenkow J, Dike S, Brubaker S, Patel S, Long J, Stern D, Tammana H, Helt G, et al. 2005. Transcriptional maps of 10 human chromosomes at 5-nucleotide resolution. Science 308: 1149–1154 [DOI] [PubMed] [Google Scholar]
- Chien CH, Sun YM, Chang WC, Chiang-Hsieh PY, Lee TY, Tsai WC, Horng JT, Tsou AP, Huang HD 2011. Identifying transcriptional start sites of human microRNAs based on high-throughput sequencing data. Nucleic Acids Res 39: 9345–9356 [DOI] [PMC free article] [PubMed] [Google Scholar]
- Di Giammartino DC, Nishida K, Manley JL 2011. Mechanisms and consequences of alternative polyadenylation. Mol Cell 43: 853–866 [DOI] [PMC free article] [PubMed] [Google Scholar]
- Flicek P, Amode MR, Barrell D, Beal K, Brent S, Chen Y, Clapham P, Coates G, Fairley S, Fitzgerald S, et al. 2011. Ensembl 2011. Nucleic Acids Res 39: D800–D806 [DOI] [PMC free article] [PubMed] [Google Scholar]
- Fox-Walsh K, Davis-Turak J, Zhou Y, Li H, Fu XD 2011. A multiplex RNA-seq strategy to profile poly(A+) RNA: Application to analysis of transcription response and 3′ end formation. Genomics 98: 266–271 [DOI] [PMC free article] [PubMed] [Google Scholar]
- Fujita PA, Rhead B, Zweig AS, Hinrichs AS, Karolchik D, Cline MS, Goldman M, Barber GP, Clawson H, Coelho A, et al. 2011. The UCSC Genome Browser database: Update 2011. Nucleic Acids Res 39: D876–D892 [DOI] [PMC free article] [PubMed] [Google Scholar]
- Fullwood MJ, Wei CL, Liu ET, Ruan Y 2009. Next-generation DNA sequencing of paired-end tags (PET) for transcriptome and genome analyses. Genome Res 19: 521–532 [DOI] [PMC free article] [PubMed] [Google Scholar]
- Jan CH, Friedman RC, Ruby JG, Bartel DP 2011. Formation, regulation and evolution of Caenorhabditis elegans 3′UTRs. Nature 469: 97–101 [DOI] [PMC free article] [PubMed] [Google Scholar]
- Ji Z, Lee JY, Pan Z, Jiang B, Tian B 2009. Progressive lengthening of 3′ untranslated regions of mRNAs by alternative polyadenylation during mouse embryonic development. Proc Natl Acad Sci 106: 7028–7033 [DOI] [PMC free article] [PubMed] [Google Scholar]
- Kent WJ 2002. BLAT–the BLAST-like alignment tool. Genome Res 12: 656–664 [DOI] [PMC free article] [PubMed] [Google Scholar]
- Lee JY, Yeh I, Park JY, Tian B 2007. PolyA_DB 2: mRNA polyadenylation sites in vertebrate genes. Nucleic Acids Res 35: D165–D168 [DOI] [PMC free article] [PubMed] [Google Scholar]
- Levin JZ, Yassour M, Adiconis X, Nusbaum C, Thompson DA, Friedman N, Gnirke A, Regev A 2010. Comprehensive comparative analysis of strand-specific RNA sequencing methods. Nat Methods 7: 709–715 [DOI] [PMC free article] [PubMed] [Google Scholar]
- Li R, Yu C, Li Y, Lam TW, Yiu SM, Kristiansen K, Wang J 2009. SOAP2: An improved ultrafast tool for short read alignment. Bioinformatics 25: 1966–1967 [DOI] [PubMed] [Google Scholar]
- Licatalosi DD, Mele A, Fak JJ, Ule J, Kayikci M, Chi SW, Clark TA, Schweitzer AC, Blume JE, Wang X, et al. 2008. HITS-CLIP yields genome-wide insights into brain alternative RNA processing. Nature 456: 464–469 [DOI] [PMC free article] [PubMed] [Google Scholar]
- Mangone M, Manoharan AP, Thierry-Mieg D, Thierry-Mieg J, Han T, Mackowiak SD, Mis E, Zegar C, Gutwein MR, Khivansara V, et al. 2010. The landscape of C. elegans 3′UTRs. Science 329: 432–435 [DOI] [PMC free article] [PubMed] [Google Scholar]
- Marioni JC, Mason CE, Mane SM, Stephens M, Gilad Y 2008. RNA-seq: An assessment of technical reproducibility and comparison with gene expression arrays. Genome Res 18: 1509–1517 [DOI] [PMC free article] [PubMed] [Google Scholar]
- Mayr C, Bartel DP 2009. Widespread shortening of 3′UTRs by alternative cleavage and polyadenylation activates oncogenes in cancer cells. Cell 138: 673–684 [DOI] [PMC free article] [PubMed] [Google Scholar]
- Mercer TR, Wilhelm D, Dinger ME, Solda G, Korbie DJ, Glazov EA, Truong V, Schwenke M, Simons C, Matthaei KI, et al. 2011. Expression of distinct RNAs from 3′ untranslated regions. Nucleic Acids Res 39: 2393–2403 [DOI] [PMC free article] [PubMed] [Google Scholar]
- Montgomery SB, Sammeth M, Gutierrez-Arcelus M, Lach RP, Ingle C, Nisbett J, Guigo R, Dermitzakis ET 2010. Transcriptome genetics using second generation sequencing in a Caucasian population. Nature 464: 773–777 [DOI] [PMC free article] [PubMed] [Google Scholar]
- Mortazavi A, Williams BA, McCue K, Schaeffer L, Wold B 2008. Mapping and quantifying mammalian transcriptomes by RNA-Seq. Nat Methods 5: 621–628 [DOI] [PubMed] [Google Scholar]
- Neil H, Malabat C, d'Aubenton-Carafa Y, Xu Z, Steinmetz LM, Jacquier A 2009. Widespread bidirectional promoters are the major source of cryptic transcripts in yeast. Nature 457: 1038–1042 [DOI] [PubMed] [Google Scholar]
- Ng P, Wei CL, Sung WK, Chiu KP, Lipovich L, Ang CC, Gupta S, Shahab A, Ridwan A, Wong CH, et al. 2005. Gene identification signature (GIS) analysis for transcriptome characterization and genome annotation. Nat Methods 2: 105–111 [DOI] [PubMed] [Google Scholar]
- Ng P, Tan JJ, Ooi HS, Lee YL, Chiu KP, Fullwood MJ, Srinivasan KG, Perbost C, Du L, Sung WK, et al. 2006. Multiplex sequencing of paired-end ditags (MS-PET): A strategy for the ultra-high-throughput analysis of transcriptomes and genomes. Nucleic Acids Res 34: e84 doi: 10.1093/nar/gk1444 [DOI] [PMC free article] [PubMed] [Google Scholar]
- Ozsolak F, Kapranov P, Foissac S, Kim SW, Fishilevich E, Monaghan AP, John B, Milos PM 2010. Comprehensive polyadenylation site maps in yeast and human reveal pervasive alternative polyadenylation. Cell 143: 1018–1029 [DOI] [PMC free article] [PubMed] [Google Scholar]
- Pickrell JK, Marioni JC, Pai AA, Degner JF, Engelhardt BE, Nkadori E, Veyrieras JB, Stephens M, Gilad Y, Pritchard JK 2010. Understanding mechanisms underlying human gene expression variation with RNA sequencing. Nature 464: 768–772 [DOI] [PMC free article] [PubMed] [Google Scholar]
- Proudfoot NJ, Furger A, Dye MJ 2002. Integrating mRNA processing with transcription. Cell 108: 501–512 [DOI] [PubMed] [Google Scholar]
- Sandberg R, Neilson JR, Sarma A, Sharp PA, Burge CB 2008. Proliferating cells express mRNAs with shortened 3′ untranslated regions and fewer microRNA target sites. Science 320: 1643–1647 [DOI] [PMC free article] [PubMed] [Google Scholar]
- Sheets MD, Ogg SC, Wickens MP 1990. Point mutations in AAUAAA and the poly (A) addition site: Effects on the accuracy and efficiency of cleavage and polyadenylation in vitro. Nucleic Acids Res 18: 5799–5805 [DOI] [PMC free article] [PubMed] [Google Scholar]
- Shepard PJ, Choi EA, Lu J, Flanagan LA, Hertel KJ, Shi Y 2011. Complex and dynamic landscape of RNA polyadenylation revealed by PAS-Seq. RNA 17: 761–772 [DOI] [PMC free article] [PubMed] [Google Scholar]
- Shi L, Reid LH, Jones WD, Shippy R, Warrington JA, Baker SC, Collins PJ, de Longueville F, Kawasaki ES, Lee KY, et al. 2006. The MicroArray Quality Control (MAQC) project shows inter- and intraplatform reproducibility of gene expression measurements. Nat Biotechnol 24: 1151–1161 [DOI] [PMC free article] [PubMed] [Google Scholar]
- Shi Y, Di Giammartino DC, Taylor D, Sarkeshik A, Rice WJ, Yates JR 3rd, Frank J, Manley JL 2009. Molecular architecture of the human pre-mRNA 3′ processing complex. Mol Cell 33: 365–376 [DOI] [PMC free article] [PubMed] [Google Scholar]
- Slomovic S, Fremder E, Staals RH, Pruijn GJ, Schuster G 2010. Addition of poly(A) and poly(A)-rich tails during RNA degradation in the cytoplasm of human cells. Proc Natl Acad Sci 107: 7407–7412 [DOI] [PMC free article] [PubMed] [Google Scholar]
- Sultan M, Schulz MH, Richard H, Magen A, Klingenhoff A, Scherf M, Seifert M, Borodina T, Soldatov A, Parkhomchuk D, et al. 2008. A global view of gene activity and alternative splicing by deep sequencing of the human transcriptome. Science 321: 956–960 [DOI] [PubMed] [Google Scholar]
- Thomsen S, Azzam G, Kaschula R, Williams LS, Alonso CR 2010. Developmental RNA processing of 3′UTRs in Hox mRNAs as a context-dependent mechanism modulating visibility to microRNAs. Development 137: 2951–2960 [DOI] [PubMed] [Google Scholar]
- van Bakel H, Nislow C, Blencowe BJ, Hughes TR 2010. Most “dark matter” transcripts are associated with known genes. PLoS Biol 8: e1000371 doi: 10.1371/journal.pbio1000371 [DOI] [PMC free article] [PubMed] [Google Scholar]
- Velculescu VE, Zhang L, Vogelstein B, Kinzler KW 1995. Serial analysis of gene expression. Science 270: 484–487 [DOI] [PubMed] [Google Scholar]
- Wang ET, Sandberg R, Luo S, Khrebtukova I, Zhang L, Mayr C, Kingsmore SF, Schroth GP, Burge CB 2008. Alternative isoform regulation in human tissue transcriptomes. Nature 456: 470–476 [DOI] [PMC free article] [PubMed] [Google Scholar]
- Wang Z, Gerstein M, Snyder M 2009. RNA-Seq: A revolutionary tool for transcriptomics. Natl Rev 10: 57–63 [DOI] [PMC free article] [PubMed] [Google Scholar]
- Wheeler DL, Church DM, Federhen S, Lash AE, Madden TL, Pontius JU, Schuler GD, Schriml LM, Sequeira E, Tatusova TA, et al. 2003. Database resources of the National Center for Biotechnology. Nucleic Acids Res 31: 28–33 [DOI] [PMC free article] [PubMed] [Google Scholar]
- Wilhelm BT, Marguerat S, Watt S, Schubert F, Wood V, Goodhead I, Penkett CJ, Rogers J, Bahler J 2008. Dynamic repertoire of a eukaryotic transcriptome surveyed at single-nucleotide resolution. Nature 453: 1239–1243 [DOI] [PubMed] [Google Scholar]
- Xu Z, Wei W, Gagneur J, Perocchi F, Clauder-Munster S, Camblong J, Guffanti E, Stutz F, Huber W, Steinmetz LM 2009. Bidirectional promoters generate pervasive transcription in yeast. Nature 457: 1033–1037 [DOI] [PMC free article] [PubMed] [Google Scholar]
- Yamashita R, Sathira NP, Kanai A, Tanimoto K, Arauchi T, Tanaka Y, Hashimoto S, Sugano S, Nakai K, Suzuki Y 2011. Genome-wide characterization of transcriptional start sites in humans by integrative transcriptome analysis. Genome Res 21: 775–789 [DOI] [PMC free article] [PubMed] [Google Scholar]
- Yoon OK, Brem RB 2010. Noncanonical transcript forms in yeast and their regulation during environmental stress. RNA 16: 1256–1267 [DOI] [PMC free article] [PubMed] [Google Scholar]