The Earliest Thymic T Cell Progenitors Sustain B Cell and Myeloid Lineage Potentials (original) (raw)
. Author manuscript; available in PMC: 2012 Oct 1.
Published in final edited form as: Nat Immunol. 2012 Feb 19;13(4):412–419. doi: 10.1038/ni.2255
Abstract
The stepwise commitment from hematopoietic stem cells in the bone marrow (BM) to T lymphocyte-restricted progenitors in the thymus represents a paradigm for understanding the requirement for distinct extrinsic cues during different stages of lineage restriction from multipotent to lineage restricted progenitors. However, the commitment stage at which progenitors migrate from the BM to the thymus remains unclear. Here we provide functional and molecular evidence at the single cell level that the earliest progenitors in the neonatal thymus possessed combined granulocyte-monocyte, T and B lymphocyte, but not megakaryocyte-erythroid lineage potential. These potentials were identical to those of thymus-seeding progenitors in the BM, which were closely related at the molecular level. These findings establish the distinct lineage-restriction stage at which the T lineage commitment transits from the BM to the remote thymus.
At the heart of developmental and stem cell biology, as well as regenerative medicine, is the fundamental process of lineage commitment from self-renewing multipotent stem cells to lineage-restricted progenitors. In all species and organ systems this process occurs first during embryonic development, but is recapitulated postnatally and in adult life by adult multipotent stem cells to replenish cell lineages with a limited lifespan. Hematopoiesis represents the mammalian paradigm for how multilineage diversity can be achieved through commitment of multipotent stem cells into lineage-committed progenitors and the establishment of distinct blood cell lineages1. However, the exact cellular commitment pathways remain unclear1,2.
Whereas lineage-restricted progenitors for all other blood cell lineages can be generated from self-renewing hematopoietic stem cells (HSCs) in the postnatal bone marrow (BM), the final steps of T lymphocyte lineage restriction take place in the thymus3. Because the thymus cannot sustain HSCs, continuous thymopoiesis can only be secured through regular replenishment by BM-resident thymus-seeding progenitors (TSPs)4. However, the commitment stage(s) at which these progenitors migrate from the BM to the thymus is unknown. The thymus, as the BM, harbors multiple blood cell lineages5,6, however the identification of multipotent progenitors that match the lineage potential of candidate TSPs in the BM has not been possible so far. The early thymic progenitors (ETPs) have been extensively studied in the adult thymus, but their exact lineage potentials and relationship to candidate TSPs in the BM have remained unclear7.
Recent studies that evaluated the lineage potential of ETPs at the single cell level showed that a large fraction of adult ETPs have combined T cell and myeloid (granulocytemonocyte; GM) potential8,9. B lineage potential was however not detected in the single, highly purified, adult ETPs, suggesting that the most primitive progenitor in the thymus might have a T-GM restricted potential8,9. Similar studies of the fetal thymus have supported the T-GM restricted potential of ETPs, and failed to reveal any B cell potential10,11. However, other studies reported even rarer adult ETPs with combined T and B (but not myeloid) cell potential6, and candidate TSPs identified in the BM7, such as common lymphoid progenitors (CLPs)12, lymphoid-primed multipotent progenitors (LMPPs)13 and HSCs1, all possess B cell potential.
The megakaryocyte-erythroid (MkE) potential of ETPs is of particular relevance for the ongoing debate as to whether the first lineage commitment step in hematopoiesis results in a strict separation into common myeloid and lymphoid lineage commitment pathways as depicted in the still prevailing text-book hierarchical model for hematopoiesis1,14, or whether early lymphoid progenitors sustain GM but not MkE potential 2,13,15, as recently reported in human studies as well16,17. The MkE potential of purified ETPs has yet to be investigated5,6,8,9.
The fact that no multipotent thymic progenitors with the same lineage potentials as candidate multipotent TSPs in the BM have been identified yet contributes to the considerable gap in understanding the distinct roles of the local BM and thymus environments in promoting distinct pre-thymic and thymic stages of T cell lineage commitment. Here we demonstrate at the single cell level the existence of postnatal ETPs with combined T, GM and B cell but no MkE potential, establishing the exact lineage commitment step at which the multipotent T-lymphocyte progenitors must migrate to the thymus to allow the final steps of T-lineage restriction to be completed. The data reported here provide further support of a myeloid-based model for hematopoietic lineage commitment.
RESULTS
Neonatal ETPs have combined T, B and GM, but not MkE potential
The current knowledge about candidate TSPs and ETPs can only be reconciled (Supplementary Fig. 1) if either a T-GM restricted progenitor can be identified in the BM, a T-GM progenitor would be generated in the passage from the BM to the thymus and/or a thymic cell population with a combined T, GM and B cell lineage potential could be identified within or outside the ETPs. In the last scenario, the ETP could either be a lymphoid-GM restricted multipotent progenitor or a pluripotent hematopoietic stem- or progenitor cell that also possesses MkE potential. ETPs have mostly been studied in adult mice5,6,8,9. However, thymic involution, the physiological shrinking of the thymus with age that occurs in all vertebrates, implies that thymopoiesis, and therefore thymus seeding, is much more active in the early postnatal thymus18. The B cell potential of early thymocytes, at a population level, is significantly higher (although still low) in the neonatal thymus compared to the adult thymus19. In agreement with previous studies, Lin−CD4−CD8α−CD25−c-Kithi ETPs represented only 0.01% of adult thymocytes5 but as many as 40% of ETPs expressed cell surface Flt3, higher than previously reported20 (Fig. 1a). Also in agreement to previous findings, a low (3.5-4.5%) but highly reproducible frequency of Flt3 expressing ETPs generated B cells 6,20, whereas no other adult thymocyte progenitors, including Flt3− ETPs had any detectable B cell potential (Fig. 1b and Supplementary Fig. 2). The frequency of Lin−CD4−CD8α−CD25−c-Kithi Flt3hi ETPs increased more than 10-fold in newborn mice compared to adult mice (Fig. 1c), while the frequency of Lin−CD4−CD8α−CD25−c-KithiFlt3hi ETPs with B cell potential was 25% (Fig. 1d and Supplementary Fig. 3). Neither Lin−CD4−CD8α−CD25−c-KithiFlt3− thymocytes or downstream double negative (DN) 2-4 populations in the neonatal thymus had any B cell potential (Fig. 1d). Lin−CD4−CD8α−CD25−c-KithiFlt3hi newborn ETPs also produced B cells in vivo when transplanted into irradiated _Rag1_−/− mice, but only very low numbers of short-lived myeloid cells (Supplementary Fig. 4).
Figure 1.

ETPs are multipotent lympho-myeloid restricted progenitors. (a) Flow cytometry profiles and gating strategies for the detection of Lin−CD4−CD8α−CD25−c-KithiFlt3hi ETPs from young adult mice (4–6 weeks). Numbers in plots indicate percent ETPs among total thymocytes. DAPI, DNA-intercalating dye; FSC, forward scatter; SSC, side scatter; -W, width; -H, height. (b) Frequency of B cell potential of cultures seeded with a single Lin−Sca-1+c-Kit+Flt3hi bone marrow cell (LMPP; n = 320); a single Flt3hi ETP (n = 73 cells) or ten Flt3hi ETPs (n = 960 cells); ten Flt3− ETPs (n = 960 cells); or other DN thymocyte progenitor populations (DN1–DN4; n = 2,400 cells (seeded with 100 cells per well)), all from adult mice. (c) Flow cytometry profiles and gating strategies as in a, for cells from newborn mice (1 d). (d) Frequency of B cell potential as in b, for cultures of cells from newborn mice, seeded as single Flt3hi ETPs (n = 348 cells) or single Flt3− ETPs (n = 210 cells), and other DN thymocyte progenitor populations seeded at 100 cells per culture (n = 4,200–6,000 cells). (e) Expression of enhanced yellow fluorescent protein (eYFP) in ETPs from neonatal mice (n = 4) expressing Cre from the Cd79a promoter. (f) Frequency of cells with B cell potential (B; n = 348 cells), T cell potential (T; n = 204 cells), natural killer cell potential (NK; n = 48 cells), GM potential (grown in liquid (GM(L); n = 600 cells) or on stroma (GM(S); n = 64 cells)), megakaryocyte potential (grown in liquid (Mk(L); n = 1,080 cells) or on semisolid support (Mk(SS); n = 6; 200 cells per replicate)) or erythroid potential (E; n = 8; 500–1,000 cells per replicate) among Flt3+ ETPs from neonatal mice (positive controls, Supplementary Fig. 5). (g) Expression of myeloid markers Mac-1, Gr-1 and lysozyme M (reported as eGFP expression; left and middle), and morphological analysis (right) of sorted granulocytes (top) and monocytes (bottom) from cultured Flt3+ ETPs from neonatal mice. Scale bars, 5 μM. (h) Quantitative analysis of the expression of genes associated with lymphoid cells, myeloid cells and megakaryocytes–erythroid cells by purified Flt3+ ETPs from newborn mice (n = 6; 25 cells per replicate); results are presented relative to the expression of Hprt (encoding hypoxanthine guanine phosphoribosyl transferase). *, ≤0.001 (below detection limit). Data are representative of four experiments (a); fourteen experiments (c); seven (b) or sixteen (d) experiments (Flt3hi ETPs); sixteen experiments (bone marrow; b); four experiments (Flt3− ETPs (b) and other DN populations (b,d)); ten experiments (Flt3− ETPs; d); one experiment (e); two to sixteen experiments (f); one experiment (g); or two experiments (h; mean and s.e.m. in b,d,f; average and s.d. of six replicates in h).
Because B cell activity in the thymus might reflect the presence of cells already committed to the B cell lineage21,22, which overlap with the CD25−CD44+ phenotype of DN1 thymocytes, we performed an Mb-1 Cre fate mapping experiment, in which all committed B cell progenitors and their progeny are labeled with enhanced yellow fluorescent protein (eYFP)23,24. In agreement with previous studies23, cells of the B cell lineage, including all CD19+B220+CD43+c-Kit+ proB cells, as well as a fraction of Ly-6D+ CLPs (Lin−CD19−B220−Sca-1lowc-KitlowFlt3+IL-7Rα+Ly-6D+) were labeled in the BM (Supplementary Fig. 5a,b). No eYFP+ cells were observed in Lin−CD4−CD8α−CD25−c-Kithi ETPs (Fig. 1e) or in Ly-6D−CLPs (Lin−CD19−B220−Sca-1lowc-KitlowFlt3+IL-7Rα+Ly-6D−) and LMPPs (Lin−Sca-1+c-Kithi (LSK)Flt3hi) (Supplementary Fig. 5b,c).
In addition to B cells, newborn Lin−CD4−CD8α−CD25−c-KithiFlt3hi ETPs gave rise efficiently to cells of the T, NK and GM lineages, as previously demonstrated with adult ETPs (Fig. 1f,g and Supplementary Fig. 6a). In contrast, newborn ETPs were completely devoid of MkE potential (Fig. 1f). Adult ETPs lacked Mk potential as well, but, in agreement with previous studies, had GM potential (Supplementary Fig. 6a). Quantitative gene expression analysis showed that purified Lin−CD4−CD8α−CD25−c-KithiFlt3hi newborn ETPs expressed multiple GM and lymphoid, but not Mk and E affiliated genes (Fig. 1h). Single-cell PCR experiments showed that as much as 65% of newborn Lin−CD4−CD8α−CD25−c-KithiFlt3hi ETPs co-expressed GM and lymphoid genes, while lacking MkE gene expression at the single cell level (Fig. 2a).
Figure 2.
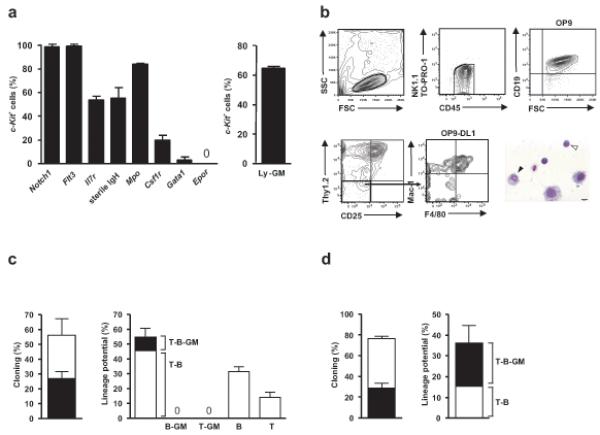
ETPs possess combined T, B and GM lineage potentials. (a) Single cell gene expression analysis of lymphoid, myeloid and MkE genes in purified newborn Flt3hi ETPs. Mean (± s.d.) frequency of cells expressing specified genes among cells positive for c-Kit gene expression (96-98% of total cells) (left; _n_=176 from 2 exp). The frequency (± s.d.) of ETPs with combined lymphoid-GM lineage transcriptional priming (right) based on co-expression of one or more genes for the lymphoid program (Il7r, sterile IgH), myeloid/GM program (Csf1r, Mpo) but not the MkE program (Gata1, Epor). (b) A representative clone from a single newborn WT Flt3+ETP cell with combined T, B and myeloid lineage potential determined by FACS and morphology analysis (myeloid, black arrowhead, lymphocyte, white arrowhead). (c,d) Cloning frequencies (left), of ETPs generating CD45+ cells (white bars) and CD45+ cells with a definitive lineage readout (grey bars). Lineage distribution of clones (right) from (c) single WT (_n_=132 from 3 exp) and (d) single vavP-mcl-1 ETPs (_n_=167 from 2 exp).
To establish whether the T, B and GM potential of neonatal ETPs reflects the existence of a multipotent lympo-myeloid progenitor in the thymus, or only a mixture of lineage-restricted progenitors, we assessed the combined lineage potentials of single Lin−CD4−CD8α−CD25−c-KithiFlt3hi ETPs. Single ETPs were sorted onto OP9 BM stroma to allow cells to expand for 54 hours, after which the expanded cells were split and transferred to OP9 and OP9-DL1 stroma for an additional 1 week to promote B- and combined T- and myeloid cell differentiation, respectively. Although the frequency of ETP-derived clones with GM readout was reduced compared to assays in which only the GM differentiation of ETPs was promoted (Fig. 1f), we could demonstrate the existence of Lin−CD4−CD8α−CD25−c-KithiFlt3hi single ETPs with combined T, B and GM lineage potentials (9.2% of clones with a lineage readout; Fig. 2b,c and Supplementary Fig. 7a). In fact, all the GM potential from wild-type ETPs was tracked to cells that not only had T cell potential as previously demonstrated8,9, but also possessed B lineage potential (Fig. 2c). Next, we used ETPs purified from vavP-mcl-1 transgenic mice25 to evaluate whether enhanced cell survival could sustain short-lived myeloid cells to increase the readout for combined myeloid and lymphoid potential. Whereas the B cell potential in vavP-mcl-1 neonatal thymuses remained restricted to Lin−CD4−CD8α−CD25−c-KithiFlt3hi ETPs (Supplementary Fig. 7c), the frequency of ETPs with combined T-B-GM readout increased to 20% of all single vavP-mcl-1 ETPs (as compared to 9.2% of WT ETPs) with a lineage readout (Fig.2d,e and Supplementary Fig. 7b). These findings in single cell clonal assays establish the existence of thymic ETPs with combined T, B and GM lineage potential.
Lympho-myeloid ETPs are the most multipotent thymic progenitors
We next explored whether the Lin−CD4−CD8α−CD25−c-KithiFlt3hi ETPs with combined T, B and GM lineage potentials represent the most multipotent progenitors in the neonatal thymus. The lack of detectable Mk and E potential in Lin−CD4−CD8α−CD25−c-KithiFlt3hi ETPs did not rule out the presence of rare pluripotent stem- or progenitor cells in the neonatal thymus. Thus, we first used highly sensitive flow cytometry analysis to investigate the expression of three antigens, CD15026, CD20127 and Mpl28, each highly expressed on most if not all HSCs as well as multipotent progenitors with sustained MkE potential. Neither of these antigens was expressed on Lin−CD4−CD8α−CD25−c-Kithi ETPs (Fig. 3a). Similar to a subfraction of BM LMPPs, all ETPs expressed the RAG1 gene, as assessed using a green fluorescent protein (GFP) reporter under control of the Rag1 promoter29 and most expressed the chemokine receptor CCR9 (Fig. 3b) in agreement with previous studies of adult ETPs30,31. No BM HSCs expressed either _Rag1_-GFP or CCR9 (Fig. 3b).
Figure 3.
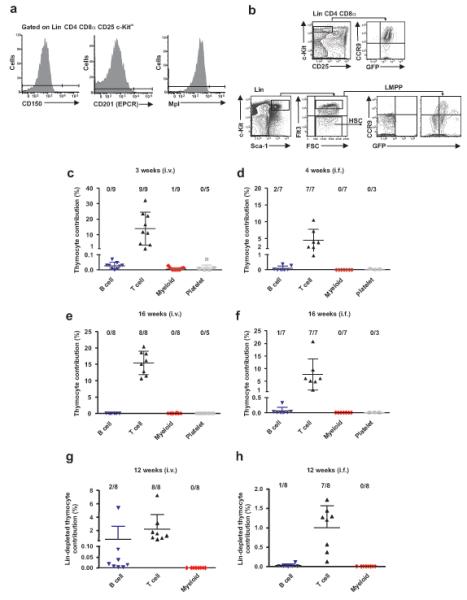
Absence of pluripotent HSCs in newborn thymus. (a) Flow cytometry profiles of CD150, CD201 and Mpl stem cell marker expression in Lin−CD4−CD8α−CD25−c-Kithi ETPs in newborn mice (n_=2 exp). (b) Flow cytometry profiles of CCR9 and Rag1 GFP co-expression in ETPs, LMPPs and HSCs (n_=2 exp). (c-h) Peripheral blood analyses showing mean (±s.d.) thymocyte contribution to T, B, myeloid and platelet (Vwf eGFP+) lineages at 3-4 weeks (c; _n_=9**, d**; _n_=7), 16 weeks (e; _n_=8**, f**; _n_=7) and 12 weeks (g; _n_=8**,h**; _n_=8) after intravenous or intrafemoral competitive transplantation of total or CD4+ and CD8+ depleted neonatal thymocytes from Vwf eGFP or WT mice. The frequency of reconstituted animals is indicated above each lineage.
Whole thymocytes from neonatal mice transplanted intravenously or intrafemorally (to bypass potential changes in BM homing properties upon thymus entry) reconstituted T cells and low levels of B cells transiently (Fig. 3c,d), but failed to sustain any long-term multilineage reconstitution (Fig. 3e,f), in further support of the idea that the postnatal thymus does not harbor any HSCs. To enhance the detection of HSCs potentially present in the thymus, whole thymocytes were depleted of CD4+ and CD8+ cells and transplanted intravenously or intrafemorally (Fig. 3g,h). The absence of long-term myeloid reconstitution in all major hematopoietic organs as well as the lack of thymocyte-derived T cell progenitors in the thymus after 13 weeks in all but one transplanted mouse, further corroborated the absence of pluripotent HSCs in the thymus (Fig. 3g,h and Supplementary Fig. 8a-d). Collectively, these results demonstrate the absence of HSCs in the postnatal thymus, compatible with ETPs with combined T, B and GM lineage potential being the most multipotent progenitors in the thymus.
ETPs are closely molecularly related to BM TSPs
Because our findings indicate that Lin−CD4−CD8α−CD25−c-KithiFlt3hi ETPs in the neonatal thymus have the same lineage potentials as LSKFlt3hi LMPPs expressing Rag1 GFP (which also highly express interleukin 7 receptor α, IL-7Rα; Supplementary Fig. 9a) in the BM13,32, we next investigated the molecular relationship between ETPs and IL-7Rα+ LMPPs and HSCs in the BM. We also compared ETPs to the next stages of lineage restriction in the thymus, namely Lin−CD44+CD25+c-Kithi DN2 cells that sustain combined T and GM but no B lineage potential8,9, and Lin−CD44−CD25+ DN3 cells, which represent the first T cell restricted progenitors in the thymus33. Based on global gene expression analysis34, ETPs clustered much closer to LMPPs in the BM than to thymic DN2s and DN3s or BM HSCs. Moreover, LMPPs clustered closer to ETPs than they did to HSCs, and DN2s closer to DN3s than ETPs (Fig. 4a). Because CLPs have been suggested to be candidate TSPs7 and have recently been demonstrated to not only have lymphoid potential, but also sustain some myeloid potential similar to LMPPs35, we also compared the molecular profiles of ETPs with the two candidate TSP populations in the BM, LMPPs and Lin−CD19−B220−Sca-1lowc-KitlowFlt3+IL-7Rα+Ly-6D− CLPs36(Fig. 4b). The newborn ETPs clustered closely with CLPs as well as LMPPs and were more distant from HSCs, DN3 and also proB cells. Moreover newborn and adult ETPs clustered closely together along with LMPPs and CLPs (Fig. 4b). These findings establish a close molecular relationship between Lin−CD4−CD8α−CD25−c-KithiFlt3hi ETPs in the thymus and candidate TSPs with lympho-myeloid potential in the BM (Fig. 4a,b and Supplementary Fig. 9b,c).
Figure 4.
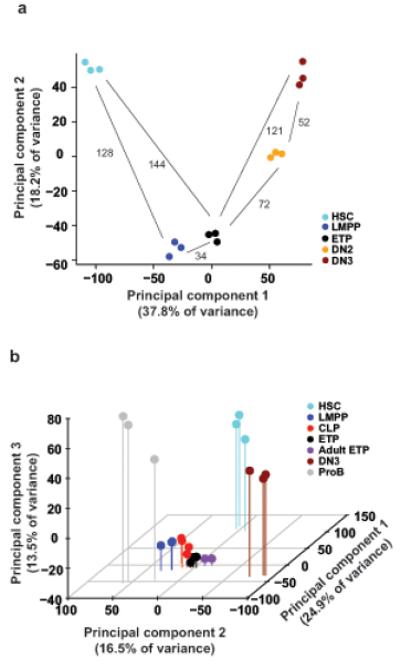
ETPs cluster closer to candidate TSPs in the BM than other thymic progenitors. (a,b) Two- and three-dimensional principal component analyses of normalized global gene expression profiles of (a) purified HSC, LMPP, ETP, DN2 and DN3 from neonatal mice (_n_=3) and (b) purified neonatal HSC (_n_=3), LMPP (_n_=3), CLP (_n_=4), ETP (_n_=3), DN3 (_n_=3), ProB (_n_=3) and adult ETP (_n_=2). Each symbol represents a separate biological sample (sorted from different pools of mice). Euclidean distances between average x and y values for each population measured in the first two principal components are shown in panel (a).
To more specifically look at T cell and GM lineage affiliated gene expression, T and GM gene lists were derived from the literature and from previously published data sets37,38 (Supplementary Methods). When T and GM lineage affiliated programs were compared, adult and neonatal ETPs clustered closely for both, and closer to LMPPs and CLPs than to DN2 and DN3 in the thymus and HSCs in the BM (Fig. 5a,b and Supplementary Fig. 9d,e). Of particular interest, many T cell affiliated genes that eventually become dramatically upregulated in DN2s and further upon T cell commitment in DN3s, have already been upregulated in LMPPs (as compared to HSCs) and CLPs, with less change from LMPPs and CLPs to ETPs (Fig. 5a). Using quantitative RT-PCR, some of the myeloid, lymphoid, T cell and Notch related genes were investigated in greater detail (Fig. 6). In addition to confirming the combined expression of GM (Mpo, Csf1r, Csf2rb,) and lymphoid (sterile IgH, Il7r, Rag1) lineage affiliated genes, these data also showed that characteristic early T cell specific genes (Ptcra, Cd3e, Cd3g) were not significantly upregulated in neither multipotent LMPPs nor ETPs. In contrast, Notch1 was upregulated in LMPPs and further in ETPs, and in agreement with this, the Notch target genes Il2ra (Cd25), Gata3 and in particular Hes139 were upregulated in the transition from LMPPs to ETPs. Finally, whereas HSCs lack expression of Ccr7 and Ccr930,31, encoding critical chemokine receptors for migration to the thymus, these genes were drastically upregulated in LMPPs, in further support of the idea that LMPPs are TSPs. Collectively, these results demonstrate that ETPs and candidate TSPs such as LMPPs and CLPs, have closely related gene expression profiles, reinforcing that ETPs more likely are derived from lympho-myeloid restricted progenitors than HSCs in the BM.
Figure 5.

ETPs, LMPPs and CLPs have closely related T and myeloid lineage transcriptional profiles. (a,b) Heatmap representation of T (a) and GM (b) lineage-affiliated gene expression represented as normalized median expression values from purified neonatal HSC (_n_=6), LMPP (_n_=6), CLP (_n_=4), ETP (_n_=6), DN2 (_n_=3), DN3 (_n_=6) and adult ETP (_n_=2) populations. Gene lists were established as described in the Online Methods section and Supplementary Methods).
Figure 6.
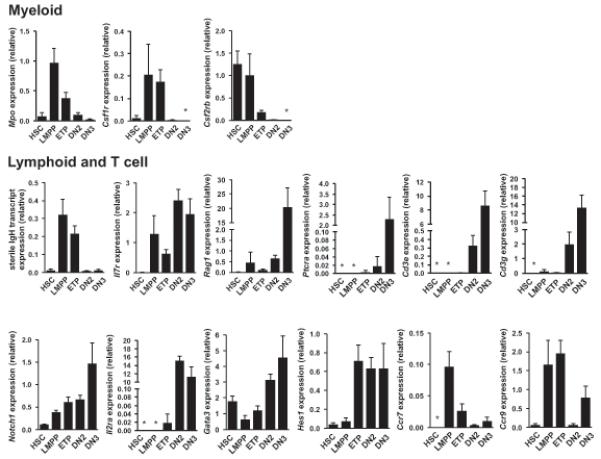
Quantitative expression analysis of lymphoid and myeloid genes in neonatal ETPs. Quantitative gene expression analysis showing lymphoid and myeloid genes in purified neonatal HSC (_n_=6), LMPP (_n_=4), ETP (_n_=6), DN2 (_n_=6) and DN3 (_n_=6) populations (25 cells/replicate). Average expression levels (± s.d.). (*) ≤0.001, below detection.
DISCUSSION
Here we identify ETPs in the neonatal thymus with combined T, B and GM, but no MkE lineage potential, and we demonstrate a close functional and molecular linkage between ETPs and candidate TSPs in the BM.
The observation that ETPs lack MkE potential is of key importance towards reconciling the ongoing debate regarding the roadmap for hematopoietic lineage commitment, as the classical model for hematopoietic lineage commitment predicts that the first lineage commitment step of HSCs results in a strict separation of myelo-erythroid and lymphoid commitment pathways1,14. According to this model, any cell with combined lymphoid and GM potential should also possess MkE potential. However, the current study demonstrates that Lin−CD4−CD8α−CD25−c-KithiFlt3hi ETPs with combined T, B and GM lineage potential were devoid of Mk and E lineage potentials. These cells co-express, at the single cell level, lymphoid and GM, but not MkE related genes, similar to LMPPs with identical lineage potentials in the BM13,34. Thus, this study provides support for a myeloid-based lineage commitment model2,13,15,16,17, by demonstrating the existence of T-B-GM restricted progenitors in the postnatal thymus. Such cells have been previously identified in the BM and the fetal liver13,34.
It is very likely that the real frequency of neonatal Lin−CD4−CD8α−CD25−c-KithiFlt3hi ETPs with T-B-GM potential is higher than what we were able to demonstrate. Analysis of clones grown from single newborn ETPs demonstrated that most ETPs with T cell potential simultaneously possessed B cell potential, but less than 20% of these also revealed GM potential in WT mice, although under optimized GM conditions more than 50% of ETPs demonstrated GM potential. We speculated that the reduced GM readout in the multilineage clonal assay reflected the short life-span of vulnerable myeloid cells, and in agreement with this MCL-1 enhanced the detection of neonatal ETPs with combined T, B and GM potential, most likely through increased survival of myeloid cells.
Our findings also suggest that the identified T-B-GM restricted progenitor is the most multipotent progenitor in the neonatal thymus, as we failed to detect any MkE lineage potential or MkE-specific gene expression within highly purified ETPs. Furthermore, we also demonstrate that there are no phenotypic or in vivo reconstituting HSCs or multipotent progenitors in the neonatal thymus.
Previous studies have suggested that the earliest fetal thymic progenitors in the embryo have combined T cell and myeloid, but no B cell lineage potential10,11, raising the possibility that the progenitors seeding the embryonic thymus might be distinct and more committed than in the postnatal thymus. In contrast with the neonatal thymus which we concentrated on in this study, it remains unclear if the adult thymus is also seeded with ETPs with combined T, GM and B lineage potentials. As thymopoiesis is much decreased in the adult compared to the newborn thymus, it can be predicted that the most multipotent ETPs are much more infrequent in adult than in the neonatal thymus. While the low frequency of B lineage potential of adult ETPs6,20 does not allow a clear test of the combined lineage potential of these cells using the current clonal lineage potential assay, it is notable that rare Lin−CD4−CD8α−CD25−c-KithiFlt3hi ETPs were the only adult thymocytes with B cell potential6,20. In addition, the current study showed that adult ETPs, like neonatal ETPs, have GM, but not Mk potential, while global gene expression analysis pinpointed a very close molecular relationship between neonatal and adult ETPs. Collectively these datasets suggest that adult thymuses, as the neonatal thymuses, might also seeded by rare T-B-GM progenitors, which we could unequivocally identify in the neonatal thymus. Nevertheless, there are distinct differences between fetal, neonatal and adult hematopoietic stem and progenitor cells. The regulated migration of TSPs to the thymus might also differ in the newborn and the adult, so it remains possible that the lineage potentials of newborn and adult TSPs might be different.
While these studies establish the extent of ETP multipotentiality (T-B-GM) and the close phenotypic and molecular relationship between ETPs and LMPPs and CLPs with the same lineage potentials in the BM13,32,34,35, they do not exclude the possibility that other candidate progenitors in the BM might seed the thymus40. A recent study suggested that T-GM-restricted progenitors might exist in the BM41, although such progenitors remain to be purified and characterized in further detail. The GM potential of ETPs is limited, and recent studies have suggested that it has little if any functional significance with regard to these progenitors acting as myeloid progenitors in the thymus35,42. Likewise, it seems unlikely that ETPs have any important physiological role as B cell progenitors. Rather, the significance of these sustained lineage potentials of ETPs is to provide a better understanding of the required lineage restriction steps for lineage commitment from pluripotent HSCs in the BM to a T cell restricted progenitor in the thymus. Specifically, progenitors with combined T-B-GM potential, such as LMPPs and CLPs, are derived in the BM from HSCs that have shut down the MkE transcriptional programs and lineage potentials. Unlike HSCs, LMPPs and CLPs upregulate CCR930,31, which enables their transfer to the thymus30,31. Migration to the thymus appears critical for the next T-lineage restriction steps, first to a T-GM8,9 and finally to a fully T cell restricted progenitor. In addition to providing novel insights into the normal stepwise process of T lineage commitment in the BM and thymus, the present studies are also of considerable relevance for a recently identified clinically, phenotypically and molecularly distinct group of mixed T-GM acute lymphoblastic leukemias (ALLs) which are predominantly observed in children but also seen in adults, and termed ETP leukemias43. Furthermore, the sustained B cell potential of ETPs might explain why the MLL-AF4 fusion oncogene, highly specific for human B cell malignancies, can give rise to B cell malignancies even if targeted to thymic progenitors44
Supplementary Material
1
ACKNOWLEDGEMENTS
We thank the Biomedical Services at Oxford University for expert animal support, S.Clark, T. Furey and B. Wu for technical assistance and E. Zuo and M. Eckart at the Stanford Protein and Nucleic Acid Facility for gene array services. This work was supported by grants from: EU-FP7 STEMEXPAND and a programme grant (H4RPLK0) from the Medical Research Council, UK to SEWJ, as well as the EU-FP7 EuroSyStem Integrated projects to SEWJ, CB and AF. CB and AF were supported by the Leukaemia and Lymphoma Research and AJM holds a Leukaemia and Lymphoma Research Senior Bennett Fellowship. AH is supported by the Crafoord Foundation, The George Danielsson foundation, Swedish Society for Medicine and Swedish Cancer foundation.
Appendix
METHODS
Animals
All animals used were bred and maintained at the Oxford Biomedical Services and all experiments were performed with the approval of the UK Home Office. Rag1 GFP29 mice were provided by Dr N. Sakaguchi, Lysozyme M eGFP45 mice by Dr T. Graf, vavP-mcl-1 trangenic mice25 by Dr S. Cory, Mb-1 Cre (Cd79atm1(cre)Reth)23 mice by Dr M. Reth, which were crossed with _R26R-_eYFP24 mice from Dr S. Srinivas. Vwf eGFP BAC transgenic mice in which all platelets express eGFP were generated by BAC recombineering in bacteria. The eGFP followed by a polyadenylation signal was inserted at the initiation codon within exon 1 of the Vwf gene and thereby replacing exon 2. Vwf eGFP transgenic mice were generated by intracytoplasmic sperm injection (ICSI) (Nerlov and Jacobsen, manuscript in preparation). Mice were backcrossed multiple generations onto a C57BL/6 background.
Transplantation
Newborn/neonatal thymocytes (total thymocytes or CD4- and CD8 lineage depleted, from one donor to each recipient) or sorted Flt3+ ETPs from wild type or Vwf eGFP mice were transplanted with 300,000 unfractionated support BM cells into lethally irradiated (2x450cGy) C57BL6 (CD45.1 or CD45.2) or _Rag1_−/− mice (>8 weeks), either intravenously or intrafemorally. Peripheral blood, spleen, thymus and BM analyses were conducted between 3 and 16-17 weeks post-transplantation. For all lineages, mice showing total donor contribution >0.1% and >0.02% thymocyte-derived lineage chimerism of total cells as well as clear positive events by FACS (>20 events) were considered reconstituted.
Stem- and progenitor cell purification
All cell sorting experiments were performed on a BD FACSAriaIIu cell sorter (BD Biosciences) with a total mean cell sorting purity of 99% ± 2% for Flt3hiETPs, based on reanalysis for all gating steps and therefore all antigens defining Flt3hiETPs (Lin−CD4−CD8α−CD25+c-KithiFlt3hi) (Supplementary Fig. 3). Single cells were seeded by an automated cell deposition unit (ACDU) providing single cells in >99% of the wells, and no wells with more than 1 cell. FACS analyses were performed on a BD LSRII (BD Biosciences). See Supplementary Table 1 for instrument configurations. Subsequent data analyses were performed with the FlowJo analysis software (TreeStar Inc). Cells used in cell sorting experiments were either unenriched or enriched for CD117 with MACS cell separation (Miltenyi Biotec) followed by Fc-block incubation and staining with anti-mouse antibodies (see Supplementary Table 2 for antibody information). Fluorescence-minus-one controls as well as negative populations were used as gate-setting controls.
Microarray analysis
Global gene expression analysis was performed on HSCs (Lin−Sca-1+c-Kit+Flt3−CD48−CD150+), IL-7Rα+LMPPs (Lin−Sca-1+c-Kit+Flt3hiIL-7Rα+), adult and neonatal ETPs (Lin−CD4−CD8α−CD25−c-KithiFlt3+/hi), DN2 (Lin−CD44+CD25+c-Kit+), DN3 (Lin−CD44−CD25+), CLPs (Lin−CD19−B220−Sca-1lowc-KitlowFlt3+IL-7Rα+Ly-6D− and Pro B cells, CD19+B220+CD43+c-Kit+, from one week old mice. For all, except two populations,, three individually sorted samples from different pools of mice were prepared. In the remaining two populations, two and four biological replicates were analyzed. Cells (1,600-2,000) were sorted directly into Trizol (Invitrogen) and the RNA extraction carried out as per manufacturer’s instructions. Using the same total amount of input RNA, samples were amplified using the NuGEN kit WT-Ovation Pico RNA Amplifications System followed by the WT Ovation cDNA Biotin Module V2 for cDNA labeling (NuGEN) and fragmentation and finally hybridised to Affymetrix Mouse Genome 430 2.0 Arrays using standard protocols (Affymetrix) at the Stanford Protein and Nucleic Acid facility. Data were normalised using the Robust Multi-array Averages (RMA) method in the affy Bioconductor/R package. Subsequent data analysis (PCA, cluster analysis) was also carried out in R (see Supplementary Methods).
Single cell and quantitative PCR
Multiplex single-cell RT-PCR was performed as previously described34 (see Supplementary Table 3) on single cells sorted from newborn ETPs. Multiplex quantitative real time PCR analysis was performed using BioMark 48.48 Dynamic Array platform (Fluidigm) and TaqMan Gene Expression Assays (Applied Biosystems) as previously described46 on sorted populations. For each cell population, two biological replicates (25 cells/replicate) i.e. individually sorted samples from different mice, or single cells (20 cells/experiment) were prepared. See Supplementary Information and Supplementary Table 4 for TaqMan assays used.
In vitro cultures
GM and Mk lineage potentials were analyzed as previously described32 (see Supplementary Table 5). Mk potential was additionally evaluated using the Megacult collagen-based assay (StemCell Technologies). 200 ETPs or 100,000 unfractionated control BM cells were plated in Megacult-collagen media supplemented with growth factors (see Supplementary Table 5). Mk colonies were evaluated after 7 days with Acetylthiocholiniodide (Sigma) staining according to manufacturer’s instructions.
For evaluation of erythroid potential 500-1,000 ETPs and 50 LSKFlt3− control cells were seeded in complete methylcellulose (GF M3434; StemCell Technologies). Cultures were evaluated after 8-11 days using 2,7-diaminofluorene staining (DAF; Sigma) as previously described34.
OP9 and OP9-DL1 stromal cells were kindly provided by Dr A. Cumano. To evaluate the individual GM, B, T and NK cell lineage potentials single ETPs were FACS sorted onto monolayers of OP9 or OP9-DL1 stromal cells as previously described (see Supplementary Table 5). Myeloid lineages formed on OP9 stroma co-cultures were evaluated after 6 days by morphology analysis of May-Grünwald (Sigma) and Giemsa (Fluka) stained slides.
To analyze combined lineage potentials, single cell deposition was performed (ensured as specified above), onto OP9 cells supplemented with hFLT3L, mScf and hIL-7. Approximately 54 hours later, the co-culture was split to a secondary layer of OP9 with the same condition to promote B cells and a layer of OP9-DL1 with cytokines (hFLT3L, mSCF, hIL-7, hIL-6, mIL-3, hG-CSF, mGM-CSF, hCSF-1) to promote T and myeloid cell differentiation. The timing of the first culture period was optimized to give the highest frequency possible for all lineages in the combined lineage potential assay. One week after transfer to the second culture, clones were evaluated for the presence of CD19+ B cells, CD4+CD8α+NK1.1− and/or Thy1.2+CD25+NK1.1− T cells and Mac-1+F4/80+ myeloid cells. Clones expressing Mac-1 and/or F4/80 were additionally evaluated by morphology. The timing of the readout was optimized to the earliest time-point where T cells could be detected, and at which time myeloid progeny would still be possible to detect. However, as the differentiation time is longer for lymphoid cells, the production of myeloid progeny is most likely underestimated.
All frequencies of single cell assays are expressed as total frequencies, that is relative to the total number of cells plated unless otherwise stated.
Footnotes
Accession codes. All microarray data are deposited at GEO database with project number GSE29382.
Note: Supplementary information is available on the Nature Immunology website.
The authors declare no competing financial interests.
REFERENCES
- 1.Reya T, Morrison SJ, Clarke MF, Weissman IL. Stem cells, cancer, and cancer stem cells. Nature. 2001;414:105–111. doi: 10.1038/35102167. [DOI] [PubMed] [Google Scholar]
- 2.Katsura Y. Redefinition of lymphoid progenitors. Nat Rev Immunol. 2002;2:127–132. doi: 10.1038/nri721. [DOI] [PubMed] [Google Scholar]
- 3.Donskoy E, Goldschneider I. Thymocytopoiesis is maintained by blood-borne precursors throughout postnatal life. A study in parabiotic mice. J Immunol. 1992;148:1604–1612. [PubMed] [Google Scholar]
- 4.Scollay R, Smith J, Stauffer V. Dynamics of early T cells: prothymocyte migration and proliferation in the adult mouse thymus. Immunol Rev. 1986;91:129–157. doi: 10.1111/j.1600-065x.1986.tb01487.x. [DOI] [PubMed] [Google Scholar]
- 5.Allman D, et al. Thymopoiesis independent of common lymphoid progenitors. Nat Immunol. 2003;4:168–174. doi: 10.1038/ni878. [DOI] [PubMed] [Google Scholar]
- 6.Benz C, Bleul CC. A multipotent precursor in the thymus maps to the branching point of the T versus B lineage decision. J Exp Med. 2005;202:21–31. doi: 10.1084/jem.20050146. [DOI] [PMC free article] [PubMed] [Google Scholar]
- 7.Bhandoola A, von Boehmer H, Petrie HT, Zuniga-Pflucker JC. Commitment and developmental potential of extrathymic and intrathymic T cell precursors: plenty to choose from. Immunity. 2007;26:678–689. doi: 10.1016/j.immuni.2007.05.009. [DOI] [PubMed] [Google Scholar]
- 8.Wada H, et al. Adult T-cell progenitors retain myeloid potential. Nature. 2008;452:768–772. doi: 10.1038/nature06839. [DOI] [PubMed] [Google Scholar]
- 9.Bell JJ, Bhandoola A. The earliest thymic progenitors for T cells possess myeloid lineage potential. Nature. 2008;452:764–767. doi: 10.1038/nature06840. [DOI] [PubMed] [Google Scholar]
- 10.Desanti GE, et al. Clonal analysis reveals uniformity in the molecular profile and lineage potential of CCR9(+) and CCR9(-) thymus-settling progenitors. Journal of immunology. 2011;186:5227–5235. doi: 10.4049/jimmunol.1002686. doi:10.4049/jimmunol.1002686. [DOI] [PMC free article] [PubMed] [Google Scholar]
- 11.Masuda K, et al. Thymic anlage is colonized by progenitors restricted to T, NK, and dendritic cell lineages. J Immunol. 2005;174:2525–2532. doi: 10.4049/jimmunol.174.5.2525. [DOI] [PubMed] [Google Scholar]
- 12.Kondo M, Weissman IL, Akashi K. Identification of clonogenic common lymphoid progenitors in mouse bone marrow. Cell. 1997;91:661–672. doi: 10.1016/s0092-8674(00)80453-5. [DOI] [PubMed] [Google Scholar]
- 13.Adolfsson J, et al. Identification of Flt3+ lympho-myeloid stem cells lacking erythro megakaryocytic potential a revised road map for adult blood lineage commitment. Cell. 2005;121:295–306. doi: 10.1016/j.cell.2005.02.013. [DOI] [PubMed] [Google Scholar]
- 14.Orkin SH, Zon LI. Hematopoiesis: an evolving paradigm for stem cell biology. Cell. 2008;132:631–644. doi: 10.1016/j.cell.2008.01.025. [DOI] [PMC free article] [PubMed] [Google Scholar]
- 15.Luc S, Buza-Vidas N, Jacobsen SE. Delineating the cellular pathways of hematopoietic lineage commitment. Semin Immunol. 2008;20:213–220. doi: 10.1016/j.smim.2008.07.005. [DOI] [PubMed] [Google Scholar]
- 16.Doulatov S, et al. Revised map of the human progenitor hierarchy shows the origin of macrophages and dendritic cells in early lymphoid development. Nat Immunol. 2010;11:585–593. doi: 10.1038/ni.1889. [DOI] [PubMed] [Google Scholar]
- 17.Goardon N, et al. Coexistence of LMPP-like and GMP-like leukemia stem cells in acute myeloid leukemia. Cancer Cell. 2011;19:138–152. doi: 10.1016/j.ccr.2010.12.012. doi:10.1016/j.ccr.2010.12.012. [DOI] [PubMed] [Google Scholar]
- 18.Taub DD, Longo DL. Insights into thymic aging and regeneration. Immunol Rev. 2005;205:72–93. doi: 10.1111/j.0105-2896.2005.00275.x. [DOI] [PubMed] [Google Scholar]
- 19.Ceredig R, Bosco N, Rolink AG. The B lineage potential of thymus settling progenitors is critically dependent on mouse age. Eur J Immunol. 2007;37:830–837. doi: 10.1002/eji.200636728. [DOI] [PubMed] [Google Scholar]
- 20.Sambandam A, et al. Notch signaling controls the generation and differentiation of early T lineage progenitors. Nat Immunol. 2005;6:663–670. doi: 10.1038/ni1216. [DOI] [PubMed] [Google Scholar]
- 21.Radtke F, et al. Deficient T cell fate specification in mice with an induced inactivation of Notch1. Immunity. 1999;10:547–558. doi: 10.1016/s1074-7613(00)80054-0. [DOI] [PubMed] [Google Scholar]
- 22.Feyerabend TB, et al. Deletion of Notch1 converts pro-T cells to dendritic cells and promotes thymic B cells by cell-extrinsic and cell-intrinsic mechanisms. Immunity. 2009;30:67–79. doi: 10.1016/j.immuni.2008.10.016. [DOI] [PubMed] [Google Scholar]
- 23.Hobeika E, et al. Testing gene function early in the B cell lineage in mb1-cre mice. Proc Natl Acad Sci U S A. 2006;103:13789–13794. doi: 10.1073/pnas.0605944103. [DOI] [PMC free article] [PubMed] [Google Scholar]
- 24.Srinivas S, et al. Cre reporter strains produced by targeted insertion of EYFP and ECFP into the ROSA26 locus. BMC Dev Biol. 2001;1:4. doi: 10.1186/1471-213X-1-4. [DOI] [PMC free article] [PubMed] [Google Scholar]
- 25.Campbell KJ, et al. Elevated Mcl-1 perturbs lymphopoiesis, promotes transformation of hematopoietic stem/progenitor cells, and enhances drug resistance. Blood. 2010;116:3197–3207. doi: 10.1182/blood-2010-04-281071. [DOI] [PMC free article] [PubMed] [Google Scholar]
- 26.Kiel MJ, et al. SLAM family receptors distinguish hematopoietic stem and progenitor cells and reveal endothelial niches for stem cells. Cell. 2005;121:1109–1121. doi: 10.1016/j.cell.2005.05.026. [DOI] [PubMed] [Google Scholar]
- 27.Balazs AB, Fabian AJ, Esmon CT, Mulligan RC. Endothelial protein C receptor (CD201) explicitly identifies hematopoietic stem cells in murine bone marrow. Blood. 2006;107:2317–2321. doi: 10.1182/blood-2005-06-2249. [DOI] [PMC free article] [PubMed] [Google Scholar]
- 28.Solar GP, et al. Role of c-mpl in early hematopoiesis. Blood. 1998;92:4–10. [PubMed] [Google Scholar]
- 29.Igarashi H, Gregory SC, Yokota T, Sakaguchi N, Kincade PW. Transcription from the RAG1 locus marks the earliest lymphocyte progenitors in bone marrow. Immunity. 2002;17:117–130. doi: 10.1016/s1074-7613(02)00366-7. [DOI] [PubMed] [Google Scholar]
- 30.Zlotoff DA, et al. CCR7 and CCR9 together recruit hematopoietic progenitors to the adult thymus. Blood. 2010;115:1897–1905. doi: 10.1182/blood-2009-08-237784. [DOI] [PMC free article] [PubMed] [Google Scholar]
- 31.Krueger A, Willenzon S, Lyszkiewicz M, Kremmer E, Forster R. CC chemokine receptor (CCR) 7 and 9 double-deficient hematopoietic progenitors are severely impaired in seeding the adult thymus. Blood. 2010 doi: 10.1182/blood-2009-07-235721. [DOI] [PubMed] [Google Scholar]
- 32.Luc S, et al. Downregulation of Mpl marks the transition to lymphoid-primed multipotent progenitors with gradual loss of granulocyte-monocyte potential. Blood. 2008 doi: 10.1182/blood-2007-08-108324. [DOI] [PubMed] [Google Scholar]
- 33.Godfrey DI, Kennedy J, Suda T, Zlotnik A. A developmental pathway involving four phenotypically and functionally distinct subsets of CD3-CD4-CD8-triple-negative adult mouse thymocytes defined by CD44 and CD25 expression. J Immunol. 1993;150:4244–4252. [PubMed] [Google Scholar]
- 34.Mansson R, et al. Molecular evidence for hierarchical transcriptional lineage priming in fetal and adult stem cells and multipotent progenitors. Immunity. 2007;26:407–419. doi: 10.1016/j.immuni.2007.02.013. [DOI] [PubMed] [Google Scholar]
- 35.Ehrlich LI, Serwold T, Weissman IL. In vitro assays misrepresent in vivo lineage potentials of murine lymphoid progenitors. Blood. 2011;117:2618–2624. doi: 10.1182/blood-2010-05-287102. [DOI] [PMC free article] [PubMed] [Google Scholar]
- 36.Inlay MA, et al. Ly6d marks the earliest stage of B-cell specification and identifies the branchpoint between B-cell and T-cell development. Genes Dev. 2009;23:2376–2381. doi: 10.1101/gad.1836009. [DOI] [PMC free article] [PubMed] [Google Scholar]
- 37.Pronk CJH, et al. Elucidation of the Phenotypic, Functional, and Molecular Topography of a Myeloerythroid Progenitor Cell Hierarchy. Cell Stem Cell. 2007;1:428–442. doi: 10.1016/j.stem.2007.07.005. [DOI] [PubMed] [Google Scholar]
- 38.David-Fung ES, et al. Transcription factor expression dynamics of early T-lymphocyte specification and commitment. Dev Biol. 2009;325:444–467. doi: 10.1016/j.ydbio.2008.10.021. [DOI] [PMC free article] [PubMed] [Google Scholar]
- 39.Wendorff AA, et al. Hes1 is a critical but context-dependent mediator of canonical Notch signaling in lymphocyte development and transformation. Immunity. 2010;33:671–684. doi: 10.1016/j.immuni.2010.11.014. [DOI] [PubMed] [Google Scholar]
- 40.Petrie HT, Kincade PW. Many roads, one destination for T cell progenitors. J Exp Med. 2005;202:11–13. doi: 10.1084/jem.20050990. [DOI] [PMC free article] [PubMed] [Google Scholar]
- 41.Chi AW, et al. Identification of Flt3CD150 myeloid progenitors in adult mouse bone marrow that harbor T lymphoid developmental potential. Blood. 2011;118:2723–2732. doi: 10.1182/blood-2010-09-309989. doi:10.1182/blood-2010-09-309989. [DOI] [PMC free article] [PubMed] [Google Scholar]
- 42.Schlenner SM, et al. Fate Mapping Reveals Separate Origins of T Cells and Myeloid Lineages in the Thymus. Immunity. 2010;32:426–436. doi: 10.1016/j.immuni.2010.03.005. [DOI] [PubMed] [Google Scholar]
- 43.Coustan-Smith E, et al. Early T-cell precursor leukaemia: a subtype of very high-risk acute lymphoblastic leukaemia. Lancet Oncol. 2009;10:147–156. doi: 10.1016/S1470-2045(08)70314-0. [DOI] [PMC free article] [PubMed] [Google Scholar]
- 44.Metzler M, et al. A conditional model of MLL-AF4 B-cell tumourigenesis using invertor technology. Oncogene. 2006;25:3093–3103. doi: 10.1038/sj.onc.1209636. doi:10.1038/sj.onc.1209636. [DOI] [PubMed] [Google Scholar]
- 45.Faust N, Varas F, Kelly LM, Heck S, Graf T. Insertion of enhanced green fluorescent protein into the lysozyme gene creates mice with green fluorescent granulocytes and macrophages. Blood. 2000;96:719–726. [PubMed] [Google Scholar]
- 46.Tehranchi R, et al. Persistent malignant stem cells in del(5q) myelodysplasia in remission. N Engl J Med. 2010;363:1025–1037. doi: 10.1056/NEJMoa0912228. [DOI] [PubMed] [Google Scholar]
Associated Data
This section collects any data citations, data availability statements, or supplementary materials included in this article.
Supplementary Materials
1