GENIES: gene network inference engine based on supervised analysis (original) (raw)
Abstract
Gene network inference engine based on supervised analysis (GENIES) is a web server to predict unknown part of gene network from various types of genome-wide data in the framework of supervised network inference. The originality of GENIES lies in the construction of a predictive model using partially known network information and in the integration of heterogeneous data with kernel methods. The GENIES server accepts any ‘profiles’ of genes or proteins (e.g. gene expression profiles, protein subcellular localization profiles and phylogenetic profiles) or pre-calculated gene–gene similarity matrices (or ‘kernels’) in the tab-delimited file format. As a training data set to learn a predictive model, the users can choose either known molecular network information in the KEGG PATHWAY database or their own gene network data. The user can also select an algorithm of supervised network inference, choose various parameters in the method, and control the weights of heterogeneous data integration. The server provides the list of newly predicted gene pairs, maps the predicted gene pairs onto the associated pathway diagrams in KEGG PATHWAY and indicates candidate genes for missing enzymes in organism-specific metabolic pathways. GENIES (http://www.genome.jp/tools/genies/) is publicly available as one of the genome analysis tools in GenomeNet.
INTRODUCTION
Most biological functions involve the interactions between genes and proteins, and the complexity of biological systems arises as a result of such interactions. A challenge in recent genome science is to computationally predict the systemic functional behaviours of genes and proteins from genomic and molecular information for industrial and other practical applications. Recent developments of biotechnologies, such as transcriptomics and proteomics technologies, contribute to an increasing amount of high-throughput data for genes and proteins. Those heterogeneous data can be useful sources to infer the biological networks on a large scale, and the usefulness of their integration has been reported in various applications (1–4). In this context, prediction methods of biological networks, using all available data in genomics and other omics experiments for a given organism, should be made more easily accessible to biologists.
Many conventional prediction methods such as KAAS (5) include the steps dependent on sequence similarity and pre-defined pathway, therefore, these methods are not applicable when the involved genes do not have any sequence similarity with other functionally characterized genes, and these methods are not suitable to predict novel interactions that have not been found in any other organisms. In contrast, there are some previous studies that do not depend on sequence similarity, enabling to predict a gene network based on genomic and the other related information (e.g. gene expression and phylogenetic profiles). Examples of the algorithms include Bayesian network (6,7), Boolean network (8), graphical Gaussian modelling (9), graph overlapping (10) and mirror tree (11), and these algorithms are categorized as unsupervised approaches. There exist web servers that implement some of the unsupervised methods, such as STRING (12) and ASIAN (13). Compared to the unsupervised approach, the supervised approach has been recently proposed to predict gene network. A key idea of the supervised approach is to use partially known network information in constructing a predictive model, and the usefulness has been shown in many recent studies. Examples of the algorithms include kernel CCA (14,15), pairwise SVM (16), em-algorithm (17), local SVM (18) and kernel matrix regression (19). However, to the best of our knowledge, no web servers have implemented the supervised network inference methods.
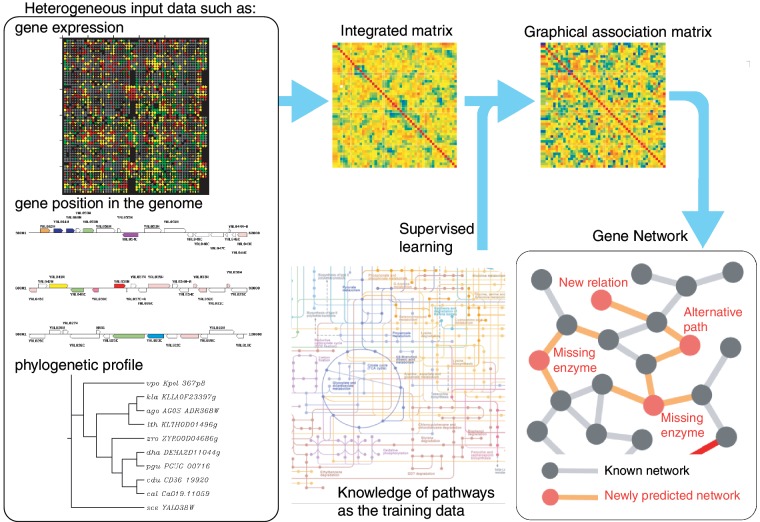
Here, we present gene network inference engine based on supervised analysis (GENIES: http://www.genome.jp/tools/genies/), a web server to predict unknown part of gene network from various types of genome-wide data (e.g. gene expression, gene position, subcellular localization and phylogenetic profiles) in the integrated framework of supervised network inference. Figure 1 shows an overview of the GENIES. The method is suitable for predicting unknown part of gene network, especially for predicting genes for missing enzymes in metabolic pathways.
Figure 1.
Overview of GENIES.
RATIONALE AND IMPLEMENTATION
Data integration
In GENIES, each data set about genes or proteins is transformed into the kernel similarity matrix (e.g. correlation coefficient matrix) using a kernel function, where each element in the matrix corresponds to a gene–gene similarity. Multiple kernel similarity matrices generated from heterogeneous data sets are integrated into a single one by taking a linear combination of the kernel similarity matrices (the sum of the matrices with same weights as default), which gives an integrated kernel similarity matrix representing gene–gene similarities.
Direct network inference
The most straightforward approach to network inference is a similarity-based approach, assuming that functionally related gene pairs are likely to share high similarity with respect to the given data set. Intuitively, the kernel similarity value can often be considered as a measure of association between two genes. Pairs of genes are regarded to interact (represented as edges) whenever the kernel similarity value between the genes is above a threshold, which is referred to as ‘direct approach’.
Supervised network inference
Supervised network inference involves two processes: a training process where a mapping of all genes to a low-dimensional space is learned by exploiting the partial knowledge of the network, and a test process where new edges are inferred. The test process is basically the same as the direct approach performed after genes are mapped to the low-dimensional Euclidean space, i.e. closely located gene pairs are connected. The inner product of the feature vectors between genes in the low-dimensional space is used as the prediction score. Pairs of genes are regarded to interact whenever the prediction score between the genes is above a threshold, which is referred to as ‘supervised approach’. There are several algorithms to find an appropriate mapping function in the training process, such as kernel CCA (14,15), pairwise SVM (16), em-algorithm (17), local SVM (18) and kernel matrix regression (19). Most of the algorithms are implemented in GENIES, but the SVM-based methods are not implemented because of the prohibitive computational cost and the huge memory consumption in the training phase. The kernel matrix regression is the default algorithm in GENIES because of its computational efficiency, but other algorithms (penalized kernel matrix regression, em-algorithm and kernel canonical correlation analysis) can be chosen by the users in practice.
USER INTERFACE AND BASIC FUNCTIONS
The possible inputs of GENIES are any data sets about genes or proteins that are represented as the text files either in the form of the tab-delimited profile matrix or kernel similarity matrix predefined by the user. For example, suppose that we are given three profile matrices: gene expression, subcellular localization and phylogenetic profiles. Gene expression profiles can be regarded as a real-valued profile matrix, where the rows represent genes and the columns represent experiment conditions or time series. Subcellular localization profiles can be regarded as a binary profile matrix, where the rows represent gene products and the columns represent subcellular compartments (e.g. Golgi, endoplasmic reticulum). The presence or absence of each gene product is coded as 1 or 0, respectively, across different subcellular compartments. Phylogenetic profiles can be regarded as a binary profile matrix, where the rows represent genes and the columns represent fully sequenced organisms. The presence or absence of each orthologous gene is coded as 1 or 0, respectively, across the different organisms. KEGG gene IDs are accepted for the input data so that the genes can be mapped onto the KEGG PATHWAY maps, and some input examples are provided in the help page (http://www.genome.jp/tools/genies/help.html (9 May 2012, date last accessed)).
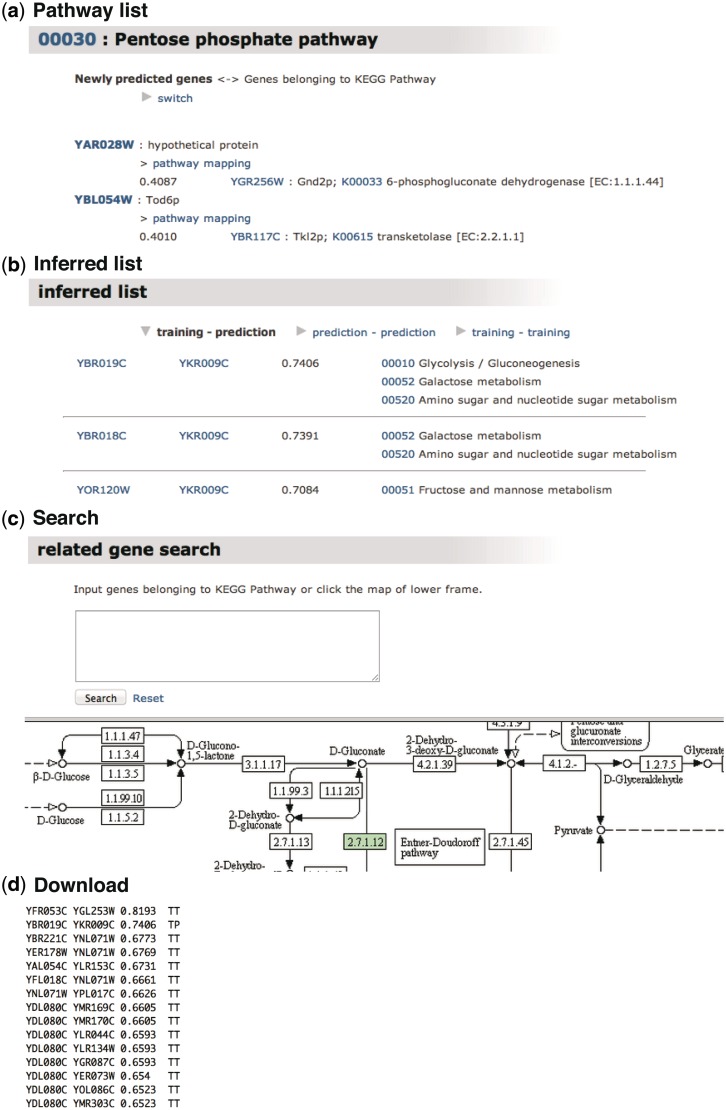
The output of GENIES is a weighted graph with genes as nodes and prediction scores as edges, provided in the following ways (Figure 2): Pathway list, Inferred list, Search and Download (An example can be seen at http://www.genome.jp/tools-bin/genies?mode=path&id=example (9 May 2012, date last accessed)). The first option, Pathway list, outputs the predicted interactions grouped into KEGG PATHWAY (20) maps. When one of the pathways is selected by the user, the genes that are predicted to interact with the other genes in the selected pathway will be highlighted. The second option, Inferred list, provides the predicted interaction pairs categorized into training versus prediction (TP), prediction versus prediction (PP) and training versus training (TT), where ‘training’ and ‘prediction’ mean the genes that are found and not found in KEGG PATHWAY, respectively. The third option, Search, enables the user to search for genes that are predicted to interact with the genes of interest. This option is useful for finding possible missing enzyme genes: the user can use the KEGG PATHWAY maps that contain the missing enzyme in the organism of interest. The last option, Details & Download, provides the list of the predicted gene pairs downloadable as a tab-delimited text file, which can be viewed using visualizing software like Cytoscape (http://www.cytoscape.org/ (9 May 2012, date last accessed)) (21).
Figure 2.
Output example of GENIES. (a) Pathway list shows the predicted gene–gene interactions grouped based on the KEGG PATHWAY maps. (b) Inferred list classifies the gene–gene network into training–prediction (TP), prediction–prediction (PP) and training–training (TT), where ‘training’ and ‘prediction’ mean the genes found and not found in the KEGG PATHWAY maps, respectively. (c) Search option enables the user to find the gene of interest by inputting the gene name or by using the KEGG PATHWAY maps. (d) Tab-delimited files can be downloaded.
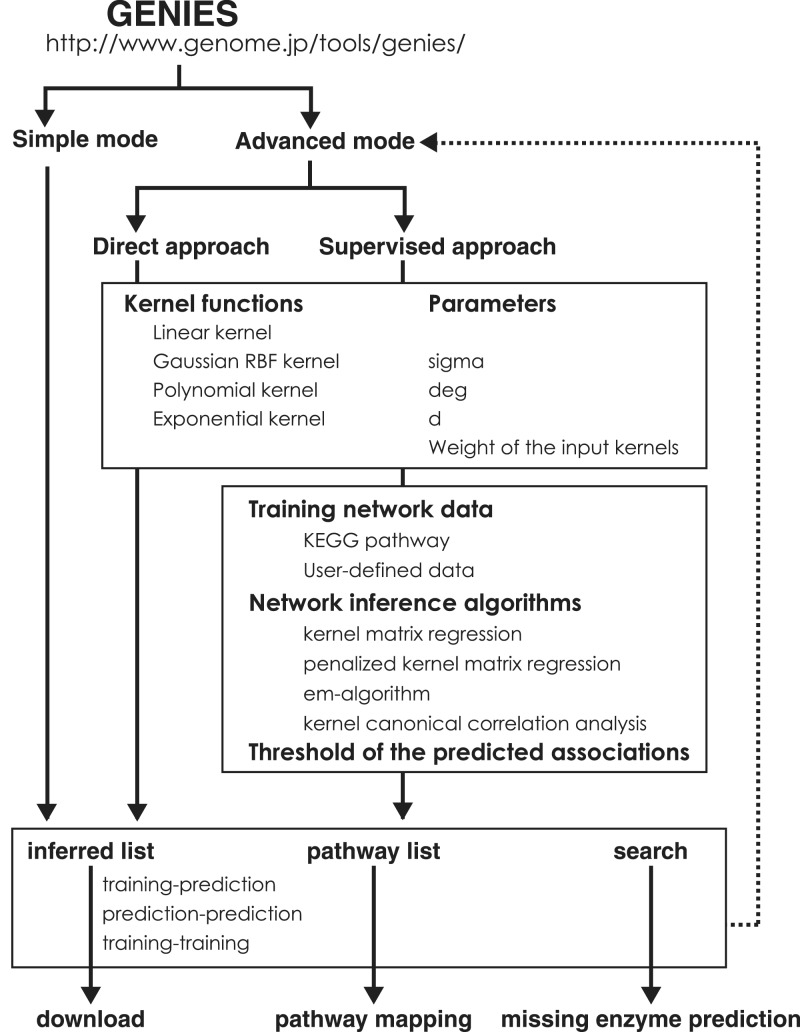
The workflow of GENIES is illustrated in Figure 3. Simple mode is provided for the users who want to try and see the results with the default settings. In the simple mode, profile matrices are converted into the kernel similarity matrices by linear kernel, all kernels are integrated with the same weight, and supervised learning by kernel matrix regression is performed using KEGG PATHWAY as the training network data. After obtaining the prediction result, the details of the default settings can be checked and can also be modified to perform the prediction again with different parameters (as indicated in the dotted arrow). In the Advanced mode, the users can choose the direct or the supervised approaches (although we recommend using the supervised approach for associating uncharacterized genes with known pathways). The Advanced mode provides the choices of the kernel functions, the choices of the network inference algorithms, the choices of training network data and some parameters in the algorithms. In the default settings, molecular network information in KEGG PATHWAY is used as the training network data, although the users can use their own network represented as the adjacency matrix of the genes.
Figure 3.
The workflow of GENIES.
PERFORMANCE EVALUATION
The validity of the supervised network inference algorithms has been already shown in many previous works (14–19). Here, we tested GENIES on its ability to predict missing enzyme genes in the metabolic pathways of budding yeast (Saccharomyces cerevisiae) from the integration of three genomic data sets, i.e. gene expression profiles, subcellular localization profiles and phylogenetic profiles, with the same weight. Enzyme genes with known pathway information are referred to as ‘pathway genes’ below. We used the 668 pathway genes taken from the KEGG database as the gold standard data and used the remaining 5332 genes in the budding yeast as candidate data.
We conducted a self-rank test by Jack-knife type (leave-one-out) cross-validation, following the previous work (22). The procedure of the self-rank test is as follows: (i) we take one pathway gene out of the 668 pathway genes on metabolic pathways and regard it as a missing enzyme, (ii) we compute the candidate score for 5332 candidate genes and the pathway gene being tested, (iii) we rank the pathway gene based on the candidate scores among 5332 candidate genes plus itself (5332 + 1) and (iv) we repeat the above steps for all the pathway genes. A self-rank of 1 is a perfect prediction, indicating that the method is able to assign the test pathway gene to the original position in the pathway. In the case of random prediction, the self-rank follows the uniform distribution on the interval from 1 to 5333.
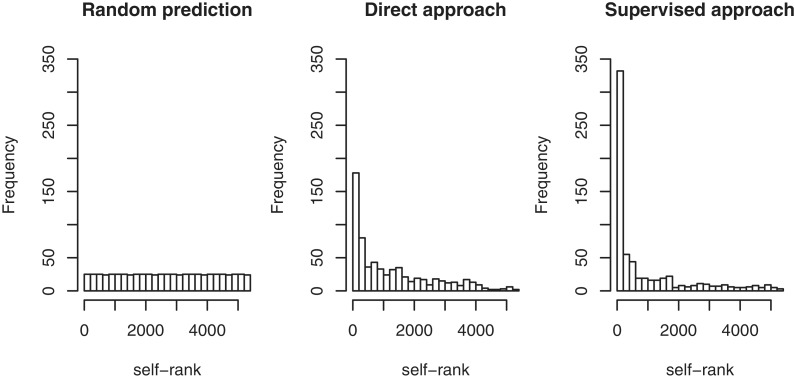
Figure 4 shows the distributions of the computed self-ranks for 668 pathway genes, where the left panel corresponds to the random prediction (see Supplementary Materials, http://web.kuicr.kyoto-u.ac.jp/supp/kot/nar2012/ (9 May 2012, date last accessed)), the middle panel corresponds to the direct approach and the right panel corresponds to the supervised approach. Kernel matrix regression was used as a default algorithm. In both, the direct approach and supervised approach, the self-rank distributions have a large peak at high ranks at a significant level (the _P_-value is almost zero), which means that GENIES is capable of predicting most known pathway genes correctly. The supervised approach usually outperforms the direct approach when pathway information for many genes is known. The direct approach is computationally efficient and it may perform better when little genes are associated with pathway information. Additional cross-validation experiments show the similar tendency (see Supplementary Materials, http://web.kuicr.kyoto-u.ac.jp/supp/kot/nar2012/ (9 May 2012, date last accessed)). These results suggest that potential missing enzyme genes tend to be strongly correlated with the adjacent enzymes on metabolic pathways in terms of successive reactions. The computational cost depends on the numbers of genes; it roughly takes 20 min to calculate the networks consisting of about 6000 genes. Downloadable software’s are available upon request.
Figure 4.
Self-rank test for predicting missing enzyme genes.
CONCLUSIONS AND FUTURE DIRECTION
GENIES enables the users to predict unknown part of gene network on a genome-wide scale and suggest potential associations between uncharacterized genes and known pathways in the framework of supervised network inference. The algorithms for supervised network inference have been presented in the previous publications (15), but this is the first paper for presenting the web server. One of the advantages of the server is the flexibility of the input data, which provides significant potential to analyse gene network in various aspects. As an example, we showed an application of using gene expression, subcellular localization and phylogenetic profiles, but the users can input any other kinds of data as long as they are represented in the form of profile matrices or similarity matrices. This web server aims at providing a network inference tool for general use; however, it would be valuable to re-design it for more specific use, such as predicting missing enzyme genes in metabolic pathways. For example, we showed the predictive power of our method for identifying missing enzymes that were not even classified in the Enzyme List (EC numbers) yet (23). We have been also developing other web servers that are specialized for predicting reaction pathways of given metabolites (24) and for predicting potential EC numbers for given substrate–product pairs (25,26), both of which are solely based on chemical structures. Integration with these chemistry-based methods would enhance GENIES to provide more powerful and specialized method for reconstructing large-scale metabolic networks dealing with gene–metabolite associations.
SUPPLEMENTARY DATA
Supplementary Data are available at NAR Online: Supplementary Materials.
FUNDING
Japan Science and Technology Agency (partial). Funding for open access charge: Japan Science and Technology Agency.
Conflict of interest statement. None declared.
ACKNOWLEDGEMENTS
Computational resources were provided by the Bioinformatics Center, Institute for Chemical Research and the Super Computer Laboratory, Kyoto University.
REFERENCES
- 1.Hu P, Janga SC, Babu M, Díaz-Mejía JJ, Butland G, Yang W, Pogoutse O, Guo X, Phanse S, Wong P, et al. Global functional atlas of Escherichia coli encompassing previously uncharacterized proteins. PLoS Biol. 2009;7:e96. doi: 10.1371/journal.pbio.1000096. [DOI] [PMC free article] [PubMed] [Google Scholar]
- 2.Rentzsch R, Orengo CA. Protein function prediction—the power of multiplicity. Trends Biotechnol. 2009;27:210–219. doi: 10.1016/j.tibtech.2009.01.002. [DOI] [PubMed] [Google Scholar]
- 3.Janga SC, Díaz-Mejía JJ, Moreno-Hagelsieb G. Network-based function prediction and interactomics: the case for metabolic enzymes. Metab. Eng. 2011;13:1–10. doi: 10.1016/j.ymben.2010.07.001. [DOI] [PubMed] [Google Scholar]
- 4.Hawkins T, Kihara D. Function prediction of uncharacterized proteins. J. Bioinform. Comput. Biol. 2007;5:1–30. doi: 10.1142/s0219720007002503. [DOI] [PubMed] [Google Scholar]
- 5.Moriya Y, Itoh M, Okuda S, Yoshizawa AC, Kanehisa M. KAAS: an automatic genome annotation and pathway reconstruction server. Nucleic Acids Res. 2007;35:W182–W185. doi: 10.1093/nar/gkm321. [DOI] [PMC free article] [PubMed] [Google Scholar]
- 6.Friedman N, Linial M, Nachman I, Pe'er D. Using Bayesian networks to analyze expression data. J. Comput. Biol. 2000;7:601–620. doi: 10.1089/106652700750050961. [DOI] [PubMed] [Google Scholar]
- 7.Imoto S, Goto T, Miyano S. Estimation of genetic networks and functional structures between genes by using Bayesian networks and nonparametric regression. Pac. Symp. Biocomput. 2002;7:175–186. [PubMed] [Google Scholar]
- 8.Akutsu T, Miyano S, Kuhara S. Algorithms for identifying Boolean networks and related biological networks based on matrix multiplication and fingerprint function. J. Comput. Biol. 2000;7:331–343. doi: 10.1089/106652700750050817. [DOI] [PubMed] [Google Scholar]
- 9.Toh H, Horimoto K. Inference of a genetic network by a combined approach of cluster analysis and graphical Gaussian modeling. Bioinformatics. 2002;18:287–297. doi: 10.1093/bioinformatics/18.2.287. [DOI] [PubMed] [Google Scholar]
- 10.Marcotte EM, Pellegrini M, Thompson MJ, Yeates TO, Eisenberg D. A combined algorithm for genome-wide prediction of protein function. Nature. 1999;402:83–86. doi: 10.1038/47048. [DOI] [PubMed] [Google Scholar]
- 11.Pazos F, Valencia A. Similarity of phylogenetic trees as indicator of protein-protein interaction. Protein Eng. 2001;14:609–614. doi: 10.1093/protein/14.9.609. [DOI] [PubMed] [Google Scholar]
- 12.Szklarczyk D, Franceschini A, Kuhn M, Simonovic M, Roth A, Minguez P, Doerks T, Stark M, Muller J, Bork P, et al. The STRING database in 2011: functional interaction networks of proteins, globally integrated and scored. Nucleic Acids Res. 2011;39:D561–D568. doi: 10.1093/nar/gkq973. [DOI] [PMC free article] [PubMed] [Google Scholar]
- 13.Aburatani S, Goto K, Saito S, Fumoto M, Imaizumi A, Sugaya N, Murakami H, Sato M, Toh H, Horimoto K. ASIAN: a website for network inference. Bioinformatics. 2004;20:2853–2856. doi: 10.1093/bioinformatics/bth296. [DOI] [PubMed] [Google Scholar]
- 14.Yamanishi Y, Vert JP, Kanehisa M. Protein network inference from multiple genomic data: a supervised approach. Bioinformatics. 2004;20:i363–i370. doi: 10.1093/bioinformatics/bth910. [DOI] [PubMed] [Google Scholar]
- 15.Yamanishi Y, Vert JP, Kanehisa M. Supervised enzyme network inference from the integration of genomic data and chemical information. Bioinformatics. 2005;21:i468–i477. doi: 10.1093/bioinformatics/bti1012. [DOI] [PubMed] [Google Scholar]
- 16.Ben-Hur A, Noble WS. Kernel methods for predicting protein-protein interactions. Bioinformatics. 2005;21(Suppl. 1):i38–i46. doi: 10.1093/bioinformatics/bti1016. [DOI] [PubMed] [Google Scholar]
- 17.Kato T, Tsuda K, Asai K. Selective integration of multiple biological data for supervised network inference. Bioinformatics. 2005;21:2488–2495. doi: 10.1093/bioinformatics/bti339. [DOI] [PubMed] [Google Scholar]
- 18.Bleakley K, Biau G, Vert JP. Supervised reconstruction of biological networks with local models. Bioinformatics. 2007;23:i57–i65. doi: 10.1093/bioinformatics/btm204. [DOI] [PubMed] [Google Scholar]
- 19.Yamanishi Y. Supervised inference of metabolic networks from the integration of genomic data and chemical information. In: Lodhi H, Muggleton S, editors. Elements of Computational Systems Biology. Wiley; 2010. pp. 189–212. [Google Scholar]
- 20.Kanehisa M, Goto S, Sato Y, Furumichi M, Tanabe M. KEGG for integration and interpretation of large-scale molecular data sets. Nucleic Acids Res. 2012;40:D109–D114. doi: 10.1093/nar/gkr988. [DOI] [PMC free article] [PubMed] [Google Scholar]
- 21.Shannon P, Markiel A, Ozier O, Baliga NS, Wang JT, Ramage D, Amin N, Schwikowski B, Ideker T. Cytoscape: a software environment for integrated models of biomolecular interaction networks. Genome Res. 2003;13:2498–2504. doi: 10.1101/gr.1239303. [DOI] [PMC free article] [PubMed] [Google Scholar]
- 22.Kharchenko P, Vitkup D, Church GM. Filling gaps in a metabolic network using expression information. Bioinformatics. 2004;20(Suppl. 1):i178–i185. doi: 10.1093/bioinformatics/bth930. [DOI] [PubMed] [Google Scholar]
- 23.Yamanishi Y, Mihara H, Osaki M, Muramatsu H, Esaki N, Sato T, Hizukuri Y, Goto S, Kanehisa M. Prediction of missing enzyme genes in a bacterial metabolic network. Reconstruction of the lysine-degradation pathway of Pseudomonas aeruginosa. FEBS J. 2007;274:2262–2273. doi: 10.1111/j.1742-4658.2007.05763.x. [DOI] [PubMed] [Google Scholar]
- 24.Moriya Y, Shigemizu D, Hattori M, Tokimatsu T, Kotera M, Goto S, Kanehisa M. PathPred: an enzyme-catalyzed metabolic pathway prediction server. Nucleic Acids Res. 2010;38:W138–W143. doi: 10.1093/nar/gkq318. [DOI] [PMC free article] [PubMed] [Google Scholar]
- 25.Kotera M, Okuno Y, Hattori M, Goto S, Kanehisa M. Computational assignment of the EC numbers for genomic-scale analysis of enzymatic reactions. J. Am. Chem. Soc. 2004;126:16487–16498. doi: 10.1021/ja0466457. [DOI] [PubMed] [Google Scholar]
- 26.Yamanishi Y, Hattori M, Kotera M, Goto S, Kanehisa M. E-zyme: predicting potential EC numbers from the chemical transformation pattern of substrate-product pairs. Bioinformatics. 2009;25:i179–i186. doi: 10.1093/bioinformatics/btp223. [DOI] [PMC free article] [PubMed] [Google Scholar]


