Genome sequencing reveals complex speciation in the Drosophila simulans clade (original) (raw)
Abstract
The three species of the Drosophila simulans clade—the cosmopolitan species, D. simulans, and the two island endemic species, D. mauritiana and _D. sechellia_—are important models in speciation genetics, but some details of their phylogenetic and speciation history remain unresolved. The order and timing of speciation are disputed, and the existence, magnitude, and timing of gene flow among the three species remain unclear. Here we report on the analysis of a whole-genome four-species sequence alignment that includes all three D. simulans clade species as well as the D. melanogaster reference sequence. The alignment comprises novel, paired short-read sequence data from a single highly inbred line each from D. simulans, D. mauritiana, and D. sechellia. We are unable to reject a species phylogeny with a basal polytomy; the estimated age of the polytomy is 242,000 yr before the present. However, we also find that up to 4.6% of autosomal and 2.2% of X-linked regions have evolutionary histories consistent with recent gene flow between the mainland species (D. simulans) and the two island endemic species (D. mauritiana and D. sechellia). Our findings thus show that gene flow has occurred throughout the genomes of the D. simulans clade species despite considerable geographic, ecological, and intrinsic reproductive isolation. Last, our analysis of lineage-specific changes confirms that the D. sechellia genome has experienced a significant excess of slightly deleterious changes and a dearth of presumed favorable changes. The relatively reduced efficacy of natural selection in D. sechellia is consistent with its derived, persistently reduced historical effective population size.
A simple speciation model emerged from the modern synthesis in which populations isolated by geography gradually come to be isolated by biology (Dobzhansky 1937; Mayr 1942, 1963). Under this simple, strictly allopatric model, gene flow between species ceases at every locus in the genome simultaneously so that the genealogical histories of all loci in the genome are compatible with a single species split time. It is increasingly clear, however, that genealogical histories among loci are often incompatible with a single split time, implying that speciation is sometimes complex (Pinho and Hey 2010). Under complex speciation, two populations connected by parapatry, secondary contact, or occasional bouts of migration can experience gene flow at some loci while disruptive natural selection can prevent gene flow at others (Wu and Ting 2004; Pinho and Hey 2010; Yang 2010). As a result, different loci can have radically different genealogical histories, including different interspecific divergence times. In this study, we use new next-generation sequence data to characterize the genome-wide distribution of genealogical histories resulting from speciation among the three species of the Drosophila simulans clade—D. simulans (Sturtevant 1919), D. mauritiana (Tsacas and David 1974), and D. sechellia (Tsacas and Baechli 1981).
Over the past 30 yr, these species have emerged as models for evolutionary genetics, owing in part to their close phylogenetic proximity to D. melanogaster. The common ancestor of the D. simulans clade split from D. melanogaster approximately three million years ago, probably originating on Madagascar (Lachaise et al. 1988; Ballard 2004; Dean and Ballard 2004; Baudry et al. 2006; Kopp et al. 2006). Then, within the last ∼500,000 yr, a _D. simulans_-like ancestor gave rise to two species endemic to islands in the Indian Ocean: D. sechellia on the Seychelles archipelago and D. mauritiana on Mauritius and Rodrigues Islands (Kliman et al. 2000; McDermott and Kliman 2008). The precise timing and order of the two species splits have proven difficult to resolve. Phylogenetic studies using allozymes (Cariou 1987), DNA–DNA hybridization (Caccone et al. 1988), microsatellites (Harr et al. 1998), DNA sequences at multiple, arbitrarily chosen loci (Hey and Kliman 1993; Kliman and Hey 1993; Caccone et al. 1996; Kliman et al. 2000; McDermott and Kliman 2008), from Y-linked loci (Kopp et al. 2006), and from a putative speciation gene (Ting et al. 2000) have yielded all three possible species-level tree topologies. Most recent analyses, however, suggest that, first, D. sechellia and, slightly more recently, D. mauritiana were separately derived from a D. simulans ancestor (Kliman et al. 2000; McDermott and Kliman 2008). Today, D. simulans occurs on the same islands as D. sechellia (Cariou et al. 1990; R'Kha et al. 1991; Legrand et al. 2009), but not D. mauritiana (David et al. 1989; Legrand et al. 2011). Additionally, all three species are incompletely isolated by premating (Coyne 1992; Coyne and Charlesworth 1997), postmating-prezygotic (Price et al. 2000), and intrinsic postzygotic barriers (F1 hybrid females are fertile, F1 hybrid males are sterile) (Lachaise et al. 1986). D. sechellia may be further isolated by ecological specialization to the toxic fruits of its host plant, Morinda citrifolia, which are lethal to D. simulans and D. mauritiana (Lachaise et al. 1988). Notably, D. sechellia has an effective population size roughly an order of magnitude smaller than its two sister species (Hey and Kliman 1993; Kliman et al. 2000; Legrand et al. 2009). Lastly, while the chromosomes of all three species are all homosequential (Lemeunier and Ashburner 1984), small rearrangements do exist (Clark et al. 2007).
Despite geographic, ecological, and multiple reproductive barriers, there is evidence that the speciation history of the Drosophila simulans clade is complex. In D. sechellia, two surprisingly different haplotypes segregate at a small region of chromosome 2L (cytological position 34A), with one closely resembling a D. simulans haplotype (Kliman et al. 2000). This finding is consistent with recent introgression, although lab contamination could not be excluded. In D. mauritiana, >80% of sampled flies carry a ∼15-kb mitochondrial haplotype (maI) that differs by a single nucleotide from a D. simulans haplotype (siIII) found in Madagascar, consistent with very recent introgression, ∼4500 yr ago, via fertile hybrid females (Solignac and Monnerot 1986; Solignac et al. 1986; Satta et al. 1988; Satta and Takahata 1990; Ballard 2000a,b). Two additional low frequency mitochondrial haplotypes in D. mauritiana may have also introgressed from D. simulans, although less recently (Nunes et al. 2010; Legrand et al. 2011). Finally, in both D. sechellia and D. mauritiana, four loci on the non-recombining dot-fourth chromosome have estimated divergence times from D. simulans that are significantly more recent than those from ∼25 other loci throughout the genome (Hilton et al. 1994; McDermott and Kliman 2008). These findings strongly suggest recent mitochondrial gene flow between D. simulans and D. mauritiana and tentatively suggest the possibility of limited nuclear gene flow between D. simulans and both island species.
Here we study the genealogical history of speciation, the degree and genomic distribution of gene flow, and the consequences of lineage differences in effective population size on patterns of coding sequence evolution using novel, deep-coverage, and genome-scale DNA sequence data from the three D. simulans clade species. The genomes of D. simulans and D. sechellia (but not D. mauritiana) were previously sequenced to 6× and 3× coverage, respectively, using Sanger sequencing (Begun et al. 2007; Clark et al. 2007). To increase coverage and to avoid confounding platform-specific sequencing errors with lineage-specific substitutions, we sequenced a D. simulans genome from Madagascar, the D. sechellia reference strain and, for the first time, a widely used D. mauritiana lab strain (True et al. 1996) using a common sequencing platform (Illumina). Our analyses show that the best-fitting species tree approximates a nearly simultaneous population split of D. sechellia and D. mauritiana from a _D. simulans_-like ancestor. However, neither split appears consistent with the strictly allopatric model. Instead, we find evidence for nontrivial amounts of nuclear gene flow between two of the three species pairs. Finally, we find that the relatively smaller effective population size of D. sechellia (Hey and Kliman 1993; Kliman et al. 2000; Legrand et al. 2009) has entailed a lineage-specific increase in the rate of slightly deleterious substitution and a concomitant decrease in the rate of presumed adaptive substitution.
Results
Four species genome alignment
We aligned paired short-read sequences from four runs of an Illumina Genome Analyzer II that include one highly inbred line each of D. simulans, D. mauritiana, and D. sechellia to the D. melanogaster reference genome. The D. simulans line was collected in Madagascar, the presumptive ancestral range of the species (Lachaise et al. 1988; Ballard 2004; Dean and Ballard 2004; Baudry et al. 2006; Kopp et al. 2006), as well as a likely source population for the island endemic species. After filtering low quality read alignments (see Methods), the resulting alignments for D. simulans, D. mauritiana, and D. sechellia cover ∼82.7%, 75.6%, and 85.2% of the length of the D. melanogaster reference sequence at median depths of 16, 20, and 44 reads, respectively (Supplemental Table S1). The D. simulans, D. mauritiana, and D. sechellia alignments show 4.1%, 4.2%, and 5.4% average base mismatch frequencies from the D. melanogaster reference, respectively (Supplemental Fig. S1). The mismatch frequency is higher for the X chromosome than for the autosomes for all three species but is highest for chromosome 4 (Supplemental Fig. S1). The total number of aligned sites that both pass the quality filters and are present in all four species is 86.17 Mbp, which covers ∼72% of the D. melanogaster reference euchromatin sequence length (Supplemental Table S1). A total of 4.51 Mbp of these sites pass the variant quality filter, with 2.26 Mbp occurring as fixed differences between D. melanogaster and all three species of the D. simulans clade and an additional 2.25 Mbp as sites that are variable only within the D. simulans clade.
Patterns of genomic variation and phylogeny
The 2.25 Mbp of sites that vary within the D. simulans clade can be classified into six mutually exclusive site types. We define three types of site for which the derived nucleotide change appears exclusively in one of the three species and an additional three types for which the derived change is shared between two of the three species. The most common site type (39.32%) comprises derived nucleotide changes exclusive to the D. sechellia genome (Table 1). Sites for which the derived change is exclusive to the D. simulans or the D. mauritiana genomes are less frequent, 20.91% and 25.08%, respectively. In contrast, shared derived site types are rare. The most common shared site type occurs between D. simulans and D. mauritiana (5.23%), followed by those shared between D. simulans and D. sechellia (5.22%) and those shared by D. mauritiana and D. sechellia (4.26%). Bootstrap resampling of all 2.25 million variable sites always yields this same relative ordering of site type frequencies in all 1000 replicates.
Table 1.
Observed relative frequencies of the six different variable site type categories in the four species alignment
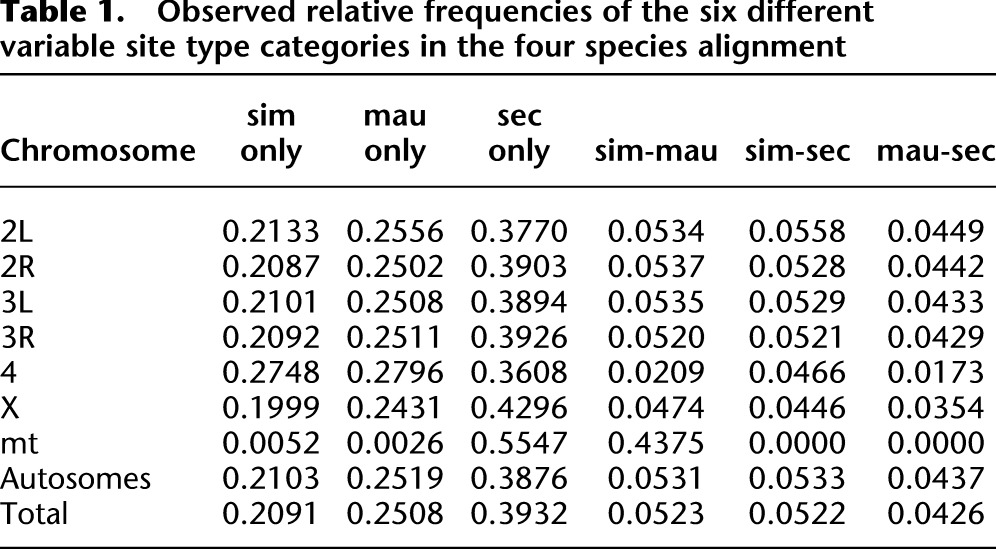
The different compartments of the genome have significantly different site type frequencies (Table 1). Site type frequencies on the X chromosome differ significantly from those on the autosomes (χ2 = 1750; P < 0.001). Relative to the major autosomes, the X chromosome has an excess of sites exclusive to D. sechellia. The frequencies of three shared site types are reduced on the X chromosome compared with the autosomes. A relative dearth of shared site types on the X is expected under an allopatric model of divergence because of its presumed lower effective population size relative to the autosomes. However, given the overall reduction, X-linked sites shared between D. simulans and D. mauritiana are more common than expected (χ2 = 23.81; P < 0.01), whereas sites shared between D. mauritiana and D. sechellia are less common than expected (χ2 = 14.88; P < 0.01). The dot-fourth chromosome shows a more extreme deviation in site type frequencies from those of the other autosomes. In this case, the proportion of shared site types is greatly reduced, with the exception of sites shared between D. simulans and D. sechellia (Table 1). Chromosome 4 also shows a more even distribution of exclusive site types among the three species. Lastly, the mitochondrial genome site type frequencies show the most extreme deviations from the autosomes (Table 1): More than one-half of the variable sites (55.5%) in the mitochondrial genome are exclusive to D. sechellia, and nearly all remaining sites are shared between D. simulans and D. mauritiana (43.8%).
We also estimated site type frequencies in non-overlapping 5-kb windows across the genome (Supplemental Fig. S2). Only windows with ≥20 variable sites were considered. The among-window variance in the local frequency of shared sites between D. simulans and D. sechellia is large compared with that for the D. simulans–D. mauritiana and D. mauritiana–D. sechellia species pairs (Fligner-Killeen test; χ2 = 4.78; P = 0.029). This large variance is characterized by a long upper-tail, with some 5-kb windows having up to ∼55% of variable sites being shared between D. simulans and D. sechellia (Supplemental Fig. S2b). In the next subsection, we ask if these distributions are expected under a model of purely allopatric species divergence.
To assess the total evidence for the phylogenetic relationships between the three species, the complete autosomal alignment was used to estimate a maximum likelihood phylogenetic tree. As shown in Figure 1A, the best-fitting tree groups D. simulans and D. sechellia together, to the exclusion of D. mauritiana. This grouping is supported by an internal branch with a length of 0.0012 changes per site. A likelihood ratio comparing the maximum likelihood tree shown in Figure 1A with the likelihood estimated under a hard polytomy rejects the hypothesis that the length of this interior branch is zero (χ2 = 147,664; P < 0.001). In contrast, the unusual site type frequencies found in the mitochondrial genome result in a highly skewed maximum likelihood tree topology: Across the entire 14,389-bp mitochondrial alignment, the D. simulans and D. mauritiana sequences differ by only three mutations (Fig. 1B). The nearly perfect sequence identity between the D. simulans and D. mauritiana mitochondrial genomes has previously been attributed to recent introgression (Solignac and Monnerot 1986; Aubert and Solignac 1990; Ballard 2000a,b; Nunes et al. 2010).
Figure 1.

Sampling of phylogenetic trees. Three maximum likelihood trees with branch lengths that are estimated under a GTR model of nucleotide substitution. The trees are reconstructed from all aligned sites in the genome (A), all aligned sites from the mitochondrial genome (B), and a 15-kb region on chromosome 3R (C) (D. melanogaster reference coordinates 3R: 16,675,000–16,690,000) that includes the Ir93a and CG3822 ionotropic glutamate receptor genes. The asterisk on the interior branch in panel A indicates that this branch length can be regarded as statistically greater than zero; the resulting node has 100% bootstrap support.
Likelihood-based test for complex speciation
Under a strictly allopatric model of speciation, single lineages sampled from different species are exchangeable (i.e., able to coalesce) only in the population of the common ancestor, prior to the time of the species split. The time to exchangeability, τ, for two lineages from different species will therefore vary across the genome solely due to variation in coalescence times in the ancestral population (Takahata 1986; Takahata et al. 1995). The distribution of divergence times thus depends on the effective size of the ancestral population, but with a distribution that is truncated at a lower bound of τ (Takahata et al. 1995). In a speciation model that includes gene flow, however, some loci become exchangeable at times that are more recent than the species split time (Yang 2010).
To test whether the distribution of site type frequencies in the genome are compatible with a strictly allopatric model of species divergence, we implemented a likelihood ratio test. The test begins by fitting a “global” model of allopatric divergence to the site type frequencies from all sites across a given compartment of the genome. Next, a “local” model is fit to the site type frequencies occurring in a given 1- or 5-kb window of the genome. The likelihood of the global model versus the likelihood of the local model is compared for each window via a standard likelihood ratio test. Therefore, each window is associated with a _P_-value reflecting the deviation of the site type frequencies in that window compared with the rest of the genome. This approach is similar in principle to the maximized composite likelihood surface test to detect regions of genomes affected by natural selection (Kim and Stephan 2002; Nielsen et al. 2005).
Our likelihood ratio test proceeds by estimating parameters of a three-species allopatric model of divergence from the six different site type frequencies for the major autosomes. The allopatric model has five parameters: the species tree topology; the two times of species divergence (_T_1 and _T_2); the ratio of the effective population size of D. mauritiana to that of D. simulans (α); and the ratio of the effective population size of D. sechellia to that of D. simulans (β). Note that the α and β parameters represent ratios of effective population sizes only in the case of strict neutrality of mutations; in practice, these parameters serve as population mutation rate scaling factors that allow the terminal branch lengths of the species tree to vary.
To fit a global model to the site type frequency distributions (Supplemental Fig. S2), we used a coalescent simulation-based approach. An analytical approach, which uses only the first moment of the site type frequency distribution, failed to provide a good fit to the data (not shown). The reason is that the data are fundamentally incompatible with a sequentially bifurcating speciation history in which the two ingroup species have elevated sharing relative to that of either with the outgroup species. Instead, the observed frequencies of shared site types are nearly equal for D. simulans_–_D. mauritiana and for D. simulans_–_D. sechellia (0.0531 and 0.0533, respectively) whereas both are greater than that for D. mauritiana_–_D. sechellia (0.0437) (Table 1). We therefore opted to use a coalescent simulation-based approach to fit a global model to the quantiles of the observed distributions in Supplemental Figure S2 rather than an analytical approach that relies solely on the means (see Supplemental Figs. S3, S4 for quantile-quantile plots for simulated data under the best-fitting global model versus the observed data).
We find that the best-fitting, strictly allopatric global model for the autosomes is a polytomy with an estimated divergence time of 1.21 × 2_N_sim,A generations before the present. Assuming _N_sim,A ≈ 106 and 10 generations per year, this species split time estimate corresponds to ∼242,000 yr ago. The global model for the autosomes estimates that the ratios of effective population sizes (mutation rate scalars) are α = 1.47 and β = 2.26, reflecting the longer terminal branches for D. mauritiana and for D. sechellia, respectively. The best-fitting allopatric global model for site type frequencies on the X chromosome also results in a species tree with a basal polytomy. The estimated time of the polytomy is 1.72 × 2_N_sim,X generations, in which _N_sim,X is the effective population size of the D. simulans X chromosome. Assuming _N_sim,X/_N_sim,A = 0.75 (as expected under an equal breeding sex ratio), then estimated X chromosome species split time is ∼258,000 yr ago. Conversely, assuming that the species split time is the same for both the X and the autosomes (242,000 yr ago), then _N_sim,X/_N_sim,A = 0.70, instead of 0.75. The ratio of the effective population sizes for D. mauritiana to D. simulans is α = 1.40 for the X chromosome and the ratio for D. sechellia to D. simulans is β = 2.30, both similar to the autosomal estimates.
We next allowed the time to exchangeability (τ) to vary among non-overlapping 5- and 1-kb windows across both the autosomes and the X chromosome. For the autosomes, we estimated the likelihood for values of τ between 0.01 and 1.21 in intervals of 0.01, for which the upper bound of 1.21 × 2_N_sim,A generations represents the time of the polytomy in the globally best-fitting model. The autosomal data consist of 66,099 1-kb windows with ≥10 variable sites or 17,703 5-kb windows with ≥20 variable sites. For each window, the likelihood of the locally best-fitting parameters (τ, α, and β) was contrasted with the likelihood of the globally best-fitting parameters. We considered any particular local window significant if the _P_-value of its likelihood ratio test was <0.029, which accommodates the type I error rate associated with the test (see Methods). The 5-kb windows have greater power to reject the global model than the 1-kb windows (see Supplemental Fig. S6).
There are 1151 5-kb windows on the major autosomes and 122 5-kb windows on the X that reject the global allopatric models with P < 0.029. At this level of significance, the false discovery rate (FDR) is ∼30%, so that 822 autosomal and 85 X chromosome 5-kb windows remain after correction. This corresponds to 4.6% of all 5-kb autosomal windows and 2.2% of all 5-kb X chromosome windows that truly reject the allopatric model. Similarly, there are 1180 1-kb windows on the major autosomes with P < 0.029 and, correspondingly, 80 1-kb windows on the X with P < 0.029. Accounting for false discovery (∼30%), 826 autosomal (1.2% of all windows) and 56 X chromosome 1-kb windows (0.6% of all windows) should be considered significant. When discussing the total amount of introgressed genomic regions, we will refer to the 5-kb windows because the likelihood ratio test has greater power with this data set. Figure 2 shows the genomic distribution of significant 1-kb windows and highlights their relative paucity on the X chromosome relative to the autosomes. To determine the robustness of this finding, we evaluated the number of significant windows resulting from the likelihood ratio test over a range of _P_-values, after correcting for multiple tests. For both 1-kb and 5-kb windows, at any arbitrary level of statistical significance, the X chromosome has fewer significant tests than expected (Fig. 3).
Figure 2.

Spacing of putatively introgressed 1-kb windows for each major chromosomal arm. (Red lines) The position of a putatively introgressed 1-kb window between D. simulans and D. mauritiana. (Blue lines) The position of putatively introgressed windows between D. simulans and D. sechellia. (Green lines) The position of windows of putative introgression between D. mauritiana and D. sechellia.
Figure 3.

The number of genomic windows that reject the global allopatric model. Results of the likelihood ratio test comparing globally best-fitting allopatric model parameters versus locally best-fitting parameters in both 5-kb windows (A) and 1-kb windows (B) across both the autosomes (red lines) and the X chromosome (blue lines). The number of windows that reject the global model parameters, after correction for multiple tests, is plotted as a function of the threshold _P_-value that is used to determine significance (see Results section for additional explanation). (Black lines) The expected number of significant windows on the X chromosome, calculated as the product of the number of significant windows on the autosomes and the ratio of the total length of the X chromosome and autosomal alignments. This illustrates a dearth of windows on the X chromosome that are able to reject a strictly allopatric model, given any level of statistical significance.
Features of putatively introgressed genomic windows
To explore why some local genomic windows reject the best-fitting global allopatric model, we focus on 1-kb windows (see above), as these smaller windows span fewer different genealogical histories, on average, than do the larger 5-kb windows. Figure 4 shows the frequency distributions for best-fitting values of τ in 1-kb autosomal windows deemed significant at the level of P < 0.029. Most of the significant 1-kb windows have local genealogies favoring more recent times to exchangeability between _D. simulans_ and either _D. mauritiana_ (median τ = 0.169, or ∼33.8 kya) or _D. sechellia_ (median τ = 0.193, or ∼38.6 kya), with both distributions showing strong modes near τ = 0. The two island endemic species, in contrast, show both the fewest significant 1-kb windows and a flat distribution of τ (median _τ_ = 0.398, or ∼79.6 kya; Mann-Whitney test, _W_ > 95,700; P < 0.001; Kolmogorov-Smirnov test, _D_ > 0.237; P < 0.001). Qualitatively similar results hold for significant 1-kb windows on the X chromosome (Supplemental Fig. S7).
Figure 4.

Test for complex speciation. (A) For the autosomes, the globally best-fitting model is a polytomy with a divergence time of _T_A = 1.21 × 2_N_sim,A generations before the present, while for the X chromosome it is also a polytomy with _T_X = 1.72 × 2_N_sim,X generations. This corresponds to ∼242,000 yr ago for the autosomal data set. (B) Divergence time between pairs of species is allowed to be <1.21 × 2_N_sim,A generations in 1-kb windows across the autosomes. Windows that reject the globally best-fitting model in favor of a more recent divergence time are shown. A total of 379 of autosomal windows support a more recent divergence time between D. simulans and D. mauritiana (31 for the X chromosome), while 507 autosomal windows support a more recent divergence time between D. simulans and D. sechellia (27 for the X). Lastly, 294 autosomal windows support a more recent divergence time between D. mauritiana and D. sechellia (22 for the X). This set of results does not correct for multiple tests, and ∼30% of the windows shown are expected to be false positives.
We next tested if particular features of the genome affect the probability of rejecting the global model. First, we further explored differences between the X chromosome and autosomes. The underrepresentation of putative introgressions on the X chromosome (χ2 = 21.60, P < 0.001) is not evenly distributed among the three species pairs, being strongest between _D. simulans_ and _D. sechellia_ (where we observe 43% of the expected number of introgressions; χ2 = 14.9, _P_ = 0.0012) and weaker for the other two species pairs (≥59%; χ2 ≤ 3.66, _P_ ≥ 0.055). Between _D. simulans_ and _D. mauritiana_, the distribution of _τ_ differs between the X chromosome and the autosomes (Kolmogorov-Smirnov test, _D_ = 0.387; _P_ < 0.001), with a significantly more recent median τ on the X (τX = 0.075 versus _τ_A = 0.169; Mann-Whitney _W_ = 7100; _P_ = 0.0484). No such X–autosome differences in τ occur for the other two species pairs (Kolmogorov-Smirnov test, _D_ < 0.222; _P_ > 0.159; Mann-Whitney W < 7121; _P_ > 0.722). Thus, putative X chromosome introgressions are significantly rarer between D. simulans and D. sechellia and significantly younger between D. simulans and D. mauritiana.
Second, we tested if regions of the genome with low rates of crossing over have different propensities for possible introgression and gene flow (Noor et al. 2001; Rieseberg 2001). For these tests we crudely defined chromosomal regions of low crossing over as those in cytological divisions with estimated rates of 0 cM/Mbp in D. melanogaster (Charlesworth 1996). Across the genomes of all three species pairs, we find no significant effect of recombination rate on the incidence of putative introgression (Fisher's exact test; P ≥ 0.101 for all).
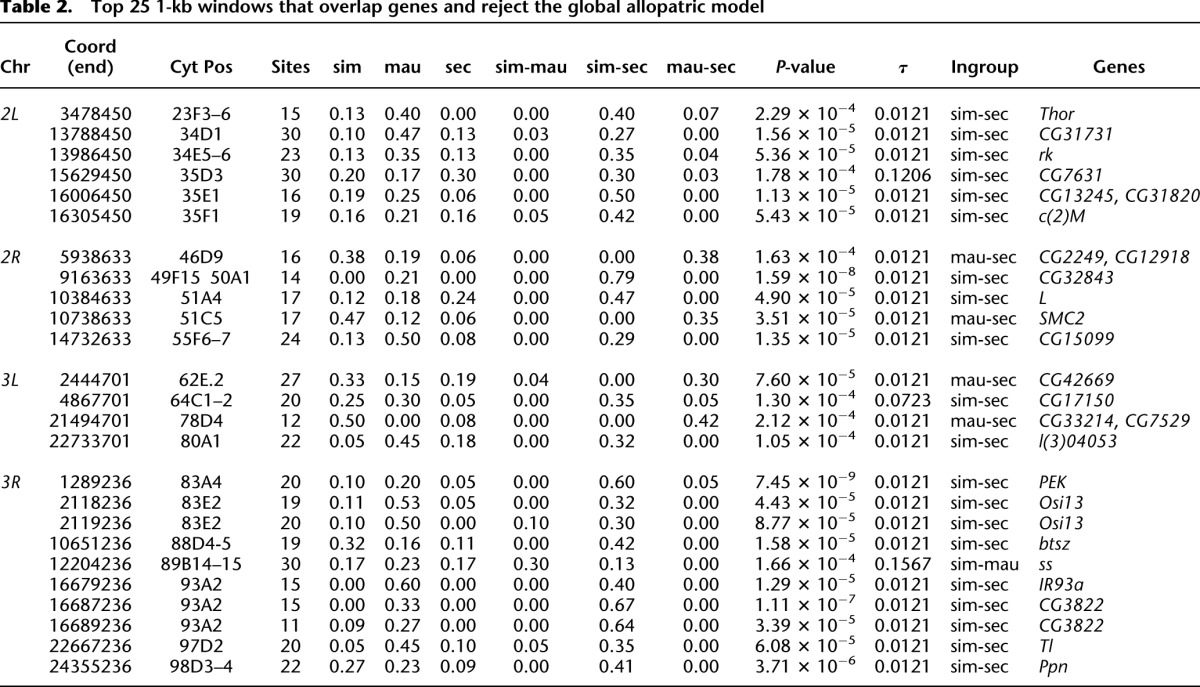
Third, we tested if functional elements of the genome were more or less likely to be shared between species. Across all chromosome arms and for all three species pairs, significant 1-kb windows show a ∼55% enrichment for exonic sequence (Fisher's exact test; P < 0.001). Table 2 shows the 25 most significant 1-kb windows (P < 0.001) that also overlap genes, of which 20 have very recent τ between D. simulans and D. sechellia. The most extreme deviations from the global model involve several windows spanning a ∼15-kb region in cytological division 93A on chromosome arm 3R and comprising two protein-coding sequences, Ir93a and CG3822. In this region, 100% of the shared sites occur between D. simulans and D. sechellia, and nearly all of the remaining sites are exclusive to D. mauritiana. Figure 1C shows a maximum likelihood phylogenetic tree reconstructed from the entire 15-kb region. Interestingly, both Ir93a and CG3822 are members of a gene family encoding ionotropic glutamate receptors known to be expressed in chemosensory neurons (Benton et al. 2009) and which function in the detection of acidic compounds (Ai et al. 2010).
Table 2.
Top 25 1-kb windows that overlap genes and reject the global allopatric model
Lineage-specific coding sequence evolution
We estimated lineage-specific synonymous (_d_S) and nonsynonymous (_d_N) sequence distances for 8222 single-copy genes, a data set comprising nearly 12 Mbp of coding sequence per species. For each species, we calculated sequence distances from the tip of the branch to the parsimony-inferred sequence of the ancestor of the D. simulans clade (Table 3; see Methods). As previous genome-wide comparisons have been made between D. simulans and D. sechellia (Clark et al. 2007; McBride et al. 2007; Singh et al. 2007, 2008), we are especially interested in comparisons involving D. mauritiana: How, in particular, do patterns of substitution compare between the two island endemic species? For D. sechellia, the average _d_S = 0.0264, while those of D. simulans and D. mauritiana are identical, _d_S = 0.0234. The average _d_N is roughly an order of magnitude lower for each species: _d_N = 0.00272, 0.00182, and 0.00188 for D. sechellia, D. simulans, and D. mauritiana, respectively. D. sechellia thus has a 13% higher _d_S and a 47% higher _d_N compared with its two sister species. We also estimated the ratio ω = _d_N/_d_S as a proxy for selective constraint. D. sechellia shows a ∼30% higher ω (0.103) than D. simulans (0.078) and D. mauritiana (0.080). It is important to note that, given the relatively large population sizes and short branches separating each species from their common ancestor, many inferred changes are polymorphisms not fixed substitutions. Although we cannot distinguish polymorphic versus fixed changes with a single sequence from each species, the much smaller effective size of D. sechellia implies that a far greater fraction of changes are fixed in this lineage than in the other two lineages.
Table 3.
Synonymous (_d_S) and nonsynonymous (_d_N) sequence distances between the _D. simulans_-clade ancestor and each extant species

The elevated ω in D. sechellia relative to both of its sister species suggests either a reduced efficacy of purifying natural selection or, alternatively, a genome-wide increased rate of adaptive substitution (see also McBride 2007; Singh et al. 2007, 2008). To distinguish these possibilities, we binned genes into 20 quantiles, each containing ∼410 genes, by their mean level of selective constraint, ω, across the three species. The ratio ω was calculated for each species in comparison with the inferred ancestral sequence. Genes in the lower quantiles are presumably enriched for negative selection, while those in the upper quantiles are enriched for positive selection. For each pair of species, we performed a simple sign test to determine if one species has more genes with higher ω than the other (Fig. 5). Comparing D. simulans with D. mauritiana, we observe no significant sign tests in any bin. However, comparing D. sechellia to the other two species reveals a qualitative difference between genes in the lower versus upper quantiles: For bins having an average ω < 0.155, _D. sechellia_ shows an excess of genes with higher ω; conversely, for bins with an average ω > 0.230, D. sechellia shows a general excess of genes with lower ω. These findings show that D. sechellia has experienced more changes in slowly evolving genes but fewer changes in more rapidly evolving genes. For genes in the top 10% (ω > 0.349), however, there were no significant species differences in ω for any pair.
Figure 5.

Reduced efficacy of selection in D. sechellia. A total of 7008 autosomal genes are binned according to level of selective constraint as measured by the average _d_N/_d_S between the inferred ancestor and each species. In each bin, three sign tests are performed to determine whether, for a given species pair, one species has significantly more genes with higher _d_N/_d_S. (_Y_-axis) Relative excess of genes with higher _d_N/_d_S for the first species in the pair. For example, in the first bin, D. simulans has 185 genes with higher _d_N/_d_S than D. mauritiana, while D. mauritiana has 175 genes with a higher _d_N/_d_S value. The difference, 10, is plotted. Values outside the region delimited by the dashed lines are significant for the sign test. D. sechellia tends to have higher _d_N/_d_S values in genes with high constraint (_d_N/_d_S < 0.155) and lower _d_N/_d_S in genes that experience positive selection or less constraint (_d_N/_d_S > 0.230). There is no significant difference between D. simulans and D. mauritiana for any of the bins.
To evaluate further the relative efficacy of natural selection in D. sechellia, we studied synonymous codon usage, an index of weak purifying selection (Akashi and Schaeffer 1997). We find that D. sechellia has the lowest average frequency of optimal codons (_F_op; D. sechellia: 0.540, D. simulans: 0.543, D. mauritiana: 0.543) across all chromosome arms (Supplemental Table S2; see also Vicario et al. 2007). The lower optimal codon usage in D. sechellia results from the accumulation of nonoptimal synonymous changes. For >475,000 codons in each lineage, we polarized synonymous changes between the inferred ancestor and the three descendant species and categorized the changes as either “preferred,” “unpreferred,” or “equivalent,” according to the optimality of the two codons (see Methods). As may be expected, D. sechellia has the most synonymous changes overall (75,380), while D. mauritiana and D. simulans have similar numbers of substitutions (66,339 versus 66,603, respectively; Supplemental Table S3). For the X chromosome and the major autosomal arms, D. sechellia has significantly fewer preferred changes and significantly more unpreferred and equivalent changes than both D. simulans and D. mauritiana (_χ_2 test, P < 0.01). The D. simulans and D. mauritiana genomes differ only in the number of preferred and unpreferred substitutions on the X, with D. mauritiana having fewer preferred and more unpreferred changes than D. simulans (_χ_2 test, P < 0.001). The distribution of synonymous changes on chromosome 4 does not differ among species. While both D. sechellia and D. mauritiana are recently derived island endemics with necessarily smaller census population sizes than their cosmopolitan sister species, D. simulans, our findings show an overall relative decline in the efficacy of selection that is largely specific D. sechellia (see also Kliman et al. 2000).
Discussion
Our analysis of the genealogical histories of single genomes sampled from D. simulans, D. sechellia, and D. mauritiana yields three main findings. First, the time to a common ancestor for all three species is ∼242,000 yr ago. Second, up to 4.6% of 5-kb windows on the autosomes and 2.2% of 5-kb windows on the X chromosome can be interpreted as having histories consistent with recent introgression between D. simulans and the two island endemic species. Third, the uniquely and persistently reduced effective population size of D. sechellia has been accompanied by a lineage-specific reduction in the efficacy of both purifying and positive natural selection. Below we discuss the history of speciation and gene flow among the three species, including the possible effects of genetic incompatibilities on the genomic distribution of introgressed regions. We also consider the implications of lineage-specific evolution on the accumulation of genetic incompatibilities between the species.
Genealogical history of speciation and gene flow
The overall pattern of nucleotide variation at 2.25 million variable sites across the genome alignment is inconsistent with a single, strictly bifurcating speciation history. This can be most readily inferred from the average frequency of sites shared between pairs of species: The frequencies of sites shared between D. simulans and either of the two island endemics are the highest and equivocal, while those shared between D. mauritiana and D. sechellia are less frequent (Table 1). Under a strictly bifurcating speciation history, only the ingroup species pair should show a high degree of sharing, while sites shared between the outgroup species and each ingroup species are expected to be less frequent. A maximum likelihood phylogenetic tree, reconstructed from the entire autosomal alignment, suggests that D. simulans and D. sechellia group together to the exclusion of the outgroup species D. mauritiana (Figure 1A). However, a coalescent-based analysis is unable to reject a basal polytomy for the species tree. Given the evidence for highly localized regions of derived base sharing between D. sechellia and D. simulans (Supplemental Fig. S2b), the grouping of these two species in the phylogenetic analysis may be a consequence of interspecific gene flow.
We detect a total of 1260 1-kb windows in the genome that have more recent ancestry between pairs of species than expected under the best-fitting genome-wide allopatric divergence model. Of these, 42% show recent ancestry between D. simulans and D. sechellia, 33% between D. simulans and D. mauritiana, and 25% between D. mauritiana and D. sechellia (Fig. 4B). The estimated time to common ancestry among these putatively introgressed windows tends to be more recent for the species pairs involving D. simulans than for the D. mauritiana_–_D. sechellia pair. For the D. simulans–D. sechellia and D. simulans–D. mauritiana species pairs, the distributions of the times to exchangeability (τ) suggest long histories of modest gene flow with strong modes of τ → 0, suggesting very recent introgression within the last ∼2400 yr. These quite recent introgression times are consistent with those previously inferred for the mitochondrial introgression between D. simulans and D. mauritiana (Ballard 2000a,b). It seems possible that these recent introgression times could be the consequence of human activity, moving flies between islands during very recent history.
The genomic distribution of putatively introgressed segments among the D. simulans and the two island endemic species shows that, instead of “islands of speciation,” i.e., regions of differentiation in genomes otherwise consistent with frequent gene flow (Turner et al. 2005), the D. simulans clade species present the opposite, i.e., islands of introgression in genomes with histories otherwise consistent with isolation. Given that, at the resolution of 1 kb, only 1.2% of autosomal windows reject the timing of the allopatric split, it is perhaps unsurprising that previous, smaller scale divergence population genetic analyses failed to reject the strict allopatry model—13 of the 14 loci surveyed by Kliman et al. (2000) failed to sample histories with sufficient signal of introgression. However, Kliman et al. (2000) did uncover one potentially introgressed haplotype, a _D. simulans_-like sequence from the In(2L)t region segregating in D. sechellia but, the authors cautioned, lab contamination could not be excluded. Although our D. sechellia sample does not have the _D. simulans_-like sequence recovered by Kliman et al. (2000), given our evidence for introgression at many other loci between these species, this earlier In(2L)t result seems more plausibly a natural introgression.
We identified several strong examples of recent gene flow (see Table 2), but two cases stand out. First, the mitochondria of the D. mauritiana and D. simulans lines sequenced here differ at just three nucleotide sites. We have by chance sampled the common D. mauritiana mitochondrial haplotype that introgressed from D. simulans some time in the very recent past (Solignac and Monnerot 1986; Solignac et al. 1986; Ballard 2000a,b; Nunes et al. 2010). Second, our genome-wide scan identified a ∼15-kb region on chromosome arm 3R that shows extreme sharing of derived states between D. simulans and D. sechellia. The estimated time to exchangeability, τ, for this region is just ∼2400 yr ago. The region spans three genes, including Ir93a and CG3822, both involved in chemosensory detection of acidic compounds. It is unclear what role, if any, these genes play in the well-documented olfactory adaptation of D. sechellia to the volatile compounds of Morinda fruit. If gene flow occurred from D. simulans into D. sechellia, then it seems doubtful that either of these genes contributes to host specialization directly. However, host specialization also entailed a striking acceleration in the evolution of D. sechellia olfactory and gustatory receptor genes, including a 10-fold increase in the rate of pseudogene formation relative to D. simulans, consistent with relaxed functional constraints (McBride 2007). One possibility, then, is that introgression of the Ir93a_–_CG3822 region from D. simulans may have reversed a previously fixed gene loss in D. sechellia. It is possible, however, that a D. sechellia haplotype at this region has migrated into D. simulans populations in Madagascar. Inferring the direction of gene flow is not possible with a single sequence from each species.
As the X chromosome is known to play a large role in the genetic basis of hybrid male sterility, we tested for simple X versus autosome differences in the propensity for introgression. As X-linked sequences are more likely to be associated with hybrid incompatibilities, they ought to be less likely to introgress between species. In general, we find that putative introgressions are indeed underrepresented on the X chromosome, significantly so between D. simulans and D. sechellia. We hesitate, however, to draw strong conclusions about the contribution of hybrid incompatibilities from these patterns for two reasons. First, the appropriate genetic analyses are lacking. We suspect that the predominant direction of natural introgression involves D. simulans material moving into the two island endemic species. However, most large-scale genetic analyses, and especially those documenting the high density of X-linked hybrid male sterility, have evaluated D. mauritiana material in otherwise D. simulans (True et al. 1996) or D. sechellia genetic backgrounds (Masly and Presgraves 2007). Second, the D. mauritiana_–_D. sechellia species pair—a priori the best candidates for a strictly allopatric history—has a similar underrepresentation of significant 1-kb windows on the X chromosome. While not quite significant (P = 0.056), this observation implies one of two things. Either, contrary to our expectations, some historical gene flow has occurred between the two island endemic species or, alternatively, the underrepresentation of significant X-linked windows between these two species results from something other than gene flow—e.g., complex demography or a greater rate of false discovery on autosomes relative to the X. Given the limits of a single genome sequence from each species, we consider the evidence for gene flow between the island endemics tentative.
Because we estimate the divergence parameters of the D. simulans clade using a neutral model, it is important to consider the effects of non-neutral evolutionary forces on our inferences. Using only a single sequence per species, we cannot distinguish whether variant sites are polymorphisms or fixed substitutions. Some of the variant sites in our data set are undoubtedly deleterious mutations, which exist as transient polymorphisms, but are nevertheless counted as neutral exclusive site types in our analyses. Deleterious mutations should thus introduce an upward bias to our estimates of external branch lengths. Any differences in selective constraint between species are then accommodated in our model by the parameters α and β, the relative effective population size scaling factors. The presence of deleterious mutations in the data set should not systematically bias the inferred species tree topology or the time to exchangeability analysis, as both depend strongly on the frequency of shared site types between two lineages and both tend to be far older than the mean sojourn time of a typical deleterious mutation.
Lineage-specific evolution and the accumulation of hybrid incompatibilities
Like many island endemic species, D. sechellia has both a smaller effective population size and a history of excess non-neutral substitutions relative to its mainland sister species (Kliman et al. 2000; Legrand et al. 2009). As our analysis includes a single sequence from each species, polymorphic and fixed changes are necessarily confounded. Nevertheless, our conclusion that D. sechellia has accumulated an excess of slightly deleterious fixation events is undoubtedly conservative: Polymorphism levels in D. sechellia are known to be nearly an order of magnitude lower than its sister species (Kliman et al. 2000; Legrand et al. 2009), and yet we find that the number of changes on the D. sechellia branch is 150% that of D. simulans, summing over all functional categories of site. Several patterns substantiate that D. sechellia has experienced a reduced efficacy of natural selection. First, the excess of nonsynonymous changes in D. sechellia occurs disproportionately in genes otherwise conserved across the three species (Fig. 5). Second, for genes evolving rapidly across the three species, and thus presumably enriched for adaptive evolution, D. sechellia shows fewer nonsynonymous changes than its sister species (Fig. 5). Finally, the relative excess in changes along the D. sechellia lineage appears to scale with the relative magnitudes of selection coefficients for each mutation class where, roughly, we expect _s_Nonsyn < _s_Unpref < _s_Equiv < 0 < _s_Pref. As shown in Figure 6, when compared with its two sister species, D. sechellia has the greatest relative excess of nonsynonymous changes (40%–50% excess), followed by unpreferred changes (25%–40%) and equivalent changes (5%–20%); conversely, D. sechellia shows a relative dearth of preferred changes (5%–20%). These results and others (Baudry et al. 2006) suggest that the D. sechellia genome has been strongly shaped by nearly neutral evolution. In contrast, despite its endemism to the islands of Mauritius and Rodrigues, D. mauritiana maintains surprisingly high levels of polymorphism, only slightly smaller than the cosmopolitan D. simulans (Caccone et al. 1988; Baudry et al. 2006).
Figure 6.

Relative rates of evolution of four functional classes of mutation. Top panel shows rates for the autosomes, while bottom panel shows rates for the X chromosome. For each pair of species, we calculated the relative excess in the number of changes in species 1 compared with species 2 (see Methods). The functional classes are listed in order of increasing selection coefficient.
The patterns of lineage specific molecular change among the three species have implications for the accumulation of genetic incompatibilities. In particular, theoretical models have considered the possibilities that hybrid incompatibilities accumulate as by-products of neutral (Lynch and Force 2000), peak-shift driven (Carson and Templeton 1984), and a variety of selection-driven substitution processes (Mayr 1963; Frank 1991; Hurst and Pomiankowski 1991). A constant rate neutral model predicts that all three lineages have accumulated similar numbers of hybrid incompatibilities, whereas a peak-shift model predicts that D. sechellia has accumulated an excess of hybrid incompatibilities relative to its two sister lineages. Good estimates exist on the relative densities of the hybrid incompatibilities separating the three species of the D. simulans clade (Palopoli and Wu 1994; True et al. 1996; Tao et al. 2003; Masly and Presgraves 2007). Based on the genetic data, both of these simple predictions can be rejected. Many more genetic incompatibilities exist between D. mauritiana and D. simulans than between D. sechellia and D. simulans (Palopoli et al. 1996). Given the nearly simultaneous species split, these genetic findings suggest D. mauritiana has accumulated genetic incompatibilities more rapidly than D. sechellia. We can also reject a simple relationship between the number of substitutions—greatest in _D. sechellia—_and the number of genetic incompatibilities. These findings, along with the recent analyses of individual hybrid incompatibility genes (Presgraves 2010), suggest that selection-driven models more plausibly account for the accumulation of interspecific genetic incompatibilities. Lastly, it should be noted that, because our alignments primarily cover euchromatin sequence, we are missing heterochromatic regions where several known incompatibilities have accumulated (Cattani and Presgraves 2009; Ferree and Barbash 2009).
Conclusions
Overall, our data are compatible with a model of virtually simultaneous species divergence, followed by limited, albeit recurrent and nontrivial, hybridization and gene flow between D. simulans and the two island endemic species. We find some evidence consistent with interspecific gene flow between D. mauritiana and D. sechellia, but given geographic considerations, we consider these findings provisional. While the genome sequencing data presented here support a model of complex speciation between D. simulans and the two island endemic species, the question of just how permeable the genomes are between these incompletely isolated species deserves further investigation. The main limitation of our analysis is that a single genome sequence per species limits our power to detect, quantify, and determine the directionality of gene flow. Additional genome sequences for each species will allow us to estimate allele frequencies, distinguish substitutions from polymorphisms, and leverage unusual haplotype structure to identify and estimate the age of introgression events.
Methods
Fly inbred lines and library preparation
The Drosophila simulans MD63 line from Madagascar (Dean and Ballard 2004) was sib-mated for 12 generations and genomic DNA (gDNA) was extracted from 15 female flies. gDNA was also extracted from 15 female flies of the D. sechellia reference strain (14021-0248.25). For both D. simulans and D. sechellia, gDNA was extracted using a modified Puregene DNA Extraction Protocol. The 15 frozen female flies for each library were lysed by 300 μL cold Cell Lysis Solution (Qiagen, 158906) with pestle homogenization and incubation at room temperature for 15 min, and treated with 4.5 μL RNase A at 37°C for 15 min. Proteins were precipitated out with 100 μL Protein Precipitation Solution (Qiagen, 158910) and centrifugation at 16,000_g_ for 4 min. gDNA in supernatant was purified by DNA Clean and Concentrator –25 Kit (Zymo, D4005) with five volumes of binding buffer to sample. The quality of all gDNA samples was checked by running on an agarose gel, and the concentration was measured with a Qubit Fluorometer (Invitrogen). For D. mauritiana, gDNA was extracted from 30 females of the laboratory strain, mau12 w (14021-0241.60), using Qiagen DNeasy kit following the manufacturer's recommended protocol.
For the library preparations of D. simulans and D. sechellia, ∼3 μg gDNA was sheared to ∼300 bp with Covaris, followed with end-repairing, A-tailing, ligating to adaptors, selecting size between 350 and 450 bp with 2% agarose gel, and PCR amplifying for 15 cycles. The final product size was estimated to be between 400 and 500 bp on a 2% agarose gel. For D. mauritiana, the estimated size of the final product was between 300 and 400 bp. The concentration of all samples was measured with Qubit Fluorometer (Invitrogen) and the libraries were diluted to a concentration of 10 nM for sequencing.
Genome sequencing and alignment
The D. simulans MD63 line was sequenced on a PE54 lane of an Illumina Genome Analyzer II, which generated 29.0 million paired 54-bp reads. The mean insert size for the MD63 paired reads was ∼350 bp. Similarly, the D. mauritiana mau12 w line sequencing produced a total of 29.4 million paired 86-bp reads with a mean insert size of ∼200 bp. Lastly, the D. sechellia line was sequenced using one PE54 lane and one PE72 lane, resulting in 34.3 million and 44.7 million paired reads, respectively. The mean insert size of the D. sechellia library was ∼350 bp. The BWA software (Li and Durbin 2009) was used to map paired reads to release 5.31 of the D. melanogaster euchromatin reference sequence obtained from FlyBase (Tweedie et al. 2009). To minimize mismatching bases resulting from inaccurate alignments, local realignment around indels was performed with the GATK software (DePristo et al. 2011).
Individual nucleotide sites are considered properly aligned if they meet three criteria: (1) The Phred-scaled root mean square mapping score is greater than or equal to 25 in each of the three species, (2) if the site is covered by a minimum of three reads in each species, and (3) if it has a maximum depth of no more than 15 times the median genomic read depth. Setting a maximum read depth and minimum mapping score reduces the probability of calling SNPs resulting from paralogous alignments. Additionally, a properly aligned site is considered a variant if the Phred-scaled variant score is greater than or equal to 25 in one or more of the species. Variant calling was performed using the POPBAM software (http://popbam.sourceforge.net).
Phylogenetic analysis
We inferred phylogenetic relationships among the four species using alignments of mitochondrial DNA, each chromosome arm individually, and a concatenated alignment of all chromosomes using a maximum likelihood approach implementing in RAxML v7.2.8 (Stamatakis 2006). Phylogenies were inferred using a general time reversible (GTR) model of nucleotide substitution (Tavaré 1986). We modeled among-site variation in substitution rates using a gamma distribution (GTRGAMMA) with four discrete rate categories. Details of the analysis can be found in the Supplemental Methods.
Global allopatric model of species divergence
Autosomal and X chromosome alignments were used to estimate separately the parameters of a “global” model of allopatric species divergence. A global model is one that best explains the totality of the autosomal or X chromosome data. There are five parameters in our simple allopatric model: (1) _T_1, the divergence time between the two most closely related (ingroup) species, (2) _T_2, the divergence time between the ancestor of the ingroup species and the outgroup species, (3) the effective population size of D. mauritiana relative to that of D. simulans (_N_mau = _α N_sim), (4) the effective population size of D. sechellia relative to that of D. simulans (_N_sec = _β N_sim), and (5) the topology of the species tree. The best-fitting global allopatric model will then be used as a null model to test for local occurrences of gene flow between pairs of species (see the Test of Complex Speciation subsection below).
A likelihood approach was used to fit our simple allopatric model to summaries of the data. The aligned sequence data were summarized by classifying each aligned variant site into one of seven mutually exclusive categories. The first category is called fixed, in which the site is determined to have the identical variant in all three species of the D. simulans clade, relative to the D. melanogaster reference sequence. Three additional categories of sites are defined as exclusive, in which only one of the three species has the derived variant base. Lastly, there are three categories of sites that are defined as shared, in which the same derived variant base is shared between two of the three species. The relative frequencies of the six different exclusive and shared site types act as a summary of the phylogenetic patterns inherent in the data and served as the basis for a likelihood-based analysis of an allopatric model of species divergence.
We develop two complementary approaches to estimating the likelihood of the global allopatric model from the site type frequencies. The first approach is analytical and relies exclusively on the first moment of the probability distribution of individual site types under an allopatric model (see Supplemental Methods). The likelihood of the allopatric model parameters were estimated at intervals of 0.01 within the following bounds for each parameter: _T_2 ∈ (0,3], _T_1 ∈ (0,_T_2], α ∈ (0,2], and β ∈ (0,3], where time is measured in units of 2_N_sim generations. The values for these upper bounds were obtained via preliminary exploratory analyses at lower sampling densities.
We also implemented an alternative approach that estimates the likelihood of the allopatric model from the quantiles of the marginal distribution of site type frequencies in windows across the genome. A window size of 5-kb was chosen to balance between linkage and the number of variant sites. This approach uses coalescent simulation to produce distributions of site type frequencies, and a sum-of-squares measure was used to fit quantiles of the simulated distributions to those of the empirical distributions. The priors for mutation and recombination rates can be found in the Supplemental Methods. The minimum sum-of-squares parameter estimates were from the following ranges of values: _T_2 ∈ (0,3], _T_1 ∈ (0,_T_2], α ∈ (0,2], and β ∈ (0,3], which (as above) were determined via exploratory runs.
Test of complex speciation
Because we are analyzing a single sequence per species, the allopatric model can be easily extended to incorporate gene flow simply by allowing the divergence time between a pair of species to be more recent than expected under the purely allopatric model. Under the strictly allopatric version of this model, genomic variation in divergence time between species is solely attributable to the stochastic coalescent process in the ancestral population(s). When no gene flow is allowed, the distribution of divergence times will necessarily have a lower bound at the species divergence time. This is the principle underlying the likelihood ratio test for gene flow proposed by Yang (2010). We adopt this framework, but add additional parameters, such as allowing the effective population size of the species to vary.
The general approach to detecting gene flow from the site type frequency data is to compare the “global” maximum likelihood versus a “local” maximum likelihood in both non-overlapping 1-kb and 5-kb windows. The “global” maximum likelihood is estimated from the site type frequencies from all autosomes considered simultaneously. This method is useful for identifying candidate genomic regions with low-probability evolutionary histories, or histories that are not expected under the global neutral demographic model (Nielsen et al. 2005; Zhu and Bustamante 2005). First, the allopatric model is fit to the totality of the autosomal data and maximum likelihood parameter estimates are obtained. The second step is to calculate the likelihood of the global parameters for each 1-kb and 5-kb window across the autosomes using equations 2–5 (see Supplemental Methods). Then, the _T_2 parameter is held constant while _T_1, α, and β are allowed to vary, resulting in an estimation of a “local” maximum likelihood for that 1-kb or 5-kb window. Windows are subject to the restriction that they have at least 10 (1-kb windows) or 20 (5-kb windows) variable sites present. Each window is now associated with a global and local estimate of likelihood.
A standard likelihood ratio test was implemented to test whether the local likelihood is significantly improved over the global likelihood within windows. The maximum likelihood estimate of τ and species tree topology for each window that rejects the global model was recorded. This procedure was repeated separately for the X chromosome, due to its presumed difference in effective population size from the autosomes. Finally, the relative importance of each site type for determining the _P_-value in a multiple regression model was assessed by averaging over orderings using unweighted averages (Lindeman et al. 1980).
False discovery rate
The test of complex speciation yields a distribution of _P_-values associated with the global null hypothesis that a genomic window could be generated under the null allopatric model. Coalescent simulations under a null model suggest that the complex speciation test has a type I error rate of 0.029 and this value was chosen for our initial critical _P_-value. To account for multiply testing the null hypothesis, we apply a modified version of the FDR correction of Storey and Tibshirani (2003). Like the composite likelihood ratio test used by Williamson et al. (2007), our test is also conservative and reliably shows an excess of _P_-values that are close to one (Supplemental Figs. S5, S6). Williamson et al. (2007) choose to select a tuning parameter using a modified method. The details of our method correcting for multiple tests can be found in the Supplemental Methods.
Coding sequence analysis
A total of 8563 single-copy ortholog sequences were aligned to the genome alignment of the three D. simulans clade species using the BLAST software (Altschul et al. 1990). The resulting high scoring segment pairs were then used in a multiple sequence alignment using the T-COFFEE software (Notredame et al. 2000). A sequence representing the ancestor of the D. simulans clade was reconstructed using a parsimony criterion. Following quality filtering (see Supplemental Methods), a total of 8242 single-copy D. melanogaster genes remained. Pairwise synonymous (_d_S) and nonsynonymous (_d_N) sequence distances for each gene were calculated between each species and the reconstructed ancestral sequence using the method of Nei and Gojobori (1986). To test for differences in the efficacy of selection among the three species, we categorized genes based upon their level of selective constraint, as measured by the average _d_N/_d_S across the three species. These genes were ranked by average _d_N/_d_S and divided into 20 quantiles. For each pairwise comparison of species, we conducted a sign test for the genes within bins to determine if one species has an excess of genes with higher _d_N/_d_S.
We estimated the frequency of optimal codons (_F_op) for each gene in each species using the program CODONW (Sharp et al. 2005). Additionally, we examined codon usage bias by annotating all synonymous coding substitutions between the ancestral sequence and each extant species as either “preferred,” “unpreferred,” or “equivalent.” For this annotation procedure, each codon was assigned a rank value from 1 to 3, where a value of 1 represents the most preferred and 3 is the least preferred. Codons may have the same ranking, which are based on the correlation between codon usage and overall codon usage bias for each gene (Vicario et al. 2007).
Data access
The raw short read sequences used in this study have been submitted to the NCBI Sequence Read Archive (SRA) (http://www.ncbi.nlm.nih.gov/sra) under accession number SRA050824.
Acknowledgments
We thank R. Kulathinal, C. Meiklejohn, and A. Larracuente for comments on earlier versions of the manuscript. This work was supported by a grant from the National Institutes of Health to P.A. (R01-GM083228), funds from the Alfred P. Sloan Foundation, the David and Lucile Packard Foundation, and the University of Rochester to D.C.P., and by funds from the University of Rochester to D.G.
Author contributions: D.G., S.B.K., A.J.G., and D.C.P. conceived and designed the study; D.G. performed the genome assemblies, variant calling, and likelihood-based analyses; A.J.G. performed the phylogenetic analysis; S.B.K. performed the analyses of coding sequence evolution, codon usage, and features of introgressed windows; P.A., A.G.C., and K.R.T. provided materials; and D.G., S.B.K., and D.C.P. wrote the paper.
Footnotes
[Supplemental material is available for this article.]
References
- Ai M, Min S, Grosjean Y, Leblanc C, Bell R, Benton R, Suh GSB 2010. Acid sensing by the Drosophila olfactory system. Nature 468: 691–695 [DOI] [PMC free article] [PubMed] [Google Scholar]
- Akashi H, Schaeffer SW 1997. Natural selection and the frequency distributions of “silent” DNA polymorphism in Drosophila. Genetics 146: 295–307 [DOI] [PMC free article] [PubMed] [Google Scholar]
- Altschul SF, Gish W, Miller W, Myers EW, Lipman DJ 1990. Basic local alignment search tool. J Mol Biol 215: 403–410 [DOI] [PubMed] [Google Scholar]
- Aubert J, Solignac M 1990. Experimental evidence for mitochondrial DNA introgression between Drosophila species. Evolution 44: 1272–1282 [DOI] [PubMed] [Google Scholar]
- Ballard JW 2000a. Comparative genomics of mitochondrial DNA in members of the Drosophila melanogaster subgroup. J Mol Evol 51: 48–63 [DOI] [PubMed] [Google Scholar]
- Ballard JW 2000b. When one is not enough: Introgression of mitochondrial DNA in Drosophila. Mol Biol Evol 17: 1126–1130 [DOI] [PubMed] [Google Scholar]
- Ballard JW 2004. Sequential evolution of a symbiont inferred from the host: Wolbachia and Drosophila simulans. Mol Biol Evol 21: 428–442 [DOI] [PubMed] [Google Scholar]
- Baudry E, Derome N, Huet M, Veuille M 2006. Contrasted polymorphism patterns in a large sample of populations from the evolutionary genetics model Drosophila simulans. Genetics 173: 759–767 [DOI] [PMC free article] [PubMed] [Google Scholar]
- Begun DJ, Holloway AK, Stevens K, Hillier LW, Poh Y-P, Hahn MW, Nista PM, Jones CD, Kern AD, Dewey CN, et al. 2007. Population genomics: Whole-genome analysis of polymorphism and divergence in Drosophila simulans. PLoS Biol 5: e310 doi: 10.1371/journal.pbio.0050310 [DOI] [PMC free article] [PubMed] [Google Scholar]
- Benton R, Vannice KS, Gomez-Diaz C, Vosshall LB 2009. Variant ionotropic glutamate receptors as chemosensory receptors in Drosophila. Cell 136: 149–162 [DOI] [PMC free article] [PubMed] [Google Scholar]
- Caccone A, DeSalle R, Powell JR 1988. Calibration of the change in thermal stability of DNA duplexes and degree of base pair mismatch. J Mol Evol 27: 212–216 [DOI] [PubMed] [Google Scholar]
- Caccone A, Moriyama EN, Gleason JM, Nigro L, Powell JR 1996. A molecular phylogeny for the Drosophila melanogaster subgroup and the problem of polymorphism data. Mol Biol Evol 13: 1224–1232 [DOI] [PubMed] [Google Scholar]
- Cariou ML 1987. Biochemical phylogeny of the eight species in the Drosophila melanogaster subgroup, including Drosophila sechellia and Drosophila orena. Genet Res 50: 181–185 [DOI] [PubMed] [Google Scholar]
- Cariou ML, Solignac M, Monnerot M, David JR 1990. Low allozyme and mtDNA variability in the island endemic species Drosophila sechellia (D. melanogaster complex). Experientia 46: 101–104 [DOI] [PubMed] [Google Scholar]
- Carson HL, Templeton AR 1984. Genetic revolutions in relation to speciation phenomena: The founding of new populations. Annu Rev Ecol Evol Syst 15: 97–131 [Google Scholar]
- Cattani MV, Presgraves DC 2009. Genetics and lineage-specific evolution of a lethal hybrid incompatibility between Drosophila mauritiana and its sibling species. Genetics 181: 1545–1555 [DOI] [PMC free article] [PubMed] [Google Scholar]
- Charlesworth B 1996. Background selection and patterns of genetic diversity in Drosophila melanogaster. Genet Res 68: 131–149 [DOI] [PubMed] [Google Scholar]
- Clark AG, Eisen MB, Smith DR, Bergman CM, Oliver B, Markow TA, Kaufman TC, Kellis M, Gelbart W, Iyer VN, et al. 2007. Evolution of genes and genomes on the Drosophila phylogeny. Nature 450: 203–218 [DOI] [PubMed] [Google Scholar]
- Coyne JA 1992. Genetics of sexual isolation in females of the Drosophila simulans species complex. Genet Res 60: 25–31 [DOI] [PubMed] [Google Scholar]
- Coyne JA, Charlesworth B 1997. Genetics of a pheromonal difference affecting sexual isolation between Drosophila mauritiana and D. sechellia. Genetics 145: 1015–1030 [DOI] [PMC free article] [PubMed] [Google Scholar]
- David JR, McEvey SF, Solignac M, Tsacas L 1989. Drosophila communities on Mauritius and the ecological niche of Drosophila mauritiana (Diptera, Drosophilidae). Revue zoologique africaine 103: 107–116 [Google Scholar]
- Dean MD, Ballard JWO 2004. Linking phylogenetics with population genetics to reconstruct the geographic origin of a species. Mol Phylogenet Evol 32: 998–1009 [DOI] [PubMed] [Google Scholar]
- DePristo MA, Banks E, Poplin R, Garimella KV, Maguire JR, Hartl C, Philippakis AA, del Angel G, Rivas MA, Hanna M, et al. 2011. A framework for variation discovery and genotyping using next-generation DNA sequencing data. Nat Genet 43: 491–498 [DOI] [PMC free article] [PubMed] [Google Scholar]
- Dobzhansky T. 1937. Genetics and the origin of species. Columbia University Press, New York. [Google Scholar]
- Ferree PM, Barbash DA 2009. Species-specific heterochromatin prevents mitotic chromosome segregation to cause hybrid lethality in Drosophila. PLoS Biol 7: e1000234 doi: 10.1371/journal.pbio.1000234 [DOI] [PMC free article] [PubMed] [Google Scholar]
- Frank SA 1991. Haldane's rule: A defense of the meiotic drive theory. Evolution 45: 1714–1717 [DOI] [PubMed] [Google Scholar]
- Harr B, Zangerl B, Brem G, Schlotterer C 1998. Conservation of locus-specific microsatellite variability across species: A comparison of two Drosophila sibling species, D. melanogaster and D. simulans. Mol Biol Evol 15: 176–184 [DOI] [PubMed] [Google Scholar]
- Hey J, Kliman RM 1993. Population genetics and phylogenetics of DNA sequence variation at multiple loci within the Drosophila melanogaster species complex. Mol Biol Evol 10: 804–822 [DOI] [PubMed] [Google Scholar]
- Hilton H, Kliman RM, Hey J 1994. Using hitchhiking genes to study adaptation and divergence during speciation within the Drosophila melanogaster species complex. Evolution 48: 1900–1913 [DOI] [PubMed] [Google Scholar]
- Hurst LD, Pomiankowski A 1991. Causes of sex ratio bias may account for unisexual sterility in hybrids: A new explanation of Haldane's rule and related phenomena. Genetics 128: 841–858 [DOI] [PMC free article] [PubMed] [Google Scholar]
- Kim Y, Stephan W 2002. Detecting a local signature of genetic hitchhiking along a recombining chromosome. Genetics 160: 765–777 [DOI] [PMC free article] [PubMed] [Google Scholar]
- Kliman RM, Hey J 1993. DNA sequence variation at the period locus within and among species of the Drosophila melanogaster complex. Genetics 133: 375–387 [DOI] [PMC free article] [PubMed] [Google Scholar]
- Kliman RM, Andolfatto P, Coyne JA, Depaulis F, Kreitman M, Berry AJ, McCarter J, Wakeley J, Hey J 2000. The population genetics of the origin and divergence of the Drosophila simulans complex species. Genetics 156: 1913–1931 [DOI] [PMC free article] [PubMed] [Google Scholar]
- Kopp A, Frank A, Fu J 2006. Historical biogeography of Drosophila simulans based on Y-chromosomal sequences. Mol Phylogenet Evol 38: 355–362 [DOI] [PubMed] [Google Scholar]
- Lachaise D, David JR, Lemeunier F, Tsacas L, Ashburner M 1986. The reproductive relationships of Drosophila sechellia with Drosophila mauritiana, Drosophila simulans and Drosophila melanogaster from the Afrotropical region. Evolution 40: 262–271 [DOI] [PubMed] [Google Scholar]
- Lachaise D, Cariou M-L, David JR, Lemeunier F, Tsacas L, Ashburner M 1988. Historical biogeography of the Drosophila melanogaster species subgroup. Evol Biol 22: 159–225 [Google Scholar]
- Legrand D, Tenaillon MI, Matyot P, Gerlach J, Lachaise D, Cariou ML 2009. Species-wide genetic variation and demographic history of Drosophila sechellia, a species lacking population structure. Genetics 182: 1197–1206 [DOI] [PMC free article] [PubMed] [Google Scholar]
- Legrand D, Chenel T, Campagne C, Lachaise D, Cariou ML 2011. Inter-island divergence within Drosophila mauritiana, a species of the D. simulans complex: Past history and/or speciation in progress? Mol Ecol 20: 2787–2804 [DOI] [PubMed] [Google Scholar]
- Lemeunier F, Ashburner M 1984. Relationships within the melanogaster species subgroup of the genus Drosophila (Sophophora). 4. The chromosomes of 2 new species. Chromosoma 89: 343–351 [Google Scholar]
- Li H, Durbin R 2009. Fast and accurate short read alignment with Burrows-Wheeler transform. Bioinformatics 25: 1754–1760 [DOI] [PMC free article] [PubMed] [Google Scholar]
- Lindeman RH, Merenda PF, Gold RZ 1980. Introduction to bivariate and multivariate analysis. Scott, Foresman, Glenview, IL [Google Scholar]
- Lynch M, Force A 2000. The probability of duplicate gene preservation by subfunctionalization. Genetics 154: 459–473 [DOI] [PMC free article] [PubMed] [Google Scholar]
- Masly JP, Presgraves DC 2007. High-resolution genome-wide dissection of the two rules of speciation in Drosophila. PLoS Biol 5: e243 doi: 10.1371/journal.pbio.0050243 [DOI] [PMC free article] [PubMed] [Google Scholar]
- Mayr E. 1942. Systematics and the origin of species. Columbia University Press, New York. [Google Scholar]
- Mayr E. 1963. Animal species and evolution. Harvard University Press, Cambridge. [Google Scholar]
- McBride CS 2007. Rapid evolution of smell and taste receptor genes during host specialization in Drosophila sechellia. Proc Natl Acad Sci 104: 4996–5001 [DOI] [PMC free article] [PubMed] [Google Scholar]
- McBride CS, Arguello JR, O'Meara BC 2007. Five Drosophila genomes reveal nonneutral evolution and the signature of host specialization in the chemoreceptor superfamily. Genetics 177: 1395–1416 [DOI] [PMC free article] [PubMed] [Google Scholar]
- McDermott SR, Kliman RM 2008. Estimation of isolation times of the island species in the Drosophila simulans complex from multilocus DNA sequence data. PLoS ONE 3: e2442 doi: 10.1371/journal.pone.0002442 [DOI] [PMC free article] [PubMed] [Google Scholar]
- Nei M, Gojobori T 1986. Simple methods for estimating the numbers of synonymous and nonsynonymous nucleotide substitutions. Mol Biol Evol 3: 418–426 [DOI] [PubMed] [Google Scholar]
- Nielsen R, Williamson S, Kim Y, Hubisz MJ, Clark AG, Bustamante C 2005. Genomic scans for selective sweeps using SNP data. Genome Res 15: 1566–1575 [DOI] [PMC free article] [PubMed] [Google Scholar]
- Noor MAF, Grams KL, Bertucci LA, Reiland J 2001. Chromosomal inversions and the reproductive isolation of species. Proc Natl Acad Sci 98: 12084–12088 [DOI] [PMC free article] [PubMed] [Google Scholar]
- Notredame C, Higgins DG, Heringa J 2000. T-Coffee: A novel method for fast and accurate multiple sequence alignment. J Mol Biol 302: 205–217 [DOI] [PubMed] [Google Scholar]
- Nunes MDS, Wengel PO-T, Kreissl M, Schlötterer C 2010. Multiple hybridization events between Drosophila simulans and Drosophila mauritiana are supported by mtDNA introgression. Mol Ecol 19: 4695–4707 [DOI] [PMC free article] [PubMed] [Google Scholar]
- Palopoli MF, Wu CI 1994. Genetics of hybrid male sterility between Drosophila sibling species: A complex web of epistasis is revealed in interspecific studies. Genetics 138: 329–341 [DOI] [PMC free article] [PubMed] [Google Scholar]
- Palopoli MF, Davis AW, Wu CI 1996. Discord between the phylogenies inferred from molecular versus functional data: Uneven rates of functional evolution or low levels of gene flow? Genetics 144: 1321–1328 [DOI] [PMC free article] [PubMed] [Google Scholar]
- Pinho C, Hey J 2010. Divergence with gene flow: Models and data. Annu Rev Ecol Evol Syst 41: 215–230 [Google Scholar]
- Presgraves DC 2010. The molecular evolutionary basis of species formation. Nat Rev Genet 11: 175–180 [DOI] [PubMed] [Google Scholar]
- Price CSC, Kim CH, Posluszny J, Coyne JA 2000. Mechanisms of conspecific sperm precedence in Drosophila. Evolution 54: 2028–2037 [DOI] [PubMed] [Google Scholar]
- R'Kha S, Capy R, David JR 1991. Host-plant specialization in the Drosophila melanogaster species complex: A physiological, behavioral, and genetical analysis. Proc Natl Acad Sci 88: 1835–1839 [DOI] [PMC free article] [PubMed] [Google Scholar]
- Rieseberg LH 2001. Chromosomal rearrangements and speciation. Trends Ecol Evol 16: 351–358 [DOI] [PubMed] [Google Scholar]
- Satta Y, Takahata N 1990. Evolution of Drosophila mitochondrial DNA and the history of the melanogaster subgroup. Proc Natl Acad Sci 87: 9558–9562 [DOI] [PMC free article] [PubMed] [Google Scholar]
- Satta Y, Toyohara N, Ohtaka C, Tatsuno Y, Watanabe T, Matsuura ET, Chigusa SI, Takahata N 1988. Dubious maternal inheritance of mitochondrial DNA in Drosophila simulans and evolution of Drosophila mauritiana. Genet Res 52: 1–6 [Google Scholar]
- Sharp PM, Bailes E, Grocock RJ, Peden JF, Sockett RE 2005. Variation in the strength of selected codon usage bias among bacteria. Nucleic Acids Res 33: 1141–1153 [DOI] [PMC free article] [PubMed] [Google Scholar]
- Singh ND, Bauer DuMont VL, Hubisz MJ, Nielsen R, Aquadro CF 2007. Patterns of mutation and selection at synonymous sites in Drosophila. Mol Biol Evol 24: 2687–2697 [DOI] [PubMed] [Google Scholar]
- Singh ND, Larracuente AM, Clark AG 2008. Contrasting the efficacy of selection on the X and autosomes in Drosophila. Mol Biol Evol 25: 454–467 [DOI] [PubMed] [Google Scholar]
- Solignac M, Monnerot M 1986. Rate formation, speciation, and introgression with Drosophila simulans, Drosophila mauritiana, and Drosophila sechellia inferred from mitochondrial DNA analysis. Evolution 40: 531–539 [DOI] [PubMed] [Google Scholar]
- Solignac M, Monnerot M, Mounolou JC 1986. Mitochondrial DNA evolution in the melanogaster species subgroup of Drosophila. J Mol Evol 23: 31–40 [DOI] [PubMed] [Google Scholar]
- Stamatakis A 2006. RAxML-VI-HPC: Maximum likelihood-based phylogenetic analyses with thousands of taxa and mixed models. Bioinformatics 22: 2688–2690 [DOI] [PubMed] [Google Scholar]
- Storey JD, Tibshirani R 2003. Statistical significance for genomewide studies. Proc Natl Acad Sci 100: 9440–9445 [DOI] [PMC free article] [PubMed] [Google Scholar]
- Sturtevant AH 1919. A new species closely resembling Drosophila melanogaster. Psyche 26: 153–155 [Google Scholar]
- Takahata N 1986. An attempt to estimate the effective size of the ancestral species common to two extant species from which homologous genes are sequenced. Genet Res 48: 187–190 [DOI] [PubMed] [Google Scholar]
- Takahata N, Satta Y, Klein J 1995. Divergence time and population size in the lineage leading to modern humans. Theor Popul Biol 48: 198–221 [DOI] [PubMed] [Google Scholar]
- Tao Y, Chen S, Hartl DL, Laurie CC 2003. Genetic dissection of hybrid incompatibilities between Drosophila simulans and D. mauritiana. I. Differential accumulation of hybrid male sterility effects on the X and autosomes. Genetics 164: 1383–1397 [DOI] [PMC free article] [PubMed] [Google Scholar]
- Tavaré S. 1986. Some probabilistic and statistical problems in the analysis of DNA sequences. In Some mathematical questions in biology: DNA sequence analysis (ed. RM Miura), pp. 57–86. American Mathematical Society, New York. [Google Scholar]
- Ting CT, Tsaur SC, Wu CI 2000. The phylogeny of closely related species as revealed by the genealogy of a speciation gene, Odysseus. Proc Natl Acad Sci 97: 5313–5316 [DOI] [PMC free article] [PubMed] [Google Scholar]
- True JR, Weir BS, Laurie CC 1996. A genome-wide survey of hybrid incompatibility factors by the introgression of marked segments of Drosophila mauritiana chromosomes into Drosophila simulans. Genetics 142: 819–837 [DOI] [PMC free article] [PubMed] [Google Scholar]
- Tsacas L, Baechli G 1981. Drosophila sechellia, n.sp., huitieme espece du sous-goupe melanogaster des Iles Sechelles (Diptera, Drosophilidae). Rev Fr Entomol 3: 146–150 [Google Scholar]
- Tsacas L, David JR 1974. Drosophila mauritiana n.sp. du groupe melanogaster de l'Ile Maurice. Bull Soc Entomol Fr 79: 42–46 [Google Scholar]
- Turner TL, Hahn MW, Nuzhdin SV 2005. Genomic islands of speciation in Anopheles gambiae. PLoS Biol 3: e285 doi: 10.1371/journal.pbio.0030285 [DOI] [PMC free article] [PubMed] [Google Scholar]
- Tweedie S, Ashburner M, Falls K, Leyland P, McQuilton P, Marygold S, Millburn G, Osumi-Sutherland D, Schroeder A, Seal R, et al. 2009. FlyBase: Enhancing Drosophila Gene Ontology annotations. Nucleic Acids Res 37: D555–D559 [DOI] [PMC free article] [PubMed] [Google Scholar]
- Vicario S, Moriyama EN, Powell JR 2007. Codon usage in twelve species of Drosophila. BMC Evol Biol 7: 226 doi: 10.1186/1471-2148-7-226 [DOI] [PMC free article] [PubMed] [Google Scholar]
- Williamson SH, Hubisz MJ, Clark AG, Payseur BA, Bustamante CD, Nielsen R 2007. Localizing recent adaptive evolution in the human genome. PLoS Genet 3: e90 doi: 10.1371/journal.pgen.0030090 [DOI] [PMC free article] [PubMed] [Google Scholar]
- Wu CI, Ting CT 2004. Genes and speciation. Nat Rev Genet 5: 114–122 [DOI] [PubMed] [Google Scholar]
- Yang Z 2010. A likelihood ratio test of speciation with gene flow using genomic sequence data. Genome Biol Evol 2: 200–211 [DOI] [PMC free article] [PubMed] [Google Scholar]
- Zhu L, Bustamante CD 2005. A composite-likelihood approach for detecting directional selection from DNA sequence data. Genetics 170: 1411–1421 [DOI] [PMC free article] [PubMed] [Google Scholar]