i-cisTarget: an integrative genomics method for the prediction of regulatory features and cis-regulatory modules (original) (raw)
Abstract
The field of regulatory genomics today is characterized by the generation of high-throughput data sets that capture genome-wide transcription factor (TF) binding, histone modifications, or DNAseI hypersensitive regions across many cell types and conditions. In this context, a critical question is how to make optimal use of these publicly available datasets when studying transcriptional regulation. Here, we address this question in Drosophila melanogaster for which a large number of high-throughput regulatory datasets are available. We developed i-cisTarget (where the ‘_i_’ stands for integrative), for the first time enabling the discovery of different types of enriched ‘regulatory features’ in a set of co-regulated sequences in one analysis, being either TF motifs or ‘_in vivo_’ chromatin features, or combinations thereof. We have validated our approach on 15 co-expressed gene sets, 21 ChIP data sets, 628 curated gene sets and multiple individual case studies, and show that meaningful regulatory features can be confidently discovered; that bona fide enhancers can be identified, both by in vivo events and by TF motifs; and that combinations of in vivo events and TF motifs further increase the performance of enhancer prediction.
INTRODUCTION
Understanding the principles of transcriptional regulation remains one of the greatest challenges in functional genomics, despite years of intensive investigations. Spectacular advances in experimental technologies, such as ChIP-seq (1), FAIRE-seq (2) and RNA-seq (3) represent obvious breakthroughs in this field, as they allow interrogating regulatory activity at the genome-wide scale, and are becoming available to most research groups (4,5). However, interpretation of these genome-wide datasets, as well as their integration into a unified model of _cis_-regulation that includes computational motif predictions remains challenging for many biologists, given the amount of information and the lack of appropriate tools. Two typical situations are often encountered in genomics studies. First, given a set of co-expressed genes, an immediate question is whether these genes share regulatory motifs and, if so, which transcription factors (TFs) may co-regulate these genes, or a significant subset thereof. Secondly, given a set of genomic loci identified through DNase-Seq, FAIRE-seq, or ChIP-Seq, motif discovery can be applied in a similar fashion as to co-expressed gene sets, with the aim to confirm the presence of the targeted TF (for ChIP-seq against TFs), uncover novel co-factors, but also disentangle the noisy input set into direct target regions of different TFs. Many tools have been developed in recent years to predict enriched motifs in a set of co-expressed genes [e.g. using proximal promoter sequences such as Clover (6), oPOSSUM (7), PASTAA (8) and PSCAN (9); or to discover de novo motifs, such as oligo-analysis (10), MEME (11) and MotifSampler (12)]. With the increased use of ChIP-Seq, several of these methods have been adjusted to also analyse ChIP peak datasets (e.g. oPOSSUM), and several new methods have appeared, such as peak-motifs (13) and MEME-ChIP (14).
However, with the increasing amount of genome-wide data being generated, another question could be whether some previously identified events (such as DNA binding or histone modifications through ChIP, or DNAse hypersensitive sites, collectively referred to as ‘in vivo events’ or iVE in the rest of this article), possibly in a different biological context, are found enriched in our set of genes or genomic loci. For example, one could ask whether genes found to be highly expressed during a differentiation process through RNA-seq are enriched in ChIP-seq peaks for a particular TF, identified in an independent study; or, whether open chromatin regions isolated using FAIRE-seq are enriched in particular histone modifications, identified in ChIP-seq experiments. In addition, besides individual enriched motifs or iVEs, it often appears that a particular combination of these features drives the activity of regulatory regions, as was shown in many recent studies (15–17). Hence, while enrichment in a particular motif indicates that a region is potentially targeted by a TF, its combination with a particular histone modification indicates that the regions are actually active in the condition investigated. Given their coverage in terms of conditions investigated, large-scale consortia such as ENCODE (18), modEncode (4), or the Berkeley Drosophila Transcriptional Network Project (BDTNP) (19) provide a unique opportunity to address these questions. Hundreds of datasets, investigating histone modifications, chromatin states, chromatin-binding protein and TF-binding events for many cell-lines or developmental stages make it more and more likely that an independent dataset will show an enrichment for some features present in these large-scale repositories.
Here we present a novel method, called i-cisTarget (integrative cisTarget), with the aim to tackle these two challenges: (i) identifying enriched regulatory features, as motifs or iVEs, in a set of co-expressed genes or related genomic loci; (ii) using these features to predict _cis-_regulatory modules (CRMs), either around the set of genes provided, or among the genomic loci submitted, and infer regulatory networks. We have implemented i-cisTarget for Drosophila, as a proof-of-concept, but also because Drosophila is one of the mostly used multi-cellular model organisms to study transcriptional regulation and the _cis_-regulatory code during development, given its relatively compact genome, the genetic tools to manipulate gene regulatory networks, and its suitability for in vivo enhancer validations. Indeed, many of the CRM prediction methods based on TF motif clustering and TF motif conservation have been originally developed and validated in Drosophila, such as Cluster-Buster (20), SWAN (21), Stubb (22), StubbMS (23), Ahab (24), cisDecoder (25) and e-cisAnalyst (26). In i-cisTarget we use an approach based on whole-genome rankings, combined with recovery statistics (27). This approach has been proven to be very powerful for motif discovery, both in Drosophila (28,29) and in the human genome (30,31). Here we modify this methodology to calculate enrichment for iVEs, motif features, motif combinations, iVE combinations and mixed motif/iVE combinations (hence ‘regulatory features’ in general). Importantly, i-cisTarget allows for the analysis of both genomic loci (e.g. ChIP peak datasets) and co-expressed gene sets (e.g. from microarrays and RNA-Seq).
Methods that incorporate iVEs for CRM prediction have been recently developed, such as CENTIPEDE (32), CHROMIA (33), PriorsEditor (34) or CRMDecoder (35) but these methods focus on genome-wide CRM prediction using user-selected ‘tracks’ with iVEs. CRMDecoder does extract enriched iVEs from a training set of CRMs, before applying these to whole-genome scoring (i.e. supervised CRM discovery), but this method is not designed to work on gene sets, nor does it use TF motifs to predict TF target CRMs and regulatory networks.
Given that CRM prediction is greatly aided by iVEs (36,37), a key challenge is to develop methods that identify the most informative iVEs using the results from high-throughput experiments as input. In addition to feature discovery, an important challenge is to use these features in the next step to identify direct target CRMs of TFs and to map gene regulatory networks. In this article, we present a new method, called i-cisTarget, to tackle this challenge. We first describe the methodology used in i-cisTarget, and then show the results of several large-scale validation experiments and its application to large benchmark datasets that we assembled for this study, including ChIP data and co-expressed gene sets. We assess the performance of i-cisTarget in terms of motif and iVE enrichment, the prediction of CRMs, and the prediction of target genes. Finally, we compare the features and the performance of i-cisTarget to other available computational methods for _cis_-regulatory sequence analysis.
MATERIALS AND METHODS
Partitioning the non-coding genome
Our analyses rely on a partition of the non-coding regions of the genome into non-overlapping regions. This partitioning is based on the PhastCons score (38) (Supplementary Figure S1, black track). We use the PhastCons WIG files indicating, for each nucleotide of the genome, its PhastCons score between 0 and 1. This score is averaged over a sliding window of 100 bp, and regions of at least 100 bp with an averaged PhastCons score >0.1 are extracted. This yields a set of disjoint regions (Supplementary Figure S1, orange track), with gaps between them. Suppose we have two regions ri and rj, and we call Gij the gap between them. We now extend the regions ri and rj on both ends, up to the midpoint of Gij. The extended regions are now called Ri and Rj. The full set of {Ri} represents a partitioning of the whole genome (Supplementary Figure S1, light orange track). Since we are interested in regulatory features outside coding regions, we now subtract all coding regions from our set {Ri}; this subtracting is done at the nucleotide level, i.e. certain regions will be shortened, while others fully included in coding regions will be fully removed (Supplementary Figure S1, yellow track). Additionally, regions containing a binding site for a class I insulator are split at the binding site (Supplementary Figure S1, green track). The exon subtraction and insulator splitting might produce small regions at the 5′/3′ edges of genes or near insulator-binding sites; in order to avoid the presence of these small regions, we scan all resulting regions and merge regions <500 bp with surrounding regions until the resulting merged region is >500 bp. Note that we merge regions with the smallest of its surrounding regions first. The complete procedure yields 136 353 regions (referred to as 136K regions) of average size 790 bp (median 751 bp) that cover the entire non-coding part of the Drosophila melanogaster genome (Supplementary Figure S1, red track). Using all 900 CRMs and reporter constructs in the RedFly 3.0 database, we determined that on average, 85% of their sequence is covered by a single region of our 136K partition. This proportion reaches 90% if we restrict this analysis to the 103 CRMs referenced as ‘minimal CRMs’ in the database, i.e. those that have been experimentally shown to be of minimal size. In addition, the majority of these minimal CRMs (all except three) do not show insulator sites. Thus, the genomic regions correspond well to CRMs and candidate CRMs.
Scoring with position weight matrices
The entire 136K region collection is scored for the presence of (conserved) homotypic clusters of binding sites modelled by a position weight matrix (PWM) as described previously (28). Briefly, Cluster-Buster (20) is used for the detection of these motif clusters. Cluster discovery is performed for the complete library of PWMs, resulting in a score-based ranking of the 136K regions for each motif in the collection. To improve the specificity of the predicted motif clusters, sequence conservation is also taken into account. Orthologous regions in 11 related Drosophila species are scored for the presence of these clusters, namely D. simulans, D. yakuba, D. virilis, D. erecta, D. pseudoobscura, D. persimilis, D. ananassae, D. sechellia, D. grimshawi, D. mojavensis and D. willistoni. To find the corresponding regions in these species, the UCSC liftOver procedure from the Kent tools suite (39) is used. LiftOver utilizes a pre-computed genome location transformation between different genome assemblies and species, using the chain files obtained from pair-wise whole genome alignments (40). We allow for non-unique mapping of a reference region to a related genome, taking only the region with the highest motif score into account for the final integration.
Combining the rankings across species via order statistics (OS) culminates in a single ranking for each motif in the collection. OS is a probabilistic method to evaluate the probability (_q_-value) of observing a particular configuration of ranks across the different related species by chance (41,42). This results in a _q_-value for each region based on the species specific ranks and thus effectively integrates all comparative genomics information in a single ranking for each PWM in our library, thereby allowing for motif movement within each region.
Scoring with iVEs
The definition of regions bound by TFs or marked by histone modifications from ChIP data depends on the peak calling algorithm used; many have been defined, but their level of agreement depend on the type of data considered, and the validity of the control model used. In order to remain as unbiased as possible, we decided to rely on continuous normalized density distributions (reads or tilling array intensities) rather than discrete intervals to score genomic regions. Normalized density distributions for ChIP-seq and ChIP–chip data are downloaded from the modEncode, BDTNP and Furlong Lab website in .wig or .sgr format, and converted to BedGraph format (note that this conversion is merely a format conversion, and does not correspond to a definition of ChIP peaks); each of the 136K regions is intersected with each of these continuous density profiles for each iVE using the BedTools (43), and the average per base score for each region and each profile is computed. Based on this score an overall ranking of all regions in the non-coding genome is derived. In this way, a collection of 420 iVEs was compiled (see main text, Supplementary Table S1 and Supplementary Materials and Methods section).
Mapping gene signatures and ChIP peak locations to the genome partitioning
For each D. melanogaster gene annotated in FlyBase release 5.37, a candidate regulatory region was defined. Based on these regulatory regions associated with a gene, the corresponding regions of the 136K genome partition are obtained using BedTools (43). By default this regulatory region is composed of the 5-kb upstream region, limited by the nearest upstream gene, the 5′-UTR and the first intron. We do not consider coding exons of input genes (genes in the co-expressed gene set) to be candidate CRMs, therefore coding exons that reside in these putative regulatory regions are removed. Indeed, to our knowledge the known enhancers that overlap with coding exons are located in neighbouring genes, and not in the transcribed gene itself (44). We refer to a particular definition of candidate regulatory regions for a gene as a demarcation. Multiple other demarcations were assembled; including a demarcation defined not only based on the 5-kb upstream region, but extended with the full transcript of a gene excluding the coding exons. In addition, a demarcation that extends the aforementioned demarcation by a 5-kb downstream region limited by the nearest downstream gene and a demarcation that combines a 10-kb upstream region with the full transcript and the 10-kb downstream region were also created. All these demarcations are available via the web interface and the effect on the performance was investigated on a benchmark of genesets (Supplementary Figure S2). For all the analyses performed in this article, we used demarcations based on the Release 5.12 (October 2008) FlyBase gene annotation. These candidate regulatory regions are initially determined for genes annotated with FBgn identifiers. Via conversion tables available from FlyBase that map between different gene nomenclatures, demarcations for genes defined by annotation IDs (i.e. CG numbers) and symbols were also derived, enabling the analysis of gene signatures supplied in these different gene nomenclatures. To determine the regions of the genome partition that correspond to an input set of ChIP peak genomic locations, we use BedTools. Only the regions that have a minimal overlap of 40% with a ChIP peak or a candidate regulatory region are retained. The overlap fraction is defined as the number of nucleotides that overlap between region and ChIP peak or regulatory region divided by the number of nucleotides in the genome partition region.
Enrichment analysis via cumulative recovery curves
Enrichment is calculated using cumulative recovery curves as described before (28). Briefly, given a set of candidate (or ‘foreground’) regions, corresponding to the regulatory regions associated with a set of co-expressed genes or with the genomic locations of a collection of ChIP peaks, those features are identified for which the top fraction of their associated 136K regions ranking is enriched for these candidate regions. To this end, the recovery of these regions based on the ranking associated with each feature in our collection is assessed by calculating the cumulative recovery of these regions with increasing region rank. Of special interest is the early retrieval of foreground regions, therefore the area under the curve (AUC) for the top ranked regions is used as a metric to quantify the enrichment of these regions at the top of a ranking. The threshold that defines the ‘top’ is a parameter for the user and is set at 1% by default.
The distribution of this AUC metric for all features provides a method to define exceptionally good recovery, as the normalized enrichment score [NES = (AUC − AUCmean)/AUCstd)]. The NES is computed for each feature, and only features associated with a recovery above a certain threshold are considered as enriched features. In the online i-cisTarget application, the threshold can be chosen by the user, and is set to NES ≥ 2.5 by default. In the analysis of ChIP peak data sets, the motif signal is usually much stronger than in co-expressed gene sets, allowing for a more stringent setting of the threshold for ChIP (e.g. NES ≥ 4) to increase the specificity. Because features compiled from different sources may have different AUC distributions, we group these features in different databases. This allows for database-specific enrichment analysis. Note that the calculation of the feature rankings is performed only once and reused for multiple recovery analyses on different region sets. This effectively reduces the computational burden for the calculation of recovery curves, making i-cisTarget an on-the-fly analysis tool.
Validation of motif feature enrichment
To assess the performance of i-cisTarget several benchmarks were created for which the responsible motif (or multiple motifs) for each gene signature and ChIP peak set in the benchmark is known, i.e. 15 gene signatures curated from the literature and 40 ChIP datasets (see ‘Results’ and ‘Discussion’ section). To compensate for the redundancy in the large PWM collection used by i-cisTarget, the enriched features for each benchmark set are clustered via STAMP (see section on PWM library and motif clustering in the Supplementary Materials and Methods) and the enriched cluster of motifs are ranked based on their best ranked motif. The metric used to quantify the performance of i-cisTarget is the best, i.e. lowest, rank of the motif cluster that contains at least one known motif.
Candidate enhancer prediction
i-cisTarget not only predicts the features enriched in a set of co-regulated genes or ChIP peaks. Using the recovery curve for an enriched feature, a list of candidate enhancers for that feature is also provided. These candidate enhancers are defined as a subset of the ‘foreground’ regions, i.e. the fraction of the 136K regions that map to the ChIP peaks or the putative regulatory regions associated with the set of co-regulated genes. More precisely, the maximum deviation of the recovery curve associated with an enriched feature from the average recovery over the entire feature database plus two standard deviations is taken as a threshold on the foreground regions, ranked based on the 136K regions ranking linked with that particular feature. Additionally, the enhancers that are not part of the foreground set but are nonetheless highly ranked for an enriched feature can also be retrieved. This extends the set of predicted target enhancers beyond the initial foreground set.
Fine-tuning the analysis by combining enriched features
The ranking-based framework allows for the creation of new features based on existing ones. Because every available feature is represented as a ranking of non-overlapping regions covering the complete non-coding genome of Drosophila, they can be combined via OS (see section on Scoring with PWMs). From a subset of the enriched in vivo and motif features in a i-cisTarget analysis new combinations can be created, either as pairwise combinations, or by collapsing more than two features into a single feature. These newly created features can be assigned to any feature database used in the initial analysis for assessment of their enrichment.
Validation of candidate enhancer prediction
To validate the enhancers predicted by i-cisTarget, we calculate the positive predictive value (PPV, also referred to as precision) and true positive rate (TPR, also called sensitivity or recall) based on a set of known true enhancers. True enhancers are defined as the subset of the 136K regions that overlap with the true binding regions for a TF, which are derived from a ChIP based in vivo assay or from a database compiling known CRMs such as the RedFly database.
These metrics can be summarized in the F1 measure, the harmonic mean of PPV and TPR: F1-measure = 2 * [(TPR * PPV)/(TPR + PPV)]. A perfect prediction, i.e. only true enhancers are discovered and also all of them, corresponds to a value of 1. If all predicted enhancers are unknown, the F1-measure is 0.
Prediction of HSF and Mef2-binding sites
For HSF, we used the binding locations determined in (44) consisting of 708 unbound HSF motifs. For MEF2, we predicted TFBS using the available MEF2 in TRANSAC (V$MEF2_02, V$MEF2_03) using Matrix-Scan from the RSA-tools suite (45). We used a threshold of 9 on the TFBS score, and removed all sites that overlap a MEF2 ChIP–chip peak within 100 bp, resulting in 4557 predicted, unbound MEF2 sites.
Comparison with other tools
The Linux executable was downloaded and installed for CRMDecoder (35); 370 bed files where downloaded from (i) the modEncode website and (ii) the BDTNP website (DNAseI hypersensitive sites only).
Availability
i-cisTarget is available via an easy to use web interface (http://med.kuleuven.be/lcb/i-cisTarget), providing access to a ‘version 1.0’ database of 4238 motif features and the 420 iVEs used in this article, and to an updated ‘version 2.0’ database with 6383 PWMs and 536 iVEs. All types of analysis can be performed via this interface, including combining enriched features, using the optimal targets of an enriched feature as input set for another analysis (serial i-cisTarget analysis), and retrieving genome-wide CRM predictions. Additionally, a UCSC custom track with the predicted motifs and CRMs for enriched PWM features can be calculated.
Supplementary materials and methods
The Supplementary Materials and Methods contain further information about: Collections of motifs and iVEs used; PWM library and motif clustering; support for both gene signatures and genomic loci; extending less abundant feature databases for enrichment analysis; Combining gene sets and genomic loci for validation purposes; and Analysis of FlyBase TermLink sets.
RESULTS
A new genome-wide scoring and enrichment scheme
Figure 1 shows the components of i-cisTarget. The user input to i-cisTarget is a set of gene identifiers, for example a set of co-expressed genes, or a set of genomic loci (e.g. ChIP peaks) in a bed file. The output is a list of enriched features, either motifs or iVEs, and for each of these features, a list of highly enriched regions for this particular feature, representing potential CRMs. The input set is mapped to a database of 136 353 predefined genomic regions—called the 136K set—that covers the entire non-coding genome (see ‘Materials and Methods’ section Partitioning the non coding genome and Supplementary Figure S1). The subset of genomic regions that overlaps with the input set determines the foreground set (see ‘Materials and Methods’ section Mapping gene signatures and Supplementary Figure S3 for details on how the optimal overlap is determined). Next, the enrichment of the foreground set for regulatory features is tested, relative to the entire 136K set. To allow for complex scoring methods including Hidden Markov Models, for cross-species conservation of motif occurrences, and for including thousands of features, we have separated the actual scoring and ranking of the 136K set from the enrichment calculation (Figure 1). Offline, the 136K set is scored for clustered and conserved occurrences of motifs, using thousands of PWMs and for average peak intensities using hundreds of iVE data sets (Table 1, Supplementary Table S1 and Supplementary Materials and Methods). Online, we determine the AUC of the cumulative recovery curve of the candidate regions along the ranked list of all 136K regions (see ‘Materials and Methods’ section Enrichment via cumulative recovery curves), and convert the AUC scores into normalized enrichment scores (NES) (see Supplementary Figure S4 for an example analysis). We observed that different feature types can result in different AUC distributions, and therefore use as a default setting in i-cisTarget to normalize the AUC scores separately for each feature collection. This way, the NES scores become comparable, and different feature types can be presented in one output table (Supplementary Figure S4).
Figure 1.

Flowchart of i-cisTarget. The 136K regions are scored in batch (i.e. offline) with collections of PWMs and iVEs, yielding PWM and iVE rankings respectively. An input set of genes or genomic loci is mapped to the 136K set to obtain a set of foreground sequences. The enrichment of the foreground sequences is calculated in all rankings using recovery curves and statistics. Top ranking regions for enriched features represent candidate CRMs.
Table 1.
Available features in i-cisTargeta
| Version 1.0 (used in the text) | Version 2.0 (available online) | |
|---|---|---|
| Motifs | 3731 PWMs: | 6383 PWMs: |
| 1. JASPAR (74) | Updated databases used | |
| 2. TRANSFAC (78) | in version 1.0+ | |
| 3. FlyFactorSurvey (77) | 1. YeTFaSCo (82) | |
| 4. Tiffin (75) | 2. hPDI (81) | |
| 5. Elemento et al. (76) | ||
| 6. Stark et al. (79) | ||
| 7. SelexConsensus (75) | ||
| In vivo events | 420 iVEs: | 536 iVEs: |
| 1. modENCODE (4) | Updated databases used in | |
| 2. BDTNP (80) | version 1.0, now categorized as: | |
| 3. Furlong laboratory (46) | 1. TF binding (109 data sets) | |
| 4. chromatin states (4) | 2. non-TF-binding (216 data sets) | |
| 3. histone modifications (211 data sets). |
Identification of regulators and functional regions on datasets of genomic loci
We have applied i-cisTarget to several ChIP–chip and ChIP-Seq experiments (Supplementary Table S1). We have first evaluated the ability of i-cisTarget to find enrichment for the expected motifs, on a collection of ChIP datasets for which the targeted TF is known: 25 ChIP-seq datasets for 22 TFs from the BDTNP consortium, 15 ChIP–chip dataset for five TFs from E. Furlong’s lab (46), and one additional ChIP-seq dataset from Guertin et al. (44). These sets are tested for motif enrichment using version 1.0 of the PWM library (Table 1).
For the BDTNP dataset, i-cisTarget can identify the correct motif in 18 out of the 25 cases (the TF MED is chipped at three different stages and HB at two different stages), and in 11out of 25 cases this motif is among the three top motifs (Figure 2A, see section Validation of motif feature enrichment in ‘Material and Methods’ section for the details). For the Daughterless dataset, the motif is found with a NES of 3.9, which is just below our stringent threshold of 4. The more difficult cases are D, DL, GT, MED, TLL and BAP, for which the expected motif is not found as significantly enriched. De novo motif discovery also fails to find these motifs, indicating that these datasets the expected motif is indeed not enriched among these ChIP peaks (data not shown). For the mesodermal dataset, which contains ChIP–chip results for MEF2, BIN, BAP, TIN and TWI, the correct motif is among the top three scoring motifs in all cases, except for the MEF2_4h-6h and the BAP datasets. Finally, we confirmed the good performances in motif-enrichment on the ChIP-seq dataset of Guertin et al. (44), consisting of 422 regions bound by heat-shock factor (HSF) in S2 cells, in which the HSF motif (M01244-V-HSF2_02, first motif) reaches an impressive NES of 26.1. The heatmap thus highlights the high sensitivity of our motif enrichment approach, as well as its specificity, given that most cells are empty in the heatmap, except for some known co-factors: Bagpipe and Biniou in the visceral mesoderm (47); or Knirps and Hunchback in the blastoderm (19). Furthermore, the NES score not only provides a qualitative indication of possible binding of the corresponding TF, but it also provides quantitative information on the amount of binding, as can be seen on the example of the Zelda motif. The 15 mesodermal datasets have various NES scores which seem to be higher for early datasets. Using a published ChIP-seq dataset on Zelda (48), we show that the amount a actual overlap of Zelda-binding events with the 15 mesodermal datasets is highly correlated to the NES score of the corresponding Zelda motif (Supplementary Figure S5).
Figure 2.

Motif and iVE discovery in sets of genomic loci. (A) Heatmaps displaying the motifs discovered in various ChIP datasets; red indicates that the motif ranks among the top three motifs, pink that the motif has an enrichment score above the NES threshold (NES ≥ 4), and black indicates that the expected motif is not found. The grey square for da indicates that the DA motif is found with a NES of 3.9, just below our stringent threshold of 4. Note that the absence of the dl motif in the BDTNP DL dataset is likely due to an incorrect dataset (see text). (B, C) Scatterplot of NES scores for top rankings iVEs in set of bound versus unbound regions for heat-shock factor (B) and MEF2 (C). iVE directly related to the condition of the dataset (S2 cell for HSF; embryonic for MEF2) are represented by green triangles.
We next turned to iVE enrichment. We used as a first test the same HSF dataset mentioned previously (44), and a control set of 708 control regions that contain predicted HSF-binding sites but with no evidence of HSF binding in the ChIP data, taken from (44). Running i-cisTarget on both datasets using PWMs and iVEs yields the HSF motif as the feature with the highest NES in both datasets (respectively 26.1 and 23). This comes as no surprise, given that the control set was based on the presence of a high affinity TFBS. Therefore, the motif alone cannot distinguish bound from unbound regions. Turning to iVEs, 19 have a NES > 4 in the bound set, versus 6 in the unbound control dataset (Figure 2B). Among the enriched features in the positive dataset most are related to open and active chromatin: GAF/Trl binding, enrichment of DNAseI hypersensitive sites (DHS) in S2 cells, or presence of H3K27ac marks in S2 cells. Note that 5 of the 19 enriched marks are specific to S2 cells, corresponding to the cell line used for the ChIP-seq assay. On the other hand, the five enriched marks in the unbound set correspond to features for early embryonic stages (E0-4h caudal) and are not related to HSF binding or typical regulatory properties of S2 cells. The only high scoring feature in this set is CBP binding at pupal stage, which might indicate that some of the predicted TBFS could be bona fide binding sites at later stages or in different conditions. Indeed, 27 of the 708 HSF-unbound regions intersect with HSF-binding events in Kc167 cells (49).
To verify whether this works for other factors too, we have repeated the same analysis for MEF2, a TF primarily involved in myogenesis. We used MEF2 ChIP–chip data (46) at all timepoints as a positive set, and generated unbound regions by selecting the 4500 top-scoring MEF2-binding sites obtained using the Matrix-Scan method from RSAT (50) with the TRANSFAC MEF2 matrix. Note that the positive and control sets were size matched. Performing the analysis on iVEs yields analogous results as seen for the HSF case. Namely, features related to open/active chromatin (e.g. DHS, GAF binding and CBP binding) have very high enrichment scores in the positive set (Figure 2C). On the other hand, the unbound set shows much fewer enriched features, mostly related to repressive marks, like insulators [e.g. Su(HW), mod2.2] or heterochromatin (HP2), corroborating that these MEF2 sites are not bound in vivo. In both cases (HSF and MEF2), we verified that sets of random regions of similar sizes do not show any enriched features with an NES > 4. In conclusion, relevant motifs and iVEs can be identified from ChIP peak data sets using i-cisTarget.
Identification of regulators and functional CRMs on co-expressed gene sets
We constructed a benchmark dataset of co-expressed gene signatures obtained by microarray experiments [some were described in (28) and we have added several more data sets, see Supplementary Table S1]. The gene signatures were chosen in such as way that they are likely enriched for direct target genes of a particular TF, either because a gain-of-function or loss-of-function experiment for that TF was performed, or because the gene-expression data were obtained in purified cells, such as the proneural cluster (PNC) dataset (51), where the master regulators are known [Su(H) and Achaete/Scute for neuronal specification in the PNC (51)]. Across the benchmark we successfully identified the correct motif for 10 out of the 12 expected TFs (Figure 3A; Supplementary Note S1 discusses the two failures, marked as black squares in Figure 3A).
Figure 3.

Motif and iVE discovery in gene sets. (A) Heatmaps displaying the motifs discovered in various gene sets datasets; red indicates that the motif ranks among the top three motifs, pink that the motif has an enrichment score above the NES threshold (NES ≥ 2.5), and black indicates that the expected motif is not found. (B, C) Scatterplot of NES scores for gene sets related to a mutant condition of a TF, and the corresponding ChIP dataset for this TF; the red dashed line indicates the NES threshold of 2.5 for the gene set.
Our new approach of mapping a set of co-expressed genes to a set of predefined genomic regions (see ‘Materials and Methods’ section) performs equally well, if not better, compared to ‘gene-based’ approaches (28,30,31) (Supplementary Figure S6). However, the region-based approach now also allows identifying enriched iVEs on gene sets, besides PWMs. We ran i-cisTarget on the Zelda LOF and the PNC gene sets from the benchmark, this time using both the 3731 PWMs and 420 iVE features. Remarkably, in both cases, by normalizing each type of regulatory features separately, the final ranking of regulatory features contains a mixture of PWM and iVEs among the top ranked features. On the Zelda LOF dataset, the top two motif clusters are the Zelda/VFL motif (best representative motif: elemento-CAGGTAG; NES = 15.5) and the BCD motif (best representative: selexconsensus-oc, NES = 5.17); indeed, the fact that an independent bicoid-related iVE is found highly enriched (BDTNP-BCD; NES = 4.36) confirms that the motif cluster is likely representing BCD, rather than OC or GSC. Moreover, several enriched iVEs are pointing at Caudal (modEncode-MAT_GFP_7T-E-0-4h, BDTNP-cad) as an important co-factor of Zelda, while another enriched iVE from a different datasource is early Twist (Furlong-TWI-2-4h; NES = 5.10). Interestingly, these TFs have recently been shown to be key players in the maternal to zygotic activation, together with Zelda and STAT92E, which is also found among the enriched iVEs (modEncode-MAT_Stat92E_E0-12h; NES = 3.01) (52). Finally, several features related to H3K27me3, a polycomb-related repressive mark, are found enriched, in accordance with the tight early transcriptional control through PcG complexes.
On the PNC data set the enriched PWMs represent the characteristic TFs involved in PNCs [Su(H) and Achaete/Scute] and several other relevant TFs (Pointed and Grainyhead) (Supplementary Figure S7; the entire i-cisTarget results are available from our website). Among the most enriched iVEs from BDTNP on the PNC set are BDTNP-da (NES = 6.74), derived from ChIP against the proneural partner Daughterless (DA) and BDTNP-MED (NES = 4.95), derived from ChIP against Medea, which is an effector of the dpp-signalling pathway. This is an interesting finding in the light of the recent discovery that SMAD proteins, the vertebrate homologues of Medea, co-operatively bind to CRMs with cell-type specific master regulators, such as Myod1 in myotubes, Oct4 in ESCs and PU.1 in pro-B cells (53). Our finding of DA-ChIP and MED-ChIP co-operation in proneural clusters cells suggests that Smad/Medea co-operativity with a master TF may be a conserved phenomenon. Finally, several iVEs from modENCODE are among the top features, including the H3K27me3 ChIP data and POLII binding. Although polII binding is historically linked with proximal promoters, several recent lines of evidence indicate it can be generally associated with CRMs, even with distal CRMs (16,54,55)
To confirm that i-cisTarget identifies meaningful iVEs from gene sets, we selected cases for which both gene-expression data and sets of genomic loci are available, and compared the enrichment scores of features on both types of datasets. These are the Zelda and MEF2 cases, having a LOF gene set (56,57), as well as a ChIP datasets of binding locations (46,48,57) This is an interesting configuration, which allows us to tackle the question of regulatory feature enrichment from two independent perspectives, in particular for iVEs; indeed, if the enriched iVEs identified in gene sets are truly related to CRMs regulating these genes, then the same iVEs should also be enriched in the corresponding ChIP datasets or CRMs. If not, then the identified iVEs might rather be related to specific regions of the 136K regions overlapping the genes (e.g. promoters, TSS, introns) other than enhancer regions. The result of the comparative i-cisTarget analysis (see ‘Material and Methods’ section Combining gene sets and genomic loci for validation purposes) is striking (Figure 3B–C): apart from a few exceptions, the majority of enriched iVEs detected in the gene sets are also enriched in the corresponding CRM set. This is particularly true for iVEs that are directly related to the biological context investigated (embryonic features for the Mef2 case, S2-related features for the Zelda case). This indicates that, starting from a set of co-expressed genes, i-cisTarget is able to highlight the iVEs that are related to their co-regulation by common TFs. This confirms the validity and robustness of our feature enrichment approach in detecting specific features (motifs and iVEs) from a gene set that are relevant for the actual CRMs regulating these genes.
i-cisTarget accurately predicts candidate CRMs from gene sets
Each enriched feature selects a subset of highly ranked regions from the input set. We reasoned that these are candidate CRMs regulating the set of input genes, and verified this on the two test cases presented above; we first used the Zelda ChIP-seq mentioned previously as an independent validation for the CRM predictions on the Zelda LOF gene set. The optimal threshold determined by i-cisTarget leads to 72 direct target CRM predictions for the CAGGTA motif, of which 62 (86%) intersect a Zelda ChIP peak (Figure 4A). This represents a 3.6-fold increase of the precision rate (i.e. positive predictive value or PPV) compared to the input (198 of the 831 input regions, or 24%, overlap with a Zelda ChIP peak) and clearly illustrates the high precision of the target CRM predictions based on predefined genomic regions. We performed this analysis also on enriched iVEs, and on combinations of PWMs and iVEs (see ‘Materials and Methods’ section Fine-tuning the analysis by combining enriched features). i-cisTarget is based on ranking statistics and therefore allows to combine features from the same or across databases using OS, without the need to re-score a genomic sequence and to re-normalize scores across different feature types (41). We assessed whether the combination of motifs with iVEs can increase the PPV on CRM detection. Indeed, several of these combinations lead to significant increases in the precision and/or recall of the prediction (Figure 4A), as well as the F1-score (Figure 4B; see ‘Materials and Methods’ section Validation of candidate enhancer predictions): BDTNP-CAD combined with the CAGGTAG motif reaches a PPV of 98% (87/89) and a TPR of 43% (87/198), thus outperforming each of the individual features. The highest recall (54%) is obtained for the combination of BDTNP-TLL with CAGGTAG.
Figure 4.

Assessment of CRM prediction performance. Scatterplots showing the precision/recall performances of CRM prediction for the zelda gene set (A) and the proneural gene set (C); precision/recall can be summarized into a F1-score, which is shown as histograms for both datasets (B, D). Feature combinations are represented in red, iVEs in green and motifs in blue. Feature sources are abbreviated as ME for modEncode, B for BDTNP.
In the analysis of the PNC gene set, we have no ChIP data for Su(H) or the proneural factor to indicate the true CRMs. Here, we used all annotated CRMs from RedFly as true CRMs, in total 82 CRMs overlapping with 85 regions (min. 40% overlap), of which many are active in the PNC (e.g. enhancers in the E(spl) complex or the Achaete–Scute complex). Here we assess whether, starting from the co-expressed genes, the true CRMs can be identified, by following the highly ranked genomic regions for a particular enriched feature.
Indeed, we observe a significant enrichment in true positive CRMs in the top ranking regions of enriched features. The best individual feature is BDTNP-DA, corresponding to the best NES score in i-cisTarget (PPV = 22.4%, as compared to the 85 positive regions versus the 1476 input regions, corresponding to 6%, Figure 4C). Note that BDTNP-MED shows a similar result, corroborating our hypothesis that the DA and MED TFs co-operatively bind to proneural enhancers. The low PPV values are due to the small number of validated CRMs in RedFly, and is likely largely underestimated. Interestingly, we found that again the combination of two features, particularly a PWM and an iVE, outperforms individual features in terms of precision/recall. The best feature combinations, in terms of the F1 score increase compared to the input, are the SU(H) PWM combined with either DA or MED ChIP data (Figure 4D). Four of the target predictions for [E-box, BDTNP-DA] are shown as example in Supplementary Figure S7 as UCSC Genome Browser images.
In conclusion, the analysis on co-expressed genes results in meaningful regulatory features, both PWM features and iVEs. Using any of these top-enriched features, or combinations thereof, leads to the prediction of direct target genes (a subset of the set of input genes) and target CRMs, operating in the gene-regulatory network (GRN) underlying the biological process under study.
i-cisTarget allows fast analysis of hundreds of data sets and predicts tissue-specific gene regulatory networks
i-cisTarget can analyse a set of genes, or a set of genomic loci (even thousands of regions) in a few seconds. We have therefore implemented a batch analysis function in the online i-cisTarget application, allowing to perform one analysis with hundreds of data sets (using the GMT file format, see Supplementary Materials and Methods). To illustrate the potential of this feature, we analysed a large compendium of 628 sets of genes that are co-expressed in the same cell type or anatomical structure in the fly (based on immunohistochemistry or in situ hybridization) (58). Despite the sparse knowledge of validated tissue-specific co-localization, we identified in 290 sets an enriched motif for at least one TF that is co-localized in the same tissue. Moreover, in 188 sets, the number of tissue-specific TFs for which the motif is enriched, was significantly higher than expected by chance (Data not shown). This means that for these 188 sets the predicted TF-target relations are of high confidence and can be used to draw regulatory subnetworks that connect the co-expressed genes. As an example, we present the i-cisTarget analyses for four of these sets, namely ‘adult mushroom body’ (FBbt:00003684), ‘Kenyon cells’ (Fbbt:00003686; a child term of adult mushroom body), ‘Pericardial cells’ (FBbt:00005058) and ‘Cardioblast’ (FBbt:00001666). First, on a set of 48 genes expressed in the mushroom body and a set of 15 genes expressed in the encompassed Kenyon cells, we identified the motifs of three TFs that have a known role in these cells, namely Eyeless, MEF2 and ECR (59,60,83). Hence, of the six TFs annotated as expressed in these cells, three are predicted as master regulators by i-cisTarget. This leads to several new interesting, high-confidence target gene predictions from which we derived a predicted GRN (Figure 5A). These predictions provide new insight into the role of the master regulator in the Drosophila brain, Eyeless, for which we predict multiple target genes like fru, Fas2, hh, Appl, tll and Mef2. The prediction that EY could drive the hedgehog pathway during development of the mushroom body by directly controlling hh at the transcriptional level bares similarities to eyeless being upstream of the hedgehog pathway during retinal determination, where the hedgehog pathway drives the movement of the morphogenetic furrow, downstream of eyeless (61). It is remarkable that the few TFs annotated with these FBbt terms are so highly interconnected. The same is true for the TFs involved in heart development, as shown in the networks drawn for pericardial cells and cardioblast (Figure 5B–C). These two networks show similarity and differences between cardioblasts and pericardial cells in terms of TF-target interactions. tinman and Mef2 are expressed in both cell types, and the IVEs and/or motifs for both TFs are found for both sets, while the other TFs are specific for one cell type (hth, Doc2 and Antp are expressed only in cardioblasts where their motifs are found enriched). Surprisingly, in the heart cases only the corresponding iVE for MEF2 (MEF2 ChIP data) is found enriched, while in the mushroom body data set both the MEF2 motif and the iVE were found. It is possible that MEF2-binding sites in cardiac cells are not well represented by the available MEF2 PWMs in our library. Among the predicted target genes, some are already known [e.g. _doc_ and _Mef2_ are known TIN targets in the cardioblast network (62)], some are present in the DroID interaction database (plain or arrowed edges) and some are new predictions (dashed edges). In conclusion, meaningful gene regulatory networks can be drawn from i-cisTarget analyses on FBbt and other sets of co-expressed genes, yielding new hypotheses on direct regulatory interactions.
Figure 5.

Direct TF-target regulatory interactions derived from FBbt gene sets. GRNs derived from i-cisTarget predictions on different TermLink gene sets. (A) Genes expressed in the Mushroom body (MB) and in Kenyon cells yield enriched motifs for three out of the six TFs annotated to be expressed in these cells, namely ey, EcR and Mef2. The network shows target genes of these three TFs in the MB and in Kenyon cells (genes expressed in Keynon cells are represented as darker nodes). (B–C) Similar analysis for genes expressed in cardioblasts (B) and pericardial cells (C). These networks show clear differences between cardioblasts and pericardial cells in terms of TF-target interactions. Tinman and MEF2 are involved in both networks (these TFs are expressed in both cell types, and the iVE and/or motifs are found for both sets), while the other TFs are specific for one cell type (hth, Doc2 and Antp are expressed in cardioblasts where their motifs are found enriched). For all these networks, TFs are represented by diamonds and have a thick edge when their motifs and/or iVE have been found enriched by i-cisTarget. Arrows represent an interaction that could be positive or negative. Colours represent the type of feature found representative by i-cisTarget, blue for a motif, green for an iVE (ChIP data set for that TF) and red for both at the same time. The type of edge represents whether it is a new TF–gene interaction prediction (dashed), a known ‘TF–gene’ interaction [from DroID (73)], or a known ‘genetic interaction’ (DroID).
Comparison with previous methods
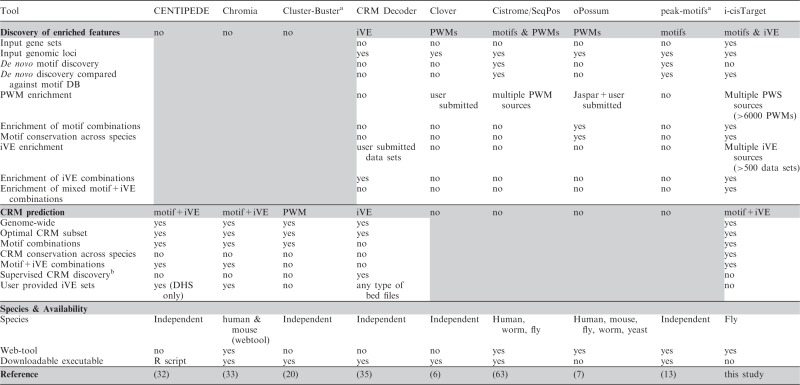
In Table 2, we have selected a number of previously published tools, representing a broad spectrum of approaches in the domain of _cis-_regulatory analysis. While we have tried to make this selection as unbiased as possible, it is by far not exhaustive, and some tools are representatives of a whole class of comparable tools (in their scope, but not necessarily in their performance). For example, peak-motif was chosen as a representative tool for many motif-discovery tools in ChIP datasets. Several important distinctions can be made between these tools; for example, some tools are designed for feature extraction from a set of regions or genes [Clover (6), peak-motifs (13), Cistrome/SeqPos (63)], while other tools focus on CRM predictions using a learning approach based on mixture models [CENTIPEDE (32), Chromia (33)] or a statistical criterion based on local motif clustering [Cluster-Buster (20)]. Another distinction that can be made is the type of features considered. Some tools are only based on motif discovery or enrichment, while more recent ones take advantage of chromatin features like histone modification or chromatin structure. We have shown that i-cisTarget combines these different aspects: it includes both motifs and iVEs, extracts enriched features in a given dataset and predicts potential CRMs based on these identified features. In our opinion, the closest matching tool is CRMDecoder (35), which also provides feature extraction and CRM prediction abilities, and can incorporate any type of chromatin feature or annotations in bed format, provided by the user. Two noticeable differences with i-cistarget are: (i) CRMDecoder does not include TF motifs for CRM predictions; and (ii) CRMDecoder only analyses sets of genomic loci and not co-expressed gene sets. We thus restricted the comparison of both tools to genomic loci, using iVEs extracted from modEncode, including DHS data from the BDTNP project. Since CRMDecoder does not take motifs into account, we applied it to the HSF and MEF2 datasets described previously consisting of truly bound regions, pooled with unbound regions containing the motif, asking to what extend these two classes of regions could be discriminated by iVEs.
Table 2.
Comparison of i-cisTarget with previous methods
On the MEF2 dataset, which consists of 8009 bound and 7045 unbound regions (called ‘training set’), CRMDecoder selects 210 significant features, and identifies 3622 CRMs of which 1933 intersect with 6761 regions in the training set; 5306 of these 6761 regions are MEF2-bound regions (PPV = 79%). i-cisTarget on the other hand selects 19 significantly enriched iVEs with NES score > 4. The top ranking iVE (BDTNP-DHS-stg11) selects 1841 regions that intersect 3313 regions of the training set, and 3119 of these are MEF2-bound regions (PPV = 94%).
On the HSF dataset consisting of 422 bound and 708 unbound regions, CRMDecoder identified DHS in Kc167 and S2 cells and Adult male and female CBP as the top ranking features (highest CCD score) is a list of 76 significant features (out of 369 features). Using these significant features, CRMDecoder predicted 2553 CRMs of which 324 overlap 388 of the training regions. Of these 388 regions, 307 are bound by HSF in vivo, hence a PPV of 79%. On the same dataset, i-cistarget identified 17 iVE with a NES score >4, among which Adult and Pupae CBP (rank 1,2,3), Kc167 and S2 DHS, as well as PolII. The top ranking feature (AdultMale CBP) selects 238 high ranking regions, which overlap 238 of the training regions, with 201 of these being bound, thus a PPV of 84%. While the PPVs of both tools are comparable in the latter case, it is important to note that i-cisTarget achieves this result using one single feature. Taking advantage of the ability of our tool to easily combine features, we can combine AdultMale_CBP with hypersensitive regions in S2 cells; this combination now achieves a PPV of 90%, hence a significant increase over the single feature. This comparative study shows that i-cisTarget is the only method that combines iVE discovery, motif discovery and CRM prediction and that i-cisTarget outperforms existing tools when overlapping functionalities are compared.
DISCUSSION
The last 15 years many bioinformatics methods and tools have been developed for _cis_-regulatory sequence analysis (64). Broadly, they can be divided in two categories. The first category is methods for motif discovery on a set of co-regulated sequences, such as MEME-like approaches (dozens of methods and extensions exist). The second category are methods for CRM prediction through whole-genome scanning using one or more known motifs as input, often using Hidden Markov Models and sequence conservation cues [see (65) for a review]. A few methods, such as phylCRM/Lever, ModuleMiner and cisTargetX combine both approaches and show increased motif discovery performance, even when very large upstream regions and introns are included in the analysis (28,30,31). The concept of these integrative methods is to apply genome-wide CRM scoring, including comparative genomics cues, for many different models (e.g. PWMs), followed by the identification of those particular models that yield the highest accuracy on a set of co-expressed genes. In this work we have introduced three important novelties into a new method, called i-cisTarget. The first is the a priori determination of 136K regions to be scored, which leads to an increased flexibility. In particular, this partitioning of the genome allows to analyse both data sets of genomic loci (by selecting all 136K regions that overlap these loci) and co-expressed gene sets (by selecting all 136K regions that fall in the upstream and intronic space of all genes in the set). In this study we obtained good results for a genome segmentation using sequence conservation (phastCons) combined with insulator sites, and excluding coding exons. However, we envision that improvements can be made on the genome segmentation, for example by including coding exons (66) or using a segmentation that is guided by the high-throughput data sets (i.e. the iVEs) themselves. The latter can become practical as more and more data sets are generated with overlapping results, which may ultimately converge to a defined set of regulatory regions. The second novelty is the generalization of regulatory feature discovery, with the possibility to identify enriched motifs (as PWMs) but also enriched iVEs such as ChIP-peaks, and active/repressive chromatin marks. The third novelty is the ability to perform any combination of regulatory features, even across different types of features (e.g. a motif with a ChIP or DHS feature).
Taken together, these features allow analysing most kinds of high-throughput data available in Drosophila, and to combine several analyses using the same tool for different datasets. For example, it is possible to combine the analysis of binding location data for a particular factor (ChIP) with the analysis of the corresponding expression data in mutant conditions for this factor, as we have shown for MEF2 (57) and Zelda (48,56).
We have applied our tools on various datasets, distinguishing gene sets from sets of genomic loci. For gene sets, we have shown that i-cisTarget identifies the enrichment of the correct motif in most gene sets we investigated; failures to do so might be explained by the specificity of the binding motif to certain conditions or tissues. Enriched iVEs can lead to interesting new hypotheses, such as the co-operation between daughterless and Medea, inferred from the PNC set analysis, that resembles the recent discovery of Smad co-operation with master regulators (53); or the prediction of new TF-target and TF-TF interactions across cell types in Drosophila, as was demonstrated for Kenyon cells, pericardial cells and cardioblasts (Figure 5). Moreover, the discovered motifs lead to CRM predictions in the 5 kb + 5′-UTR + first intron of the input genes that have a high specificity to be regulatory regions, as was demonstrated on the zelda LOF dataset (56) and the PNC dataset (51). A current limitation of i-cisTarget, when analysing gene sets, is the arbitrary assignment of genomic regions to the gene set. Multiple demarcations are available at the i-cisTarget web tool, for example [5-kb upstream limited to upstream gene, 5′-UTR, and first intron] or [10-kb upstream limited, 5′-UTR, all introns, 3′-UTR and 10-kb downstream limited to downstream gene] (see ‘Materials and Methods’ section). A future challenge remains identifying very distal enhancers and enhancers overlapping the coding sequence of nearby genes (66). A simple extension of the sequence search space, including more sequence and including intronic and exonic sequences from neighbouring genes, will not solve the problem. Indeed, when applying i-cisTarget to 100-kb upstream and downstream sequence of the TSS (this search space includes 100% of REDfly CRMs), without truncating this sequence at neighbouring genes, the performance drops dramatically (see Supplementary Figure S2).
We also used several ChIP datasets to investigate the performance of i-cisTarget on sets of genomic loci. Here, as for the gene sets, i-cisTarget performs very well in recovering the expected motif from a comprehensive library of motifs, but also highlights the involvements of other factors, such as Zelda or Trl in embryonic datasets. While motif discovery or enrichment is also performed by several other tools (45,67), i-cisTarget adds the possibility to search for additional iVEs. We have shown that a TF-binding site (TFBS) does not necessarily correspond to a binding event. While potential binding sites for HSF or MEF2 cannot be distinguished from actual binding events based on motif enrichment alone, adding iVEs clearly selects marks typical for active chromatin as the best discriminant between actually bound or unbound sites. We emphasize that this result is obtained ab initio, without any prior knowledge of which are the relevant iVEs. Hence, additional signals are needed for a TF to bind to a motif sequence, and these are often related to marks of open or active chromatin: DNAse hypersensitive sites, binding of pioneering factors such as Trl or Zelda, whose role as a general precursor of chromatin opening has only very recently been hypothesized (48). Interestingly, while in both HSF and Mef2 cases, the bound motifs present an enrichment for active features (GAF/Trl, CBP/p300, or DHS), the pattern of enriched features for unbound motifs is quite different. Namely, the unbound MEF2 motifs present an enrichment for repressive chromatin marks [Su(HW) or heterochromatin like features], while the unbound HSF motifs do not present any of these marks, consistent with what was reported in Guertin et al. (44). This might suggest a distinct mechanism of negative regulation through chromatin conformation between developmental processes and stress response pathways.
A feature of our approach that is not found in alternative studies is the ability to easily combine any number of features to investigate the synergistic effect of different features. Being based on ranks, using OS allows an ‘on-the-fly’ re-ranking of the 136K regions using particular combinations. We showed on the PNC and zelda gene set that combinations of PWM and iVE yield higher 1%-AUCs meaning a much higher specificity in the high ranking regions (Figure 4). This last result shows that transcriptional regulation is not a linear process, in the sense that the contributions of the combination of regulatory features is more than the addition of individual contributions, revealing a synergistic mechanism of action. Moreover, the fact that many different regulatory features are found enriched in the datasets we have studied previously confirms that transcriptional regulation is intrinsically a highly combinatorial process.
These two aspects (combinations and synergy) have already been extensively described before in the context of the enhanceosome model of regulation (68,69). In particular, in Drosophila, analysis of a collection of curated CRMs showed that they are typically characterized by a combination of different TFBSs (70,71). This heterotypic model has been shown to be the general rule, while homotypic CRMs are generally restricted to early embryogenesis (71).
However, these descriptions focused on combinatorial regulation by TFs alone. Here, we have confirmed recent evidence that this combinatorial regulation extends to other kinds of regulatory features such as histone modifications, binding of chromatin-modifying proteins or transcriptional co-factors such as CBP. Hence, we propose that the notion of heterotypic model of regulation should be extended to describe any combination of regulatory features, including motifs and chromatin-related features. Similarly to the CRM finding procedure consisting of finding clusters of TFBS for different TFs (26), we introduce and show that searching for ‘clusters’ of regulatory features can improve the predictive power of regulatory sequence analysis.
While our method currently applies to Drosophila, it can in principle be extended to any other organism for which large-scale collections of in vivo datasets are available, and in particular to human. The much greater size of non-coding regions in human, and the lower proportion of functional DNA in the human genome (72), would however require to pre-select candidate regulatory regions, as using a full partition of the complete non-coding genome would become computationally untractable and would contain too high noise levels. We are currently working on implementing i-cisTarget for human, using the collection of ENCODE datasets.
SUPPLEMENTARY DATA
Supplementary Data are available at NAR Online: Supplementary Table 1, Supplementary Figures 1–7, Supplementary Materials and Methods and Supplementary Note 1.
FUNDING
Research Foundation Flanders (FWO) [G.0704.11N]; University of Leuven [CREA/10/014, PF/10/016]; Human Frontiers Science Program (HFSP) [RGY0070/2011]; Foundation Against Cancer [2010-154 to SA]; CH is ANR partner of the ERASysBio+ initiative under the EU ERA-NET Plus scheme in FP7. BvdS is funded by a fellowship from Vlaamse Liga tegen Kanker. Funding for open access charge: Research Foundation Flanders [G.0704.11N] and ANR-ERASysBio+.
Conflict of interest statement. None declared.
Supplementary Material
Supplementary Data
ACKNOWLEDGEMENTS
The authors thank Serge Plaza, Morgane Thomas-Chollier, Klaas Vandepoele and Jacques van Helden for insightful comments on the manuscript. We are grateful to FlyFactorSurvey Database, FlyBase, E. Furlong, BDTNP, and modEncode for making their data sets publicly available.
REFERENCES
- 1.Park PJ. ChIP-seq: advantages and challenges of a maturing technology. Nat. Rev. Genet. 2009;10:669–680. doi: 10.1038/nrg2641. [DOI] [PMC free article] [PubMed] [Google Scholar]
- 2.Song L, Zhang Z, Grasfeder LL, Boyle AP, Giresi PG, Lee B-K, Sheffield NC, Gräf S, Huss M, Keefe D, et al. Open chromatin defined by DNaseI and FAIRE identifies regulatory elements that shape cell-type identity. Genome Res. 2011;21:1757–1767. doi: 10.1101/gr.121541.111. [DOI] [PMC free article] [PubMed] [Google Scholar]
- 3.Wang Z, Gerstein M, Snyder M. RNA-Seq: a revolutionary tool for transcriptomics. Nat. Rev. Genet. 2009;10:57–63. doi: 10.1038/nrg2484. [DOI] [PMC free article] [PubMed] [Google Scholar]
- 4.Roy S, Ernst J, Kharchenko PV, Kheradpour P, Negre N, Eaton ML, Landolin JM, Bristow CA, Ma L, Lin MF, et al. Identification of functional elements and regulatory circuits by Drosophila modENCODE. Science. 2010;330:1787–1797. doi: 10.1126/science.1198374. [DOI] [PMC free article] [PubMed] [Google Scholar]
- 5.Hawkins RD, Hon GC, Ren B. Next-generation genomics: an integrative approach. Nat. Rev. Genet. 2010;11:476–486. doi: 10.1038/nrg2795. [DOI] [PMC free article] [PubMed] [Google Scholar]
- 6.Frith MC, Fu Y, Yu L, Chen J-F, Hansen U, Weng Z. Detection of functional DNA motifs via statistical over-representation. Nucleic Acids Res. 2004;32:1372–1381. doi: 10.1093/nar/gkh299. [DOI] [PMC free article] [PubMed] [Google Scholar]
- 7.Ho Sui SJ, Fulton DL, Arenillas DJ, Kwon AT, Wasserman WW. oPOSSUM: integrated tools for analysis of regulatory motif over-representation. Nucleic Acids Res. 2007;35:W245–W252. doi: 10.1093/nar/gkm427. [DOI] [PMC free article] [PubMed] [Google Scholar]
- 8.Roider HG, Manke T, O’Keeffe S, Vingron M, Haas SA. PASTAA: identifying transcription factors associated with sets of co-regulated genes. Bioinformatics. 2009;25:435–442. doi: 10.1093/bioinformatics/btn627. [DOI] [PMC free article] [PubMed] [Google Scholar]
- 9.Zambelli F, Pesole G, Pavesi G. Pscan: finding over-represented transcription factor binding site motifs in sequences from co-regulated or co-expressed genes. Nucleic Acids Res. 2009;37:W247–W252. doi: 10.1093/nar/gkp464. [DOI] [PMC free article] [PubMed] [Google Scholar]
- 10.Turatsinze J-V, Thomas-Chollier M, Defrance M, van Helden J. Using RSAT to scan genome sequences for transcription factor binding sites and cis-regulatory modules. Nat. Protoc. 2008;3:1578–1588. doi: 10.1038/nprot.2008.97. [DOI] [PubMed] [Google Scholar]
- 11.Bailey TL, Elkan C. Fitting a mixture model by expectation maximization to discover motifs in biopolymers. Proc. Int. Conf. ISMB. 1994;2:28–36. [PubMed] [Google Scholar]
- 12.Thijs G, Lescot M, Marchal K, Rombauts S, De Moor B, Rouzé P, Moreau Y. A higher-order background model improves the detection of promoter regulatory elements by Gibbs sampling. Bioinformatics. 2001;17:1113–1122. doi: 10.1093/bioinformatics/17.12.1113. [DOI] [PubMed] [Google Scholar]
- 13.Thomas-Chollier M, Herrmann C, Defrance M, Sand O, Thieffry D, van Helden J. RSAT peak-motifs: motif analysis in full-size ChIP-seq datasets. Nucleic Acids Res. 2011;40:e31. doi: 10.1093/nar/gkr1104. [DOI] [PMC free article] [PubMed] [Google Scholar]
- 14.Machanick P, Bailey TL. MEME-ChIP: motif analysis of large DNA datasets. Bioinformatics. 2011;27:1696–1697. doi: 10.1093/bioinformatics/btr189. [DOI] [PMC free article] [PubMed] [Google Scholar]
- 15.Wang Z, Zang C, Rosenfeld JA, Schones DE, Barski A, Cuddapah S, Cui K, Roh T-Y, Peng W, Zhang MQ, et al. Combinatorial patterns of histone acetylations and methylations in the human genome. Nat. Genet. 2008;40:897–903. doi: 10.1038/ng.154. [DOI] [PMC free article] [PubMed] [Google Scholar]
- 16.Kharchenko PV, Alekseyenko AA, Schwartz YB, Minoda A, Riddle NC, Ernst J, Sabo PJ, Larschan E, Gorchakov AA, Gu T, et al. Comprehensive analysis of the chromatin landscape in Drosophila melanogaster. Nature. 2011;471:480–485. doi: 10.1038/nature09725. [DOI] [PMC free article] [PubMed] [Google Scholar]
- 17.Filion GJ, van Bemmel JG, Braunschweig U, Talhout W, Kind J, Ward LD, Brugman W, de Castro IJ, Kerkhoven RM, Bussemaker HJ. Systematic protein location mapping reveals five principal chromatin types in Drosophila cells. Cell. 2010;143:212–224. doi: 10.1016/j.cell.2010.09.009. [DOI] [PMC free article] [PubMed] [Google Scholar]
- 18.Boyle AP, Song L, Lee B-K, London D, Keefe D, Birney E, Iyer VR, Crawford GE, Furey TS. High-resolution genome-wide in vivo footprinting of diverse transcription factors in human cells. Genome Res. 2011;21:456–464. doi: 10.1101/gr.112656.110. [DOI] [PMC free article] [PubMed] [Google Scholar]
- 19.MacArthur S, Li X-Y, Li J, Brown JB, Chu HC, Zeng L, Grondona BP, Hechmer A, Simirenko L, Keränen SVE, et al. Developmental roles of 21 Drosophila transcription factors are determined by quantitative differences in binding to an overlapping set of thousands of genomic regions. Genome Biol. 2009;10:R80. doi: 10.1186/gb-2009-10-7-r80. [DOI] [PMC free article] [PubMed] [Google Scholar]
- 20.Frith MC, Li MC, Weng Z. Cluster-Buster: finding dense clusters of motifs in DNA sequences. Nucleic Acids Res. 2003;31:3666–3668. doi: 10.1093/nar/gkg540. [DOI] [PMC free article] [PubMed] [Google Scholar]
- 21.Kim J, Cunningham R, James B, Wyder S, Gibson JD, Niehuis O, Zdobnov EM, Robertson HM, Robinson GE, Werren JH, et al. Functional characterization of transcription factor motifs using cross-species comparison across large evolutionary distances. PLoS Comput. Biol. 2010;6:e1000652. doi: 10.1371/journal.pcbi.1000652. [DOI] [PMC free article] [PubMed] [Google Scholar]
- 22.Sinha S, Liang Y, Siggia E. Stubb: a program for discovery and analysis of cis-regulatory modules. Nucleic Acids Res. 2006;34:W555–W559. doi: 10.1093/nar/gkl224. [DOI] [PMC free article] [PubMed] [Google Scholar]
- 23.Sinha S, Schroeder MD, Unnerstall U, Gaul U, Siggia ED. Cross-species comparison significantly improves genome-wide prediction of cis-regulatory modules in Drosophila. BMC Bioinformatics. 2004;5:129. doi: 10.1186/1471-2105-5-129. [DOI] [PMC free article] [PubMed] [Google Scholar]
- 24.Rajewsky N, Vergassola M, Gaul U, Siggia ED. Computational detection of genomic cis-regulatory modules applied to body patterning in the early Drosophila embryo. BMC Bioinformatics. 2002;3:30. doi: 10.1186/1471-2105-3-30. [DOI] [PMC free article] [PubMed] [Google Scholar]
- 25.Brody T, Yavatkar AS, Kuzin A, Kundu M, Tyson LJ, Ross J, Lin T-Y, Lee C-H, Awasaki T, Lee T, et al. Use of a Drosophila genome-wide conserved sequence database to identify functionally related cis-regulatory enhancers. Dev. Dynamics. 2012;241:169–189. doi: 10.1002/dvdy.22728. [DOI] [PMC free article] [PubMed] [Google Scholar]
- 26.Berman BP, Nibu Y, Pfeiffer BD, Tomancak P, Celniker SE, Levine M, Rubin GM, Eisen MB. Exploiting transcription factor binding site clustering to identify cis-regulatory modules involved in pattern formation in the Drosophila genome. PNAS. 2002;99:757–762. doi: 10.1073/pnas.231608898. [DOI] [PMC free article] [PubMed] [Google Scholar]
- 27.Subramanian A, Tamayo P, Mootha VK, Mukherjee S, Ebert BL, Gillette MA, Paulovich A, Pomeroy SL, Golub TR, Lander ES, et al. Gene set enrichment analysis: a knowledge-based approach for interpreting genome-wide expression profiles. PNAS. 2005;102:15545–15550. doi: 10.1073/pnas.0506580102. [DOI] [PMC free article] [PubMed] [Google Scholar]
- 28.Aerts S, Quan X-J, Claeys A, Naval Sanchez M, Tate P, Yan J, Hassan BA. Robust target gene discovery through transcriptome perturbations and genome-wide enhancer predictions in Drosophila uncovers a regulatory basis for sensory specification. PLoS Biol. 2010;8:e1000435. doi: 10.1371/journal.pbio.1000435. [DOI] [PMC free article] [PubMed] [Google Scholar]
- 29.Potier D, Atak ZK, Sanchez MN, Herrmann C, Aerts S. Using cisTargetX to predict transcriptional targets and networks in Drosophila. Methods Mol. Biol. 2012;786:291–314. doi: 10.1007/978-1-61779-292-2_18. [DOI] [PubMed] [Google Scholar]
- 30.Warner JB, Philippakis AA, Jaeger SA, He FS, Lin J, Bulyk ML. Systematic identification of mammalian regulatory motifs’ target genes and functions. Nat. Methods. 2008;5:347–353. doi: 10.1038/nmeth.1188. [DOI] [PMC free article] [PubMed] [Google Scholar]
- 31.Van Loo P, Aerts S, Thienpont B, De Moor B, Moreau Y, Marynen P. ModuleMiner - improved computational detection of cis-regulatory modules: are there different modes of gene regulation in embryonic development and adult tissues? Genome Biol. 2008;9:R66. doi: 10.1186/gb-2008-9-4-r66. [DOI] [PMC free article] [PubMed] [Google Scholar]
- 32.Pique-regi R, Degner JF, Pai AA, Gaffney DJ, Gilad Y, Pritchard JK. Accurate inference of transcription factor binding from DNA sequence and chromatin accessibility data. Genome Res. 2010;21:447–455. doi: 10.1101/gr.112623.110. [DOI] [PMC free article] [PubMed] [Google Scholar]
- 33.Won K-J, Ren B, Wang W. Genome-wide prediction of transcription factor binding sites using an integrated model. Genome Biol. 2010;11:R7. doi: 10.1186/gb-2010-11-1-r7. [DOI] [PMC free article] [PubMed] [Google Scholar]
- 34.Klepper K, Drabløs F. PriorsEditor: a tool for the creation and use of positional priors in motif discovery. Bioinformatics. 2010;26:2195–2197. doi: 10.1093/bioinformatics/btq357. [DOI] [PMC free article] [PubMed] [Google Scholar]
- 35.Kang K, Kim J, Chung JH, Lee D. Decoding the genome with an integrative analysis tool: Combinatorial CRM Decoder. Nucleic Acids Res. 2011;39:e116. doi: 10.1093/nar/gkr516. [DOI] [PMC free article] [PubMed] [Google Scholar]
- 36.Heintzman ND, Stuart RK, Hon G, Fu Y, Ching CW, Hawkins RD, Barrera LO, Van Calcar S, Qu C, Ching KA, et al. Distinct and predictive chromatin signatures of transcriptional promoters and enhancers in the human genome. Nat. Genet. 2007;39:311–318. doi: 10.1038/ng1966. [DOI] [PubMed] [Google Scholar]
- 37.Bonn S, Zinzen RP, Girardot C, Gustafson EH, Perez-Gonzalez A, Delhomme N, Ghavi-Helm Y, Wilczyński B, Riddell A, Furlong EEM. Tissue-specific analysis of chromatin state identifies temporal signatures of enhancer activity during embryonic development. Nat. Genet. 2012;44:148–56. doi: 10.1038/ng.1064. [DOI] [PubMed] [Google Scholar]
- 38.Siepel A, Bejerano G, Pedersen JS, Hinrichs AS, Hou M, Rosenbloom K, Clawson H, Spieth J, Hillier LW, Richards S, et al. Evolutionarily conserved elements in vertebrate, insect, worm, and yeast genomes. Genome Res. 2005;15:1034–1050. doi: 10.1101/gr.3715005. [DOI] [PMC free article] [PubMed] [Google Scholar]
- 39.Rosenbloom K, Taylor J, Schaeffer S, Kent J, Haussler D, Miller W. Phylogenomic resources at the UCSC Genome Browser. Meth. Mol. Biol. 2008;422:133–144. doi: 10.1007/978-1-59745-581-7_9. [DOI] [PubMed] [Google Scholar]
- 40.Kent WJ, Baertsch R, Hinrichs A, Miller W, Haussler D. Evolution’s cauldron: duplication, deletion, and rearrangement in the mouse and human genomes. PNAS. 2003;100:11484–11489. doi: 10.1073/pnas.1932072100. [DOI] [PMC free article] [PubMed] [Google Scholar]
- 41.Aerts S, Lambrechts D, Maity S, Van Loo P, Coessens B, De Smet F, Tranchevent L-C, De Moor B, Marynen P, Hassan B, et al. Gene prioritization through genomic data fusion. Nat. Biotech. 2006;24:537–544. doi: 10.1038/nbt1203. [DOI] [PubMed] [Google Scholar]
- 42.Stuart JM, Segal E, Koller D, Kim SK. A gene-coexpression network for global discovery of conserved genetic modules. Science. 2003;302:249–255. doi: 10.1126/science.1087447. [DOI] [PubMed] [Google Scholar]
- 43.Quinlan AR, Hall IM. BEDTools: a flexible suite of utilities for comparing genomic features. Bioinformatics. 2010;26:841–842. doi: 10.1093/bioinformatics/btq033. [DOI] [PMC free article] [PubMed] [Google Scholar]
- 44.Guertin MJ, Lis JT. Chromatin landscape dictates HSF binding to target DNA elements. PLoS Genet. 2010;6:e1001114. doi: 10.1371/journal.pgen.1001114. [DOI] [PMC free article] [PubMed] [Google Scholar]
- 45.Thomas-Chollier M, Defrance M, Medina-Rivera A, Sand O, Herrmann C, Thieffry D, van Helden J. RSAT 2011: regulatory sequence analysis tools. Nucleic Acids Res. 2011;39:W86–W91. doi: 10.1093/nar/gkr377. [DOI] [PMC free article] [PubMed] [Google Scholar]
- 46.Zinzen RP, Girardot C, Gagneur J, Braun M, Furlong EEM. Combinatorial binding predicts spatio-temporal cis-regulatory activity. Nature. 2009;462:65–70. doi: 10.1038/nature08531. [DOI] [PubMed] [Google Scholar]
- 47.Jakobsen JS, Braun M, Astorga J, Gustafson EH, Sandmann T, Karzynski M, Carlsson P, Furlong EEM. Temporal ChIP-on-chip reveals Biniou as a universal regulator of the visceral muscle transcriptional network. Gene Dev. 2007;21:2448–2460. doi: 10.1101/gad.437607. [DOI] [PMC free article] [PubMed] [Google Scholar]
- 48.Harrison MM, Li X-Y, Kaplan T, Botchan MR, Eisen MB. Zelda binding in the early Drosophila melanogaster embryo marks regions subsequently activated at the maternal-to-zygotic transition. PLoS Genet. 2011;7:e1002266. doi: 10.1371/journal.pgen.1002266. [DOI] [PMC free article] [PubMed] [Google Scholar]
- 49.Gonsalves SE, Moses AM, Razak Z, Robert F, Westwood JT. Whole-genome analysis reveals that active heat shock factor binding sites are mostly associated with non-heat shock genes in Drosophila melanogaster. PLoS One. 2011;6:e15934. doi: 10.1371/journal.pone.0015934. [DOI] [PMC free article] [PubMed] [Google Scholar]
- 50.Turatsinze J-V, Thomas-Chollier M, Defrance M, van Helden J. Using RSAT to scan genome sequences for transcription factor binding sites and cis-regulatory modules. Nat. Protoc. 2008;3:1578–1588. doi: 10.1038/nprot.2008.97. [DOI] [PubMed] [Google Scholar]
- 51.Reeves N, Posakony JW. Genetic Programs Activated by Proneural Proteins in the Developing Drosophila PNS. Dev. Cell. 2005;8:413–425. doi: 10.1016/j.devcel.2005.01.020. [DOI] [PubMed] [Google Scholar]
- 52.Tsurumi A, Xia F, Li J, Larson K, Lafrance R, Li WX. stat is an essential activator of the zygotic genome in the early Drosophila embryo. PLoS Genet. 2011;7:e1002086. doi: 10.1371/journal.pgen.1002086. [DOI] [PMC free article] [PubMed] [Google Scholar]
- 53.Mullen AC, Orlando DA, Newman JJ, Lovén J, Kumar RM, Bilodeau S, Reddy J, Guenther MG, DeKoter RP, Young RA. Master transcription factors determine cell-type-specific responses to TGF-β signaling. Cell. 2011;147:565–576. doi: 10.1016/j.cell.2011.08.050. [DOI] [PMC free article] [PubMed] [Google Scholar]
- 54.Ørom UA, Derrien T, Beringer M, Gumireddy K, Gardini A, Bussotti G, Lai F, Zytnicki M, Notredame C, Huang Q, et al. Long noncoding RNAs with enhancer-like function in human cells. Cell. 2010;143:46–58. doi: 10.1016/j.cell.2010.09.001. [DOI] [PMC free article] [PubMed] [Google Scholar]
- 55.Hemberg M, Kreiman G. Conservation of transcription factor binding events predicts gene expression across species. Nucleic Acids Res. 2011;39:7092–7102. doi: 10.1093/nar/gkr404. [DOI] [PMC free article] [PubMed] [Google Scholar]
- 56.Liang H-L, Nien C-Y, Liu H-Y, Metzstein MM, Kirov N, Rushlow C. The zinc-finger protein Zelda is a key activator of the early zygotic genome in Drosophila. Nature. 2008;456:400–403. doi: 10.1038/nature07388. [DOI] [PMC free article] [PubMed] [Google Scholar]
- 57.Sandmann T, Jensen LJ, Jakobsen JS, Karzynski MM, Eichenlaub MP, Bork P, Furlong EEM. A temporal map of transcription factor activity: Mef2 directly regulates target genes at all stages of muscle development. Dev. Cell. 2006;10:797–807. doi: 10.1016/j.devcel.2006.04.009. [DOI] [PubMed] [Google Scholar]
- 58.McQuilton P, St Pierre SE, Thurmond J. FlyBase 101-the basics of navigating FlyBase. Nucleic Acids Res. 2012;40:D706–D714. doi: 10.1093/nar/gkr1030. [DOI] [PMC free article] [PubMed] [Google Scholar]
- 59.Noveen A, Daniel A, Hartenstein V. Early development of the Drosophila mushroom body: the roles of eyeless and dachshund. Development. 2000;127:3475–3488. doi: 10.1242/dev.127.16.3475. [DOI] [PubMed] [Google Scholar]
- 60.Watts RJ, Hoopfer ED, Luo L. Axon pruning during Drosophila metamorphosis: evidence for local degeneration and requirement of the ubiquitin-proteasome system. Neuron. 2003;38:871–885. doi: 10.1016/s0896-6273(03)00295-2. [DOI] [PubMed] [Google Scholar]
- 61.Roignant J-Y, Treisman JE. Pattern formation in the Drosophila eye disc. Int. J. Dev. Biol. 2009;53:795–804. doi: 10.1387/ijdb.072483jr. [DOI] [PMC free article] [PubMed] [Google Scholar]
- 62.Reim I, Frasch M. Genetic and genomic dissection of cardiogenesis in the Drosophila model. Pediatr Cardiol. 2010;31:325–334. doi: 10.1007/s00246-009-9612-1. [DOI] [PubMed] [Google Scholar]
- 63.Liu T, Ortiz Ja, Taing L, Meyer CA, Lee B, Zhang Y, Shin H, Wong SS, Ma J, Lei Y, et al. Cistrome: an integrative platform for transcriptional regulation studies. Genome Biol. 2011;12:R83. doi: 10.1186/gb-2011-12-8-r83. [DOI] [PMC free article] [PubMed] [Google Scholar]
- 64.Aerts S. Computational strategies for the genome-wide identification of cis-regulatory elements and transcriptional targets. Curr. Top. Dev. Biol. 2012;98:121–145. doi: 10.1016/B978-0-12-386499-4.00005-7. [DOI] [PubMed] [Google Scholar]
- 65.Van Loo P, Marynen P, Loo PV. Computational methods for the detection of cis-regulatory modules. Brief Bioinf. 2009;10:bbp025. doi: 10.1093/bib/bbp025. [DOI] [PubMed] [Google Scholar]
- 66.Birnbaum RY, Clowney EJ, Agamy O, Kim MJ, Zhao J, Yamanaka T, Pappalardo Z, Clarke SL, Wenger AM, Nguyen L, et al. Coding exons function as tissue-specific enhancers of nearby genes. Genome Res. 2012;22:1059–1068. doi: 10.1101/gr.133546.111. [DOI] [PMC free article] [PubMed] [Google Scholar]
- 67.Bailey TL. DREME: motif discovery in transcription factor ChIP-seq data. Bioinformatics. 2011;27:1653–1659. doi: 10.1093/bioinformatics/btr261. [DOI] [PMC free article] [PubMed] [Google Scholar]
- 68.Merika M, Thanos D. Enhanceosomes. Curr. Opin. Genet. Dev. 2001;11:205–208. doi: 10.1016/s0959-437x(00)00180-5. [DOI] [PubMed] [Google Scholar]
- 69.Carey M. The enhanceosome and transcriptional synergy. Cell. 1998;92:5–8. doi: 10.1016/s0092-8674(00)80893-4. [DOI] [PubMed] [Google Scholar]
- 70.Kantorovitz MR, Kazemian M, Kinston S, Miranda-saavedra D, Zhu Q, Robinson GE, Göttgens B, Halfon MS, Sinha S. Motif-blind, genome-wide discovery of cis-regulatory modules in Drosophila and mouse. Dev. Cell. 2009;17:568–579. doi: 10.1016/j.devcel.2009.09.002. [DOI] [PMC free article] [PubMed] [Google Scholar]
- 71.Li L, Zhu Q, He X, Sinha S, Halfon MS. Large-scale analysis of transcriptional cis-regulatory modules reveals both common features and distinct subclasses. Genome Biol. 2007;8:R101. doi: 10.1186/gb-2007-8-6-r101. [DOI] [PMC free article] [PubMed] [Google Scholar]
- 72.Ponting CP, Hardison RC. What fraction of the human genome is functional? Genome Res. 2011;21:1769–1776. doi: 10.1101/gr.116814.110. [DOI] [PMC free article] [PubMed] [Google Scholar]
- 73.Murali T, Pacifico S, Yu J, Guest S, Roberts GG, Finley RL. DroID 2011: a comprehensive, integrated resource for protein, transcription factor, RNA and gene interactions for Drosophila. Nucleic Acids Res. 2011;39:D736–D743. doi: 10.1093/nar/gkq1092. [DOI] [PMC free article] [PubMed] [Google Scholar]
- 74.Portales-Casamar E, Thongjuea S, Kwon AT, Arenillas D, Zhao X, Valen E, Yusuf D, Lenhard B, Wasserman WW, Sandelin A. JASPAR 2010: the greatly expanded open-access database of transcription factor binding profiles. Nucleic Acids Res. 2009;38:D105–D110. doi: 10.1093/nar/gkp950. [DOI] [PMC free article] [PubMed] [Google Scholar]
- 75.Down TA, Bergman CM, Su J, Hubbard TJP. Large-scale discovery of promoter motifs in Drosophila melanogaster. PLoS Comp. Biol. 2007;3:e7. doi: 10.1371/journal.pcbi.0030007. [DOI] [PMC free article] [PubMed] [Google Scholar]
- 76.Elemento O, Tavazoie S. Fast and systematic genome-wide discovery of conserved regulatory elements using a non-alignment based approach. Genome Biol. 2005;6:R18. doi: 10.1186/gb-2005-6-2-r18. [DOI] [PMC free article] [PubMed] [Google Scholar]
- 77.Zhu LJ, Christensen RG, Kazemian M, Hull CJ, Enuameh MS, Basciotta MD, Brasefield JA, Zhu C, Asriyan Y, Lapointe DS, et al. FlyFactorSurvey: a database of Drosophila transcription factor binding specificities determined using the bacterial one-hybrid system. Nucleic Acids Res. 2011;39:D111–D117. doi: 10.1093/nar/gkq858. [DOI] [PMC free article] [PubMed] [Google Scholar]
- 78.Matys V, Kel-Margoulis OV, Fricke E, Liebich I, Land S, Barre-Dirrie A, Reuter I, Chekmenev D, Krull M, Hornischer K, et al. TRANSFAC and its module TRANSCompel: transcriptional gene regulation in eukaryotes. Nucleic Acids Res. 2006;34:D108–D110. doi: 10.1093/nar/gkj143. [DOI] [PMC free article] [PubMed] [Google Scholar]
- 79.Stark A, Lin MF, Kheradpour P, Pedersen JS, Parts L, Carlson JW, Crosby MA, Rasmussen MD, Roy S, Deoras AN, et al. Discovery of functional elements in 12 Drosophila genomes using evolutionary signatures. Nature. 2007;450:219–232. doi: 10.1038/nature06340. [DOI] [PMC free article] [PubMed] [Google Scholar]
- 80.Li X-yong, MacArthur S, Bourgon R, Nix D, Pollard DA, Iyer VN, Hechmer A, Simirenko L, Stapleton M, Luengo Hendriks CL, et al. Transcription factors bind thousands of active and inactive regions in the Drosophila blastoderm. PLoS Biol. 2008;6:e27. doi: 10.1371/journal.pbio.0060027. [DOI] [PMC free article] [PubMed] [Google Scholar]
- 81.Xie Z, Hu S, Blackshaw S, Zhu H, Qian J. hPDI: a database of experimental human protein-DNA interactions. Bioinformatics. 2010;26:287–289. doi: 10.1093/bioinformatics/btp631. [DOI] [PMC free article] [PubMed] [Google Scholar]
- 82.de Boer CG, Hughes TR. YeTFaSCo: a database of evaluated yeast transcription factor sequence specificities. Nucleic Acids Res. 2012;40:D169–D179. doi: 10.1093/nar/gkr993. [DOI] [PMC free article] [PubMed] [Google Scholar]
- 83.Kurusu M, Nagao T, Walldorf U, Flister S, Gehring WJ, Furukubo-Tokunaga K. Genetic control of development of the mushroom bodies, the associative learning centers in the Drosophila brain, by the eyeless, twin of eyeless, and Dachshund genes. Proc. Natl Acad. Sci. USA. 2000;97:2140–2144. doi: 10.1073/pnas.040564497. [DOI] [PMC free article] [PubMed] [Google Scholar]
Associated Data
This section collects any data citations, data availability statements, or supplementary materials included in this article.
Supplementary Materials
Supplementary Data