Identification of Akt-independent Regulation of Hepatic Lipogenesis by Mammalian Target of Rapamycin (mTOR) Complex 2 (original) (raw)
Background: mTORC2 is an insulin-stimulated kinase that activates kinases such as Akt.
Results: Hepatic mTORC2 deletion increased glucose output dependent on Akt-FoxO and blocked lipogenesis that was not restored by activation of Akt-FoxO signaling.
Conclusion: mTORC2-dependent factors other than Akt are critical for hepatic lipogenesis.
Significance: Understanding signals separating hepatic glucose output from lipogenesis is crucial for effective diabetes treatment.
Keywords: Akt, Gluconeogenesis, Insulin, Lipogenesis, Liver Metabolism, mTOR Complex (mTORC), mTOR Complex 2 (mTORC2)
Abstract
Mammalian target of rapamycin complex 2 (mTORC2) is a key activator of protein kinases that act downstream of insulin and growth factor signaling. Here we report that mice lacking the essential mTORC2 component rictor in liver (LrictorKO) are unable to respond normally to insulin. In response to insulin, LrictorKO mice failed to inhibit hepatic glucose output. LrictorKO mice also fail to develop hepatic steatosis on a high fat diet and manifest half-normal serum cholesterol levels. This is accompanied by lower levels of expression of SREBP-1c and SREBP-2 and genes of fatty acid and cholesterol biosynthesis. LrictorKO mice had defects in insulin-stimulated Akt Ser-473 and Thr-308 phosphorylation, leading to decreased phosphorylation of Akt substrates FoxO, GSK-3β, PRAS40, AS160, and Tsc2. LrictorKO mice also manifest defects in insulin-activated mTORC1 activity, evidenced by decreased S6 kinase and Lipin1 phosphorylation. Glucose intolerance and insulin resistance of LrictorKO mice could be fully rescued by hepatic expression of activated Akt2 or dominant negative FoxO1. However, in the absence of mTORC2, forced Akt2 activation was unable to drive hepatic lipogenesis. Thus, we have identified an Akt-independent relay from mTORC2 to hepatic lipogenesis that separates the effects of insulin on glucose and lipid metabolism.
Introduction
mTOR exists in two functionally and structurally distinct protein complexes. mTOR complex 2 (mTORC2)2 corresponds to the hydrophobic motif kinase of Akt (1) and other AGC family protein kinases such as serum and glucocorticoid-induced kinase (Sgk) and protein kinase C (PKC) (2–5). Thus, mTORC2 has been implicated in insulin signaling and is poised to regulate multiple metabolic and physiologic processes.
Targeted deletion of mTORC1 and mTORC2 subunits in mice has expanded our understanding of the complex roles for mTOR in mammalian metabolism. Fat, muscle, and pancreatic β cell-specific Raptor (mTORC1) and Rictor (mTORC2) knock-out mice indicate a role for both complexes in insulin signaling and production (6–10). The liver is an important site of mTOR action, as modulation of mTORC1 in liver leads to alteration in fatty acid oxidation, synthesis, and ketone body production (11, 12).
The serine/threonine protein kinase Akt (also known as PKB) is critical for transduction of insulin and growth factor signaling downstream of PI3-kinase (13). Mammals possess three Akt isoforms. Akt2 is the major hepatic isoform involved in insulin action in the liver (14, 15). Akt is central to the ability of insulin to inhibit gluconeogenesis and stimulate hepatic lipogenesis (15, 16). Knock-out of Akt2 in liver impairs insulin action on glucose and lipid homeostasis (15), and human loss-of-function mutations in Akt2 lead to insulin-resistant diabetes mellitus (17). Conversely, expression of constitutively active Akt in liver mimics enhanced insulin action including decreased hepatic glucose output and stimulation of hepatic lipogenesis (16) and activating mutations in human Akt2 produce hypoglycemia (18). These effects are in large part due to the ability of Akt to phosphorylate and inhibit FoxO family transcription factors that stimulate gluconeogenic gene expression via the transcriptional coactivator PGC-1α (19–21). Hepatic knock-out of Akt1 and Akt2 manifests severe hepatic insulin resistance and increased hepatic glucose output; concomitant hepatic deletion of FoxO1 ameliorates these effects (22).
Conversely, Akt may affect lipid metabolism in liver in a FoxO-independent manner (23). The ability of Akt to potently stimulate hepatic lipogenesis in liver is partially dependent upon the transcription factor SREBP-1c (16) and more largely dependent upon mTORC1 signaling through the fld gene product Lipin1 (11, 12, 24, 25). Although mTORC1 deficiency in liver mitigates insulin-stimulated hepatic lipogenesis, activation of mTORC1 alone is not sufficient to drive lipogenesis (12, 23).
Global knock-out of mTORC2 components leads to embryonic lethality (2, 3, 5). Here, we report deletion of the essential mTORC2 subunit rictor specifically in liver. Liver rictor knock-out (LrictorKO) mice are insulin-resistant, indicating a critical role for hepatic mTORC2 in whole body glucose metabolism. LrictorKO mice are defective in hepatic lipogenesis, fail to develop a fatty liver on a high fat diet, and manifest decreased SREBP-1c transcription. We observed a 2-fold lowering of serum cholesterol levels in LrictorKO mice and decreased transcription of SREBP-2 and the genes involved in cholesterol synthesis. LrictorKO mice show decreased insulin-stimulated phosphorylation of p70 S6 kinase and Lipin1 by mTORC1. Glucose intolerance in LrictorKO mice is suppressible by hepatic expression of activated Akt2 or dominant negative FoxO, indicating a critical role of the Akt-FoxO axis in glycemic effects of insulin mediated through mTORC2 signaling (15, 19). Surprisingly, hepatic lipogenesis is unable to be stimulated by activated Akt2 or dominant negative FoxO in LrictorKO mice, suggesting the presence of Akt-independent signaling steps activated by mTORC2 necessary for the full scope of insulin action. Thus, mTORC2 is the most proximal step in cellular signaling separating the effects of insulin on glucose and lipid homeostasis and uncouples Akt actions on glucose and lipid metabolism.
EXPERIMENTAL PROCEDURES
Animals
Mice carrying a conditional rictor allele (_rictor_[loxP/_loxP_]) served as controls in all experiments for LrictorKO mice (_rictor_[_loxP/loxP_];_Alb_-Cre). Liver-specific rictor knock-out mice were obtained by crossing _rictor_[loxP/_loxP_] mice (ricEx3cond/ricEx3cond, obtained from the mutant mouse regional resource center) and albumin-Cre (Jackson Labs), through male mice. Both lines were a minimum of 8 × backcrossed to C57BL/6. Mice were maintained in central ventilated cages in a barrier facility with 12-h light cycle control and free access to food and water. Mice were put on both standard chow diet (CHOW) (5008, Labdiets) or 60% kcal-fat high fat diet (HFD) (D12492; Research Diets) at weaning at 4 weeks of age. Groups of mice were caged individually at 5 weeks for longitudinal body mass and food intake measurements. Separate groups were caged in groups of 4–5 for metabolic studies. Glucose and insulin tolerance testing and hyperinsulinemic, euglycemic clamp were conducted as described previously (26) with doses indicated after 20 weeks of age. All animal procedures were approved by Massachusetts General Hospital Subcommittee on Research Animal Care.
Western Blotting
Radioimmune precipitation assay lysates were prepared from insulin-stimulated tissues (vehicle injected or 7 and 15 min after 3 units/kg insulin intraperitoneal injection) with protease and phosphatase inhibitors. Antibodies were obtained from Cell Signaling Technology except goat anti-rabbit-HRP conjugate (used at 1:5000 in TBST, from GE Healthcare), and immunoblots were carried out according to the manufacturer's protocols. HRP was detected using West-Pico chemiluminescence substrate (Thermo Pierce).
Biochemical and Hormone Assays
Glucose was measured with a glucometer specifically designed for mouse (AlphaTrak, Abbott Animal Health). Insulin (Crystal Chemical Company), triglyceride (Thermo), total cholesterol (Thermo), HDL (Pointe Scientific LDL/VLDL precipitating agent), and ketones (Cayman Chemical) were measured according to manufacturers' protocols. Tissue cholesterol and triglyceride contents were measured enzymatically (Thermo) following Folch extraction, and lipid mass was normalized to tissue weight and/or protein content.
Quantitative Real-time PCR
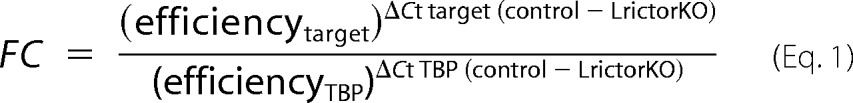
cDNA synthesized from 25 ng of input total RNA made with the RNAqueous-4PCR kit (Ambion) using the Qiagen Quantiscript kit was used for input in each qRT-PCR. We used the 2 × SYBR Green Supermix (Bio-Rad) in a Bio-Rad CFX 96 system using 0.4 μm custom primers (see supplemental Table S1 for primer sequences and amplicon data). All amplifications were performed in parallel with control TBP (TATA-binding protein) primers, and results were normalized to TBP expression across samples using the ΔΔ_C_t method and calculated primer efficiencies. -Fold change (FC) is calculated as follows.
Hepatic Expression of Activated Akt2 and Dominant Negative FoxO Proteins
Activated Akt2 (activAkt) and dominant negative (DN) FoxO1 were delivered to the liver by adenoviral transduction. Both N-terminally myristoylated and C-terminal hemagglutinin-tagged Akt2 with mutation of hydrophobic motif serine to glutamate, and C-terminally myc-tagged and truncated FoxO1 cDNA (myc-tagged Δ256), or control LacZ was recombined into pAd-CMV, virus was generated per the manufacturer's instructions with the ViraPower system (Invitrogen) and purified to high titer with cesium chloride gradients (27, 28). FoxO-DN is predicted to act against FoxO family members FoxO1, 3a, and 4. Six- to 9-month-old Rictor conditional (flox/flox) or LrictorKO animals fed chow diet were injected via tail vein with 1 × 10¹⁰ pfu/kg LacZ, FoxO-DN, or activAkt, and allowed to recover for 7 days before an intraperitoneal glucose challenge was performed as above. Blood was collected at day 9 after transduction for determination of serum insulin and glucose levels. Animals were sacrificed at 10 days for determination of liver weight, triglyceride, and cholesterol content.
Acute Rictor and Raptor Knockdown
Lentiviral delivery was used to stably transduce HepG2 C3A cells with shRNA constructs corresponding to human Rictor, Raptor, or control (red fluorescent protein). Constructs based in pLKO1 were obtained from the Broad Institute of Harvard and MIT RNAi platform and are commercially available from Sigma. One multiplicity of infection of each virus was used to transduce cells for 30 min in 8 μm Polybrene (Sigma) in full medium (high glucose DMEM plus pyruvate with 10% serum, penicillin, and streptomycin). After 30 min, virus was removed and fresh medium added. After 24 h cells were transferred to full medium with 2 μg/ml puromycin (Sigma) for selection of stable transduction and knockdown. Knockdown was confirmed after expanding selected cells by Western blotting. Cells were maintained after initial 3-day selection in 0.5 μg/ml puromycin.
FoxO Luciferase Reporter Assays
HepG2 cells stably knocked down with control shRNA or shRNA corresponding to Rictor or Raptor were reverse transfected in 96-well optical plates (Perkin-Elmer Life Sciences) by adding 0.6 μl of Lipofectamine 2000 (Invitrogen) to 100 ng of a 40:1 mixture of 6 × FoxO response element firefly luciferase reporter and a CMV promoter driven Renilla luciferase to control for transfection efficiency and cell viability (Cignal FoxO Assay;Qiagen) and 200 ng of human FoxO1 (FLAG®-FKHR, Addgene plasmid 13507) (29) in 50 μl total volume of Opti-MEM without serum or antibiotics (Invitrogen). As a control, a separate set of wells were transfected with 100 ng of reporter mixture plus 200 ng of CMVp::EGFP (Addgene plasmid 13031). After 30 min of incubation, 30,000 freshly trypsinized cells were added in 100 μl of Opti-MEM (Invitrogen) containing 5% fetal bovine serum without antibiotics. After 24 h, medium was removed and replaced with 50 μl of d-PBS, and firefly and Renilla luciferase assays were serially performed using the Dual-GLO assay at room temperature according to the manufacturer's instructions (Promega). FoxO activity is expressed as the normalized ratio of firefly luciferase (activated by 6 × FoxO response elements) to Renilla luciferase (constitutive CMV promoter) activity.
Statistical Analysis
Data are presented as means ± S.E. Unpaired, equal variance, two-tailed Student's t tests were used for statistical analysis (Bonferroni-corrected for multiple hypothesis testing when appropriate) unless otherwise noted. p < 0.05 was considered significant.
RESULTS
Glucose Intolerance and Insulin Resistance in Hepatic mTORC2 Knock-out Mice
We used albumin promoter-driven Cre recombinase (30) to delete rictor in liver using a conditional allele (31). Fasting glucose levels of LrictorKO are unchanged compared with control mice (Fig. 1A). However, serum insulin levels were 2-fold higher in LrictorKO mice (Fig. 1B), and pancreatic islets were enlarged (Fig. 1H) indicating insulin resistance and a compensatory increase in insulin production and secretion. An intraperitoneal glucose challenge indicated glucose intolerance in LrictorKO mice fed a chow diet (Fig. 1C). Glucose intolerance of LrictorKO mice was exaggerated by HFD feeding (Fig. 1D). Confirming insulin resistance, both chow- and HFD-fed LrictorKO mice were resistant to insulin tolerance testing (Fig. 1, E and F). Both phase 1 and phase 2 insulin secretion in LrictorKO mice following glucose challenge were more than double controls, demonstrating that knock-out mice secreted insulin exuberantly in response to glucose (Fig. 1G). Despite the doubled insulin concentration, knock-out mice were unable to maintain normoglycemia after a glucose load (Fig. 1, C and D).
FIGURE 1.

Liver rictor deletion leads to glucose intolerance and insulin resistance. A and B, fasting glucose levels and insulin levels. Six-month-old group-caged, ad libitum chow-fed littermates (flox/flox, n = 11; and LrictorKO, n = 9) were fasted overnight. C and D, glucose tolerance tests were performed after intraperitoneal glucose (1.0 mg/kg) injection in 28-week-old single-caged LrictorKO (n = 10) and flox/flox controls (n = 10) fed either chow diet or 60% kcal HFD. E and F, insulin tolerance test of 30-week-old LrictorKO and control mice with regular human insulin (Lily) at 0.4 unit/kg intraperitoneally for mice fed chow (E) and 0.75 unit/kg intraperitoneally for mice fed HFD (F). G, glucose-stimulated insulin secretion during glucose tolerance test (1.0 g/kg glucose intraperitoneally), n = 7 for each group. H, hematoxylin and eosin-stained sections of LrictorKO mice fed HFD showing greater enlargement of pancreatic islets than control mice (arrowheads). Three mice were examined for each genotype and representative sections are shown. I–L, glucose turnover and gene expression in hyperinsulinemic euglycemic clamp study of LrictorKO and control mice (n = 6 for each group). I, basal hepatic glucose production (BHGP) and clamp hepatic glucose production (CHGP). J, whole body glucose uptake (rate of disappearance, Rd), and glucose infusion rate (Ginf) during clamp. K, whole body glycolysis (Gly) and glycogen synthesis (GS). L, gene expression of key gluconeogenic genes PGC-1α and glucose-6-phosphatase (G6P) after hyperinsulinemic euglycemic clamp study. Error bars, mean ± S.E. *, p < 0.05; **, p < 0.01. AUC, area under the curve.
To pinpoint the site of insulin resistance, LrictorKO and control mice were subjected to hyperinsulinemic-euglycemic clamp, where animals are held at a fixed, supraphysiologic insulin level and glucose is infused adjustably to maintain normoglycemia. At base line, prior to clamp, hepatic glucose production was equivalent between controls and knock-out mice (Fig. 1I). Upon hyperinsulinemic clamp, LrictorKO mice failed to suppress hepatic glucose production, where control animals lowered production to 20% of pre-clamp values (Fig. 1I), and the rate of glucose infusion needed to maintain normoglycemia in LrictorKO mice was half that needed to maintain glycemia in control mice (Fig. 1J). Rates of whole body glucose disposal, glycolysis, and glycogen synthesis did not differ between knockouts and controls (Fig. 1K). Further, we found higher expression of PGC-1α and the key gluconeogenic enzyme glucose-6-phosphatase in liver of LrictorKO mice under insulin clamp (Fig. 1L).
Decreased Triglycerides, Cholesterol, and Lower SREBP-1c and SREBP-2 mRNA in LrictorKO Mice
Given that insulin signaling stimulates hepatic lipogenesis, we examined lipid levels in LrictorKO mice fed chow and HFD. We noted marked improvement in hepatic steatosis in LrictorKO mice versus control, and hepatic triglyceride content was reduced in LrictorKO mice fed both chow and HFD (Fig. 2A). Tissue cholesterol levels in LrictorKO mice trended lower but were not significantly different from control mice (Fig. 2B). The decrease in hepatic triglyceride was corroborated at the histologic level by absence of intracellular lipid droplets in LrictorKO mice fed HFD (Fig. 2C). Lower triglyceride mass in LrictorKO liver was accompanied by suppression of mRNAs encoding SREBP-1c, acetyl-CoA-carboxylase, fatty acid synthase, stearoyl-CoA-desaturase-1, and cytosolic malic enzyme in LrictorKO livers (Fig. 2D). We confirmed decreased protein expression of acetyl-CoA-carboxylase, the rate-limiting enzyme in fatty acid biosynthesis, by Western blotting (Fig. 2E). A decrease in serum triglycerides was seen in HFD-fed LrictorKO mice and a corresponding increase in serum ketones (Fig. 2F). As insulin normally suppresses ketogenesis, this is another indication of hepatic insulin resistance.
FIGURE 2.

Rictor deletion in liver inhibits lipid and cholesterol synthesis via SREBP-1c and SREBP-2, respectively. A and B, intrahepatic tissue triglyceride (TG) and cholesterol levels. C, hematoxylin and eosin stain of liver of 6-month-old LrictorKO and control mice fed HFD from weaning indicating failure to develop steatosis with loss of mTORC2. D, Rictor deletion inhibiting hepatic expression of SREBP-1c and the program of genes involved in unsaturated fatty acid synthesis. Data are expressed in relative abundance to flox/flox chow-fed mice, normalized to the abundance of TBP RNA. E, acetyl-CoA-carboxylase (ACC) protein levels shown decreasing in parallel with mRNA levels in LrictorKO liver by Western blotting (WB). F, circulating triglyceride, ketone body (β-hydroxybutyrate), total cholesterol, and HDL cholesterol levels in chow- and HFD-fed LrictorKO and control mice. G, hepatic expression of genes that orchestrate cholesterol synthesis and homeostasis reduced by rictor deletion in liver. Error bars, mean ± S.E. *, p < 0.05; **, p < 0.01.
Serum total cholesterol levels and HDL were reduced ∼50% in LrictorKO mice, irrespective of diet (Fig. 2F). Measurement of mRNAs for genes involved in sterol production or clearance indicated that SREBP-2, the master transcriptional regulator of cholesterol biosynthesis, was down-regulated along with a program of cholesterol biosynthetic genes (Fig. 2G). mRNA for apolipoprotein B, a major protein constituent of LDL cholesterol, was reduced in the liver of LrictorKO mice, as was mRNA for the LDL receptor, both targets of SREBP-2 (32, 33) (Fig. 2G). It is not clear why tissue cholesterol levels are preserved in LrictorKO mice despite lower serum cholesterol levels (Fig. 2B). It is possible that the relatively small pool of tissue cholesterol is not reflective of synthetic rates or that tissue levels change to a lesser extent than serum levels due to altered lipoprotein metabolism. Overall, these data indicate that hepatic mTORC2 knock-out leads to decreased serum cholesterol levels and suppression of SREBP-2 transcription and activity. Despite suppressed hepatic lipogenesis, LrictorKO and control mice had equivalent body mass and food intake to 30 weeks of age when fed either chow or HFD (60% kcal-fat) (Fig. 3).
FIGURE 3.

Body mass and food intake of control and LrictorKO mice fed chow and HFD. A, longitudinal body mass measurements made at the same time in the light cycle each day, three times per week, for singly caged, chow-fed animals up to 32 weeks of age. No significant differences were evident between groups. B, food intake of individual animals fed chow diet. C and D, longitudinal body mass and food intake of animals fed HFD. No difference was seen between groups. Error bars, mean ± S.E.
Biochemical Defects in Insulin Signaling in LrictorKO Mice
Rictor protein was not detected by Western blotting in the liver of LrictorKO mice tested between 12 and 36 weeks (Fig. 4A). We noted markedly lower total mTOR levels in LrictorKO livers, despite normal Raptor levels (Fig. 4A).
FIGURE 4.

Requirement of Rictor for normal hepatic insulin signal transduction. A, lysates from livers of 12-week-old LrictorKO and control mice were blotted for Rictor, mTOR and Raptor. B and C, livers were collected at 7 and 15 minutes after intraperitoneal insulin (3 units/kg) or vehicle injection in 24-week-old chow- or HFD-fed mice. The results shown are representative of four sets of immunoblots, n = 4 mice analyzed for each condition and time point. B, Akt phosphorylation was eliminated at Ser-473 and blunted at Thr-308 by liver-specific rictor deletion. Total PDK levels were preserved. PKC phosphorylation at the HM site Ser-660 was reduced. C, decreased Akt activation in LrictorKO mice was evident by lower phosphorylation of phospho-FoxO-T32, phospho-PRAS40-T246, phospho-AS160-T642, phospho-TSC2-T1462, and phospho-GSK3β-S9. D, FoxO transcriptional activity was measured by a FoxO response element luciferase reporter. HepG2 cells with stable lentiviral knockdown of red fluorescent protein (control), Rictor (two different hairpins), or Raptor were transfected with a 6× tandem FoxO response element luciferase construct and a control CMV-Renilla luciferase reporter as well as human FoxO1 or EGFP control. Transcriptional activity was expressed as the normalized ratio of inducible FoxO response element activity to control, constitutive, noninducible CMV-Renilla luciferase activity. Knockdown was verified by Western blotting (right). A second control, shLacZ, significantly slowed cell growth, preventing sufficient expansion for it to be transfected and used in reporter assays. n = 3. Error bars, mean ± S.E. Significance by one-way ANOVA. NS, not significant.
To investigate signaling events underlying impaired glycemic control and to confirm that mTORC2 corresponds to the hydrophobic motif kinase of Akt in vivo, we studied Akt phosphorylation. LrictorKO mice have no base-line Akt hydrophobic motif (HM) Ser-473 phosphorylation and further fail to undergo insulin-stimulated Ser-473 phosphorylation (Fig. 4B). Further, phosphorylation of the Akt activation loop (A-loop) site Thr-308 was significantly impaired in the liver of LrictorKO mice (Fig. 4B). PDK, the PIP3-dependent protein kinase that phosphorylates Akt on Thr-308, demonstrated equivalent protein levels in LrictorKO livers and controls (Fig. 4B). Decreased basal and insulin-stimulated phosphorylation of PKCα/β on its HM was also detected, indicating that PKC HM phosphorylation partially depends upon functional mTORC2 in liver (Fig. 4B).
Decreased Akt phosphorylation on the A-loop and HM correlated with decreased insulin-stimulated phosphorylation of Akt targets FoxO, PRAS40, TSC2, AS160, and GSK-3β (Fig. 4C). Loss of hepatic mTORC2 appeared to impair stability of hepatic FoxOs, as total FoxO1 and FoxO3a protein levels were moderately decreased in LrictorKO livers (Fig. 4C). To confirm that FoxO1 was more active in the setting of decreased Rictor protein levels, we stably knocked down Rictor in hepatocytes using shRNAs targeting rictor or raptor. We saw more than doubling of FoxO transcriptional activity in rictor knockdown cells as judged by a luciferase reporter driven by six tandem FoxO response elements (Fig. 4D). No change in FoxO activity was seen by loss of raptor (Fig. 4D). Knockdown of Rictor and Raptor was confirmed by Western blotting (Fig. 4D, right).
Impaired Insulin-mediated Activation of mTORC1 in LrictorKO Liver
In LrictorKO mice we saw impairment of insulin-stimulated p70 S6 kinase phosphorylation on its HM (Thr-389) and Thr-421/Ser-424 (Fig. 5). A corresponding decrease in phosphorylation of ribosomal S6 protein confirmed lower S6K activity (Fig. 5). Phosphorylation of 4E-BP1 on all sites examined seemed to remain intact (Fig. 5), indicating selective modulation of mTOR activity by hepatic rictor knock-out. Thus, it is possible that 4E-BP1 is more tightly linked to nutrient availability in liver than it is to insulin signaling. Finally, a decrease in mTORC1-dependent insulin-stimulated Lipin1 phosphorylation on Ser-106 was seen in LrictorKO livers (Fig. 5).
FIGURE 5.

Defects in insulin-stimulated mTORC1 activation in LrictorKO mice. Total protein lysates were prepared as in Fig. 4. Phospho-p70 S6K-T389, phospho-p70 S6K-T421/S424, phospho-S6-S235/236, and phospho-Lipin1-S106 were decreased in LrictorKO mice fed chow and HFD. Phospho-4E-BP1-S65 phospho-4E-BP1-T37/46 appeared to be refractory to loss of mTORC2.
Activation of Akt and Inhibition of FoxO Suppress Glycemic but Not Lipogenic Defects in Hepatic mTORC2 Knock-out Mice
To determine the significance of decreased Akt activation by mTORC2, we genetically activated Akt2, the dominant hepatic isoform (15, 21), in the livers of control and LrictorKO mice. We activated Akt2 (activAkt) both by using an N-terminal myristoylation sequence and by HM substitution of Ser-474 with a glutamic acid residue, mimicking phosphorylation by mTORC2. Both of these modifications have been previously shown to activate Akt (16, 34).
Akt phosphorylates and inhibits FoxO in part by causing its nuclear exclusion and sequestration by 14-3-3 proteins, and FoxO is known to be a downstream negative effector of insulin signaling through Akt (35), so we also determined whether it played a critical role in the diabetogenic phenotypes of LrictorKO mice. As all three FoxO isoforms are expressed in liver, FoxO1, FoxO3a, and FoxO4, we attempted to inactivate effects of all three FoxOs by hepatic expression of a truncated, dominant negative form of FoxO1 (FoxO-DN) (36).
Glucose levels in activAkt;LrictorKO and FoxO-DN;LrictorKO mice returned to that of control animals following an intraperitoneal glucose challenge (Fig. 6A). Serum insulin levels in LrictorKO mice expressing hepatic activAkt and FoxO-DN also returned to normal (Fig. 6B).
FIGURE 6.

Hepatic expression of activated Akt2 and dominant negative FoxO in LrictorKO mice separates insulin-stimulated glucose and lipid metabolism. A, response of LrictorKO mice to an intraperitoneal glucose challenge was normalized by hepatic expression of activAkt or FoxO-DN versus control (LacZ). B, insulin levels returned to control levels following hepatic expression of activAkt or FoxO-DN. C, serum triglyceride (TG) levels were quadrupled in control flox/flox mice with hepatic activAKT expression but unchanged in LrictorKO mice. No effect of FoxO-DN expression was seen in control or LrictorKO mice. D, liver weight increased only modestly in LrictorKO mice with activAkt or FoxO-DN, and this increase was significantly lower than that seen in control flox/flox mice. E, despite a small increase in liver size, no increase in hepatic triglyceride content was seen in LrictorKO animals versus controls. Control mice had a 4-fold increase in hepatic triglyceride content with activAkt expression. F, both control and LrictorKO mice had robust phosphorylation of activAkt on Thr-308 and Akt targets FoxO, GSK-3β, PRAS40, and Tsc2. G, despite full Akt activity toward other targets, slightly lower activity of mTORC1 was seen in LrictorKO livers with activAkt relative to control.
However, in contrast to glycemic phenotypes, forced hepatic expression of activated Akt2 or FoxO-DN failed to stimulate hepatic triglyceride accumulation and raise serum triglyceride levels in LrictorKO mice versus controls (Fig. 6C). A modest increase in liver weight was seen with FoxO-DN and activAkt in LrictorKO livers (Fig. 6D), but not an increase in hepatic triglyceride content (Fig. 6E). Full activation of Akt in LrictorKO and control livers was confirmed by equal and robust activAkt-mediated phosphorylation of FoxO and Akt targets GSK-3β, PRAS40, and Tsc2 (Fig. 6F). In contrast, we failed to see equivalent activation of mTORC1 in LrictorKO mice. ActivAkt stimulated mTORC1 to phosphorylate of S6K, ribosomal S6 protein, and 4EBP-1 at Thr-70 in control livers and to a lesser extent or not at all in LrictorKO mice (Fig. 6G).
DISCUSSION
In summary, we find that hepatic mTORC2 regulates glucose, lipid, and cholesterol homeostasis. mTORC2 inactivation affects signaling through Akt and FoxO, which entirely explains defects in glucose metabolism downstream of insulin signaling. However, we demonstrate that genetic inactivation of mTORC2 renders activated Akt incapable of stimulating hepatic lipogenesis and prevents development of hepatic steatosis during high fat feeding (Fig. 7). Thus, the effects of Akt on hepatic glucose and lipid metabolism are separable by different outputs of mTORC2.
FIGURE 7.

Model of metabolic effects of hepatic mTORC2 knock-out. Normally, mTORC2 serves to support Akt activity and thereby suppress hepatic glucose output and stimulate hepatic lipogenesis via HM phosphorylation and by facilitating PDK-mediated A-loop phosphorylation (left). When mTORC2 is lost, Akt is no longer activated, hepatic glucose output is increased, and hepatic lipogenesis is suppressed (middle). In hepatic mTORC2 knock-out mice, forced Akt activation can suppress hepatic glucose output but no longer increases lipogenesis, indicative of mTORC2 outputs that increase lipogenesis in parallel with Akt (right).
Loss of Rictor in liver leads to complete loss of Akt phosphorylation at the HM, and diminution of PKCα/β phosphorylation on the HM (1, 37). However, what was unexpected was that loss of mTORC2 also reduced PDK-dependent phosphorylation of Akt on the A-loop. Thus, in liver, unlike in mouse embryonic fibroblasts or cells in culture (1–3, 5), A-loop phosphorylation is either dependent upon HM phosphorylation, or loss of mTORC2 function impairs PDK-dependent phosphorylation of Akt in a manner independent of the HM.
Genetic inactivation of mTORC2 leads to hepatic insulin resistance. LrictorKO mice fail to suppress hepatic glucose output and show double normal fasting and glucose-stimulated insulin levels. We suspect that higher insulin levels in LrictorKO mice facilitate glucose disposal in the periphery, which remains insulin-sensitive. During insulin clamp, LrictorKO mice failed to respond to hyperinsulinemia, leading to hepatic glucose output that equals that in the fasted animal. In the hyperinsulinemic state, expression of key gluconeogenic genes was increased, suggesting that the mechanism of increased hepatic glucose output in LrictorKO mice is by inappropriately elevating gluconeogenesis.
Gluconeogenic gene expression is regulated by insulin signaling through Akt and subsequent phosphorylation and inhibition of the FoxO transcription factors. Glucose intolerance and elevated hepatic glucose production in double Akt1;Akt2 hepatic knock-out mice is rescued by concomitant loss of function in FoxO1 (22). This is concordant with our observation that either by expression of activated Akt or dominant negative FoxO1, we fully restored glucose sensitivity and normalized insulin levels in LrictorKO mice. This argues that insulin-dependent regulation of hepatic glucose homeostasis via mTORC2 is principally through Akt-FoxO. As our FoxO-DN is expected to mitigate activity of all FoxOs, our results do not indicate which hepatic FoxO family member, 1, 3a, or 4, is responsible for mediating increased hepatic glucose output in LrictorKO mice. Although mTORC1 activity is decreased in our mTORC2 hepatic knock-out, we conclude that excess hepatic glucose production is the consequence of deranged signaling of mTORC2 to Akt-FoxO and not due to decreased mTORC1 activity because (i) in our data, knockdown of rictor and not raptor increased FoxO activity in hepatocytes; (ii) hepatic raptor knock-out mice do not show glucose intolerance (11, 12, 24); and (iii) short term rapamycin treatment, which inhibits mTORC1 selectively, inhibits fasting-refeeding induced lipogenic but not gluconeogenic gene expression (25, 38). During the preparation of this manuscript, Lamming et al. demonstrated that long term treatment of rapamycin, which disrupts both mTORC1 and mTORC2 (39), mediates insulin resistance leading to hyperglycemia via disruption of mTORC2 and not mTORC1 (40), a finding concordant with our results.
LrictorKO mice have lower hepatic triglyceride levels, lower serum triglyceride levels, and lower serum cholesterol levels. This is accompanied by a lowering of mRNAs for the key lipogenic and cholesterogenic transcription factors SREBP-1c and SREBP-2, respectively (41). Because of the quality of commercially available antibodies, we were unable to show decreased nuclear SREBP-1c or SREBP-2 in LrictorKO livers. However, decreased mRNAs for well established SREBP transcriptional targets acetyl-CoA-carboxylase-1, fatty acid synthase, stearoyl-CoA-desaturase-1, and malic enzyme correlate highly with decreased SREBP-1 activity (32, 33).
Our data agree with prior observations that hepatic triglyceride accumulation is dependent upon activation of Akt in liver (15, 16). However, our results suggest that activation of Akt alone is insufficient to activate lipogenesis in LrictorKO mice. Given that we observed failure to activate mTORC1 by insulin and by activated Akt in mTORC2-deficient liver, one possibility is that lipogenesis requires mTORC2 to fully and independently activate both Akt and mTORC1 (Fig. 7). Data in support of this model have recently emerged from elegant loss-of-function models (23). Further, hepatic loss of function of mTORC1 leads to protection against hepatic steatosis and excess cholesterol synthesis stimulated by HFD feeding (11, 12). These effects may be due to loss of mTORC1-mediated Lipin1 phosphorylation, which serves to activate SREBP-1c (24). Indeed in LrictorKO livers treated with insulin, we see decreased phosphorylation of Lipin1 on Ser-106, indicative of decreased mTORC1 activity.
Our results strongly argue, irrespective of whether mTORC1 is involved, that without functional mTORC2, activated Akt is unable to fully activate lipogenesis (Fig. 7). We show that genetically delivered activated Akt has full activity toward its usual substrates FoxO, Tsc2, PRAS40, and GSK-3β, and drives lipogenesis fully in control livers. This invokes additional outputs of mTORC2, other than Akt, that are important for normal hepatic lipid metabolism. Two possibilities are an additional communication of mTORC2 to mTORC1 independent of Akt or an output of mTORC2 that regulates lipid metabolism in parallel to Akt and mTORC1. Further experiments are needed to clarify these possibilities.
We suggest that mTORC2 is the highest branch-point in hepatic insulin signaling that is able to separate the stimulatory effects of insulin on lipogenesis from suppression of gluconeogenesis. mTORC2 activity could be selectively modulated to suppress gluconeogenesis and simultaneously suppress lipogenesis, allowing for better therapy of type 2 diabetes mellitus, which is frequently complicated by hepatic steatosis. Better understanding of how mTORC2 signals might allow effective therapies for diabetes, steatohepatitis, and hypercholesterolemia.
Supplementary Material
Supplemental Data
Acknowledgments
We thank Joseph Avruch for obtaining rictor conditional mice from the Mutant Mouse Regional Resource Center and for discussions and reading the manuscript; members of the Avruch and Kelleher laboratories, Dawang Zhou, Ning Dai, and Joe Rapley for technical discussions; and Cell Signaling Technology for providing phospho-Lipin1 antibodies.
*
This research was supported, in whole or in part, by National Institutes of Health Career Development Award K08DK087941 through the NIDDK (to A. A. S.). This work was also supported by a Child Health Research Award from the Charles H. Hood Foundation (to A. A. S).
2
The abbreviations used are:
mTORC2
mammalian target of rapamycin complex 2 (Rictor)
activAkt
activated Akt2
A-loop
Akt activation loop
DN
dominant negative
HM
hydrophobic motif
LrictorKO
liver rictor knock-out
HFD
high fat diet
mTORC1
mTOR complex 1 (Raptor)
TBP
TATA-binding protein.
REFERENCES
- 1.Sarbassov D. D., Guertin D. A., Ali S. M., Sabatini D. M. (2005) Phosphorylation and regulation of Akt/PKB by the Rictor-mTOR complex. Science 307, 1098–1101 [DOI] [PubMed] [Google Scholar]
- 2.Guertin D. A., Stevens D. M., Thoreen C. C., Burds A. A., Kalaany N. Y., Moffat J., Brown M., Fitzgerald K. J., Sabatini D. M. (2006) Ablation in mice of the mTORC components Raptor, Rictor, or mLST8 reveals that mTORC2 is required for signaling to Akt-FoxO and PKCα, but not S6K1. Dev. Cell 11, 859–871 [DOI] [PubMed] [Google Scholar]
- 3.Frias M. A., Thoreen C. C., Jaffe J. D., Schroder W., Sculley T., Carr S. A., Sabatini D. M. (2006) mSin1 is necessary for Akt/PKB phosphorylation, and its isoforms define three distinct mTORC2s. Curr. Biol. 16, 1865–1870 [DOI] [PubMed] [Google Scholar]
- 4.García-Martinez J. M., Alessi D. R. (2008) mTOR complex 2 (mTORC2) controls hydrophobic motif phosphorylation and activation of serum- and glucocorticoid-induced protein kinase 1 (SGK1). Biochem. J. 416, 375–385 [DOI] [PubMed] [Google Scholar]
- 5.Yang Q., Inoki K., Ikenoue T., Guan K. L. (2006) Identification of Sin1 as an essential TORC2 component required for complex formation and kinase activity. Genes Dev. 20, 2820–2832 [DOI] [PMC free article] [PubMed] [Google Scholar]
- 6.Kumar A., Harris T. E., Keller S. R., Choi K. M., Magnuson M. A., Lawrence J. C., Jr. (2008) Muscle-specific deletion of Rictor impairs insulin-stimulated glucose transport and enhances basal glycogen synthase activity. Mol. Cell. Biol. 28, 61–70 [DOI] [PMC free article] [PubMed] [Google Scholar]
- 7.Kumar A., Lawrence J. C., Jr., Jung D. Y., Ko H. J., Keller S. R., Kim J. K., Magnuson M. A., Harris T. E. (2010) Fat cell-specific ablation of Rictor in mice impairs insulin-regulated fat cell and whole-body glucose and lipid metabolism. Diabetes 59, 1397–1406 [DOI] [PMC free article] [PubMed] [Google Scholar]
- 8.Bentzinger C. F., Romanino K., Cloëtta D., Lin S., Mascarenhas J. B., Oliveri F., Xia J., Casanova E., Costa C. F., Brink M., Zorzato F., Hall M. N., Rüegg M. A. (2008) Skeletal muscle-specific ablation of Raptor, but not of Rictor, causes metabolic changes and results in muscle dystrophy. Cell Metab. 8, 411–424 [DOI] [PubMed] [Google Scholar]
- 9.Cybulski N., Polak P., Auwerx J., Rüegg M. A., Hall M. N. (2009) mTOR complex 2 in adipose tissue negatively controls whole-body growth. Proc. Natl. Acad. Sci. U.S.A. 106, 9902–9907 [DOI] [PMC free article] [PubMed] [Google Scholar]
- 10.Gu Y., Lindner J., Kumar A., Yuan W., Magnuson M. A. (2011) Rictor/mTORC2 is essential for maintaining a balance between β cell proliferation and cell size. Diabetes 60, 827–837 [DOI] [PMC free article] [PubMed] [Google Scholar]
- 11.Sengupta S., Peterson T. R., Laplante M., Oh S., Sabatini D. M. (2010) mTORC1 controls fasting-induced ketogenesis and its modulation by ageing. Nature 468, 1100–1104 [DOI] [PubMed] [Google Scholar]
- 12.Yecies J. L., Zhang H. H., Menon S., Liu S., Yecies D., Lipovsky A. I., Gorgun C., Kwiatkowski D. J., Hotamisligil G. S., Lee C. H., Manning B. D. (2011) Akt stimulates hepatic SREBP1c and lipogenesis through parallel mTORC1-dependent and -independent pathways. Cell Metab. 14, 21–32 [DOI] [PMC free article] [PubMed] [Google Scholar]
- 13.Whiteman E. L., Cho H., Birnbaum M. J. (2002) Role of Akt/protein kinase B in metabolism. Trends Endocrinol. Metab. 13, 444–451 [DOI] [PubMed] [Google Scholar]
- 14.Cho H., Mu J., Kim J. K., Thorvaldsen J. L., Chu Q., Crenshaw E. B., 3rd, Kaestner K. H., Bartolomei M. S., Shulman G. I., Birnbaum M. J. (2001) Insulin resistance and a diabetes mellitus-like syndrome in mice lacking the protein kinase Akt2 (PKBβ). Science 292, 1728–1731 [DOI] [PubMed] [Google Scholar]
- 15.Leavens K. F., Easton R. M., Shulman G. I., Previs S. F., Birnbaum M. J. (2009) Akt2 is required for hepatic lipid accumulation in models of insulin resistance. Cell Metab. 10, 405–418 [DOI] [PMC free article] [PubMed] [Google Scholar]
- 16.Ono H., Shimano H., Katagiri H., Yahagi N., Sakoda H., Onishi Y., Anai M., Ogihara T., Fujishiro M., Viana A. Y., Fukushima Y., Abe M., Shojima N., Kikuchi M., Yamada N., Oka Y., Asano T. (2003) Hepatic Akt activation induces marked hypoglycemia, hepatomegaly, and hypertriglyceridemia with sterol regulatory element-binding protein involvement. Diabetes 52, 2905–2913 [DOI] [PubMed] [Google Scholar]
- 17.George S., Rochford J. J., Wolfrum C., Gray S. L., Schinner S., Wilson J. C., Soos M. A., Murgatroyd P. R., Williams R. M., Acerini C. L., Dunger D. B., Barford D., Umpleby A. M., Wareham N. J., Davies H. A., Schafer A. J., Stoffel M., O'Rahilly S., Barroso I. (2004) A family with severe insulin resistance and diabetes due to a mutation in AKT2. Science 304, 1325–1328 [DOI] [PMC free article] [PubMed] [Google Scholar]
- 18.Hussain K., Challis B., Rocha N., Payne F., Minic M., Thompson A., Daly A., Scott C., Harris J., Smillie B. J., Savage D. B., Ramaswami U., De Lonlay P., O'Rahilly S., Barroso I., Semple R. K. (2011) An activating mutation of AKT2 and human hypoglycemia. Science 334, 474. [DOI] [PMC free article] [PubMed] [Google Scholar]
- 19.Nakae J., Kitamura T., Silver D. L., Accili D. (2001) The forkhead transcription factor FoxO1 (Fkhr) confers insulin sensitivity onto glucose-6-phosphatase expression. J. Clin. Invest. 108, 1359–1367 [DOI] [PMC free article] [PubMed] [Google Scholar]
- 20.Puigserver P., Rhee J., Donovan J., Walkey C. J., Yoon J. C., Oriente F., Kitamura Y., Altomonte J., Dong H., Accili D., Spiegelman B. M. (2003) Insulin-regulated hepatic gluconeogenesis through FoxO1-PGC-1α interaction. Nature 423, 550–555 [DOI] [PubMed] [Google Scholar]
- 21.Li X., Monks B., Ge Q., Birnbaum M. J. (2007) Akt/PKB regulates hepatic metabolism by directly inhibiting PGC-1α transcription coactivator. Nature 447, 1012–1016 [DOI] [PubMed] [Google Scholar]
- 22.Lu M., Wan M., Leavens K. F., Chu Q., Monks B. R., Fernandez S., Ahima R. S., Ueki K., Kahn C. R., Birnbaum M. J. (2012) Insulin regulates liver metabolism in vivo in the absence of hepatic Akt and FoxO1. Nat. Med. 18, 388–395 [DOI] [PMC free article] [PubMed] [Google Scholar]
- 23.Wan M., Leavens K. F., Saleh D., Easton R. M., Guertin D. A., Peterson T. R., Kaestner K. H., Sabatini D. M., Birnbaum M. J. (2011) Postprandial hepatic lipid metabolism requires signaling through Akt2 independent of the transcription factors FoxA2, FoxO1, and SREBP1c. Cell Metab. 14, 516–527 [DOI] [PMC free article] [PubMed] [Google Scholar]
- 24.Peterson T. R., Sengupta S. S., Harris T. E., Carmack A. E., Kang S. A., Balderas E., Guertin D. A., Madden K. L., Carpenter A. E., Finck B. N., Sabatini D. M. (2011) mTOR complex 1 regulates lipin 1 localization to control the SREBP pathway. Cell 146, 408–420 [DOI] [PMC free article] [PubMed] [Google Scholar]
- 25.Li S., Brown M. S., Goldstein J. L. (2010) Bifurcation of insulin signaling pathway in rat liver: mTORC1 required for stimulation of lipogenesis, but not inhibition of gluconeogenesis. Proc. Natl. Acad. Sci. U.S.A. 107, 3441–3446 [DOI] [PMC free article] [PubMed] [Google Scholar]
- 26.Kim J. K., Kim Y. J., Fillmore J. J., Chen Y., Moore I., Lee J., Yuan M., Li Z. W., Karin M., Perret P., Shoelson S. E., Shulman G. I. (2001) Prevention of fat-induced insulin resistance by salicylate. J. Clin. Invest. 108, 437–446 [DOI] [PMC free article] [PubMed] [Google Scholar]
- 27.Chartier C., Degryse E., Gantzer M., Dieterle A., Pavirani A., Mehtali M. (1996) Efficient generation of recombinant adenovirus vectors by homologous recombination in Escherichia coli. J. Virol. 70, 4805–4810 [DOI] [PMC free article] [PubMed] [Google Scholar]
- 28.Tam B. Y., Wei K., Rudge J. S., Hoffman J., Holash J., Park S. K., Yuan J., Hefner C., Chartier C., Lee J. S., Jiang S., Nayak N. R., Niyak N. R., Kuypers F. A., Ma L., Sundram U., Wu G., Garcia J. A., Schrier S. L., Maher J. J., Johnson R. S., Yancopoulos G. D., Mulligan R. C., Kuo C. J. (2006) VEGF modulates erythropoiesis through regulation of adult hepatic erythropoietin synthesis. Nat. Med. 12, 793–800 [DOI] [PubMed] [Google Scholar]
- 29.Tang E. D., Nuñez G., Barr F. G., Guan K. L. (1999) Negative regulation of the forkhead transcription factor FKHR by Akt. J. Biol. Chem. 274, 16741–16746 [DOI] [PubMed] [Google Scholar]
- 30.Postic C., Magnuson M. A. (2000) DNA excision in liver by an albumin-Cre transgene occurs progressively with age. Genesis 26, 149–150 [DOI] [PubMed] [Google Scholar]
- 31.Shiota C., Woo J. T., Lindner J., Shelton K. D., Magnuson M. A. (2006) Multiallelic disruption of the rictor gene in mice reveals that mTOR complex 2 is essential for fetal growth and viability. Dev. Cell 11, 583–589 [DOI] [PubMed] [Google Scholar]
- 32.Shimomura I., Bashmakov Y., Horton J. D. (1999) Increased levels of nuclear SREBP-1c associated with fatty livers in two mouse models of diabetes mellitus. J. Biol. Chem. 274, 30028–30032 [DOI] [PubMed] [Google Scholar]
- 33.Shimomura I., Shimano H., Korn B. S., Bashmakov Y., Horton J. D. (1998) Nuclear sterol regulatory element-binding proteins activate genes responsible for the entire program of unsaturated fatty acid biosynthesis in transgenic mouse liver. J. Biol. Chem. 273, 35299–35306 [DOI] [PubMed] [Google Scholar]
- 34.Alessi D. R., Andjelkovic M., Caudwell B., Cron P., Morrice N., Cohen P., Hemmings B. A. (1996) Mechanism of activation of protein kinase B by insulin and IGF-1. EMBO J. 15, 6541–6551 [PMC free article] [PubMed] [Google Scholar]
- 35.Salih D. A., Brunet A. (2008) FoxO transcription factors in the maintenance of cellular homeostasis during aging. Curr. Opin. Cell Biol. 20, 126–136 [DOI] [PMC free article] [PubMed] [Google Scholar]
- 36.Altomonte J., Richter A., Harbaran S., Suriawinata J., Nakae J., Thung S. N., Meseck M., Accili D., Dong H. (2003) Inhibition of FoxO1 function is associated with improved fasting glycemia in diabetic mice. Am. J. Physiol. Endocrinol. Metab. 285, E718–728 [DOI] [PubMed] [Google Scholar]
- 37.Ikenoue T., Inoki K., Yang Q., Zhou X., Guan K. L. (2008) Essential function of TORC2 in PKC and Akt turn motif phosphorylation, maturation and signalling. EMBO J. 27, 1919–1931 [DOI] [PMC free article] [PubMed] [Google Scholar]
- 38.Porstmann T., Santos C. R., Griffiths B., Cully M., Wu M., Leevers S., Griffiths J. R., Chung Y. L., Schulze A. (2008) SREBP activity is regulated by mTORC1 and contributes to Akt-dependent cell growth. Cell Metab. 8, 224–236 [DOI] [PMC free article] [PubMed] [Google Scholar]
- 39.Sarbassov D. D., Ali S. M., Sengupta S., Sheen J. H., Hsu P. P., Bagley A. F., Markhard A. L., Sabatini D. M. (2006) Prolonged rapamycin treatment inhibits mTORC2 assembly and Akt/PKB. Mol. Cell 22, 159–168 [DOI] [PubMed] [Google Scholar]
- 40.Lamming D. W., Ye L., Katajisto P., Goncalves M. D., Saitoh M., Stevens D. M., Davis J. G., Salmon A. B., Richardson A., Ahima R. S., Guertin D. A., Sabatini D. M., Baur J. A. (2012) Rapamycin-induced insulin resistance is mediated by mTORC2 loss and uncoupled from longevity. Science 335, 1638–1643 [DOI] [PMC free article] [PubMed] [Google Scholar]
- 41.Jeon T. I., Osborne T. F. (2012) SREBPs: metabolic integrators in physiology and metabolism. Trends Endocrinol. Metab. 23, 65–72 [DOI] [PMC free article] [PubMed] [Google Scholar]
Associated Data
This section collects any data citations, data availability statements, or supplementary materials included in this article.
Supplementary Materials
Supplemental Data