HDAC2 negatively regulates memory formation and synaptic plasticity (original) (raw)
. Author manuscript; available in PMC: 2012 Nov 15.
Published in final edited form as: Nature. 2009 May 7;459(7243):55–60. doi: 10.1038/nature07925
Abstract
Chromatin modifications, especially histone-tail acetylation, have been implicated in memory formation. Increased histone-tail acetylation induced by inhibitors of histone deacetylases (HDACis) facilitates learning and memory in wildtype mice as well as in mouse models of neurodegeneration. Harnessing the therapeutic potential of HDACi requires knowledge of the specific HDAC family member(s) linked to cognitive enhancement. Here we show that neuron-specific overexpression of HDAC2, but not HDAC1, reduced dendritic spine density, synapse number, synaptic plasticity, and memory formation. Conversely, HDAC2 deficiency resulted in increased synapse number and memory facilitation, similar to chronic HDACi treatment in mice. Notably, reduced synapse number and learning impairment of _HDAC2_-overexpressing mice were ameliorated by chronic HDACi treatment. Correspondingly, HDACi treatment failed to further facilitate memory formation in _HDAC2_-deficient mice. Furthermore, analysis of promoter occupancy revealed association of HDAC2 with the promoters of genes implicated in synaptic plasticity and memory formation. Together, our results suggest that HDAC2 plays a role in modulating synaptic plasticity and long-lasting changes of neural circuits, which in turn negatively regulates learning and memory. These observations encourage the development and testing of HDAC2-selective inhibitors for human diseases associated with memory impairment.
Neuronal adaptive responses implicated in memory formation and storage involve functional and structural synaptic changes, which require alterations in gene expression1,2. The mechanisms underlying this process are still unclear. Chromatin remodeling, especially through histone-tail acetylation, which alters the compact chromatin structure and changes the accessibility of DNA to regulatory proteins, is emerging as a fundamental mechanism for regulating gene expression3,4. Recently, histone acetylation has been implicated in synaptic plasticity and learning behaviour5–9. Notably, it was demonstrated that the non-selective histone deacetylase (HDAC) inhibitor, sodium butyrate (SB), reinstated learning ability and promoted retrieval of long-term memory in mice even after massive neuronal loss10. Together, these observations indicate that HDAC inhibition may provide a therapeutic avenue for memory impairment caused by neurodegenerative and other diseases. However, the clinical application of broadly acting non-selective HDACi in cancer has shown a range of untoward effects, which may limit their utility in non-lethal, chronic disease applications11–13. Thus, identification of the HDAC family member(s) specifically involved in memory formation will help elucidate the mechanism(s) by which chromatin remodeling regulates memory and lead to more selective HDACi for memory enhancement.
Chronic HDACi treatment facilitates memory formation
Based on in vitro HDAC selectivity studies, SB might affect brain function mainly through class I HDACs, including HDAC1, 2, 3, 8 (Supplemental text). To gain further insight into the ability of systemic HDACi to enhance memory, and to identify more potent HDACi than SB10, a set of prototypical HDACi with a wide range of structures and metal chelating elements were tested in mice using a contextual fear conditioning assay. While some HDACi did not facilitate memory formation (data not shown), chronic treatment with suberoylanilide hydroxamic acid (SAHA; vorinostat), a clinically approved agent, enhanced memory formation more potently than SB (Supplemental Figs. 1&16c,d). This finding is consistent with the previous report that SAHA rescued memory deficits in a mouse model of Rubinstein-Taybi syndrome5. Given the ability of both compounds to cross the blood-brain barrier, as measured indirectly by changes in histone acetylation in brain10,14,15 and directly by measuring the amount of SAHA in the brain (data not shown), we focused our subsequent studies on SAHA-induced memory enhancement.
As SAHA primarily inhibits class I HDACs and HDAC616, a class II HDAC known to target α-tubulin(K40) acetylation17,18, we examined whether selective inhibition of HDAC6 using the HDACi WT-161 had effects on memory formation (Supplemental Fig. 2a–c). WT-161 did not increase memory formation (Supplemental Fig. 2d), suggesting that HDAC6 inhibition is not responsible for SAHA-induced memory enhancement. In agreement with these observations, proteome-wide studies of a SAHA-based affinity probe indentified HDAC1 and HDAC2 as the main cellular targets19, suggesting that these may be relevant targets for HDACi-induced memory enhancement.
HDAC2 but not HDAC1 plays a role in memory formation
To directly evaluate the physiological role of HDAC1 and HDAC2 in the brain, we generated two mouse lines in which HDAC1 or HDAC2 was overexpressed in neurons (Supplemental Fig. 3A–C). The mouse HDAC1 or HDAC2 coding sequence was placed in-frame with the endogenous initiation codon of exon 1 of the Tau gene, thereby creating a fusion protein that contains the first 31 amino acids of Tau. Previously, homozygous animals mutant for Tau were shown to be indistinguishable from wild-type littermates in memory tests20,21. A 2–3 fold increase in HDAC1 or HDAC2 protein expression in brain of homozygous animals as compared to WT mice was observed in the hippocampus and other areas of the brain (Fig. 1a, Supplemental Fig. 4). Consistently, the overall acetylated lysine level was reduced in homozygous HDAC1- (HDAC1OE) and HDAC2-overexpression mice (HDAC2OE) (Fig. 1b), especially in the pyramidal neurons of the hippocampal formation (Supplemental Fig. 3d). We found decreased acetylation of H4K12 and H4K5, but not H3K14, in HDAC2OE mouse brains (Fig. 1b and data not shown). In contrast, acetylated α-tubulin(K40) level did not change in HDAC1OE or HDAC2OE mice. Thus, the HDAC1/2-overexpressing animals exhibited increased histone deacetylation in the brain compared to that of the wildtype (WT) littermates. Importantly, there was no discernable difference in gross brain anatomy or neuronal positioning in the HDAC1/2-overexpressing mice (Supplemental Figs. 5 &12), suggesting that increased HDAC1/2 is not detrimental to brain development.
Figure 1. HDAC2, but not HDAC1, overexpression mice exhibit impaired memory formation.

a. Western blots from brain lysate showed up-regulation of HDAC1 and HDAC2 in HDAC1 and HDAC2 homozygous overexpression mice, respectively. b. Decreased histone acetylation in the hippocampus of HDAC1OE and HDAC2OE mice. c. Associative memory test for HDAC1OE and HDAC2OE mice. HDAC1OE mice (n=17), WT mice (n=19), HDAC2OE mice (n=14). d. Distance traveled during the initial 3 min exposure to the training box. e. The velocity during the training and electoral foot shock (I=1.0 mA). f. Hidden platform of Morris water maze. Escape latencies of WT mice improved significantly faster than HDAC2OE mice (Genotype x Day F(1,8)=3.401, p=0.0010; genotype F(1,8)=52.32, p<0.0001; Day F(1,8)=7.372, p<0.0001), but not HDAC1OE mice(Genotype x Day F(1,8)=0.5989, p=0.7784; Day F(1,8)=12.14, p<0.0001; Genotype F(1,8)=0.2672, p=0.6057) g. Representative path tracings of the probe test on day 5. The swimming time in each quadrant were quantified. T, target quadrant; L, left quadrant; O, opposite quadrant; R, right quadrant. *, p<0.05; **, p<0.005; ***, p<0.001.
To evaluate the consequence of HDAC1/2-overexpression on hippocampus-dependent memory formation, 4-month-old HDAC1OE and HDAC2OE mice were trained using Pavlovian fear conditioning paradigms prior to a memory test 24hr later. While HDAC1OE mice (n=17) displayed a comparable freezing levels (_p_=0.6470, context; p=0.8199, tone) to that of the control mice (n=19), much to our surprise, HDAC2OE mice (n=14) showed markedly decreased freezing behaviour in both the context- and tone-dependent fear learning (Fig. 1c, _p_=0.0035 and _p_=0.0007 respectively). The reduction of HDAC2OE mice in freezing behaviour was not due to motor defects or impaired pain sensation as their response to electric foot shock and the explorative behaviour during exposure to novel context were similar to the control mice (Fig. 1d,e). Interestingly, in the short-term memory test, no significant difference could be detected among HDAC1OE, HDAC2OE and WT control mice in both context- and tone-dependent fear learning 3 hours after training (Supplemental Fig. 6b). These observations suggest that HDAC2 (but not HDAC1) gain-of-function in the nervous system results in associative learning impairments.
To further evaluate the integrity of hippocampus-dependent memory formation in the HDAC2OE mice, we utilized the Morris water maze paradigm. The escape latency of the HDAC1OE mice closely paralleled the control mice during a 9-day training period for the hidden platform paradigm (_p_=0.7784, 2-way ANOVA). In contrast, the HDAC2OE mice showed significantly increased escape latency throughout the training process (_p_=0.0010, 2-way ANOVA, Fig. 1f). A probe trial was further performed to quantitatively measure the time spent in each quadrant of the swimming pool when the hidden platform was removed from the pool. Notably, the HDAC2OE mice did not show a preference towards the target quadrant whereas the control mice (_p_= 0.0145, target quadrant versus opposite quadrant) and HDAC1OE mice (_p_=0.008) spent significantly more time in the target quadrant (Fig. 1g). Comparable motor and visual function between the various strains were observed in visible platform test (Supplemental Fig. 6a,b). These results revealed a marked reduction of spatial learning of the HDAC2OE mice. Furthermore, HDAC2OE mice (but not HDAC1OE) mice showed spatial working memory impairment in a T-maze non-matching-to-place task (Supplemental Fig. 6h). Thus, gain of function of HDAC2, but not HDAC1, impairs hippocampus-dependent memory formation as well as working memory.
To further investigate the role of HDAC2 in associative learning, HDAC2 deficient mice (HDAC2KO) were generated by crossing mice carrying a floxed Hdac2 allele with Nestin-Cre transgenic mice. Germ-line deletion of Hdac2 resulted in viable and fertile Hdac2+/− mice with no obvious histological abnormalities up to a year of age (Supplemental Methods, Supplemental Fig. 7). Crossing Hdac2+/− mice gave rise to viable _Hdac2_-deficient mice, which had normal brain anatomy and cell positioning (Fig. 2a,b, Supplemental Figs. 8a, 12 and data not shown). H4K5, H4K12 and H2B acetylation were significantly increased in the hippocampus of HDAC2KO mice. However, overall lysine acetylation in histone preparations was slightly decreased as revealed by western blot analysis (Fig. 2b). This might be the consequence of a compensatory increase of HDAC1 in HDAC2KO mice (Supplemental Fig. 7d). Remarkably, the HDAC2KO mice showed markedly increased freezing behaviour as evaluated by the context- and tone-dependent fear conditioning paradigm (_p_=0.0036, p= 0.0047, Fig. 2c) 24hr after training when compared to WT littermates. In the short-term memory test, HDAC2KO mice showed increased freezing behaviour (p=0.010 Supplemental Fig. 6E) comparing to WT littermates in context-dependent conditioning. No differences in the locomotor activity or pain sensation were detected between these two groups of mice (Fig. 2d,e). Thus, HDAC2 loss of function enhanced associative learning. Furthermore, HDAC2KO mice showed a profound spatial working memory improvement in the T-maze non-matching-to-place task (p=0.025, two-way ANOVA, Supplemental Fig. 6g). These data, coupled with the gain-of-function studies, suggest that HDAC2 negatively regulates memory formation in mice.
Figure 2. HDAC2 knockout mice exhibit enhanced memory formation.
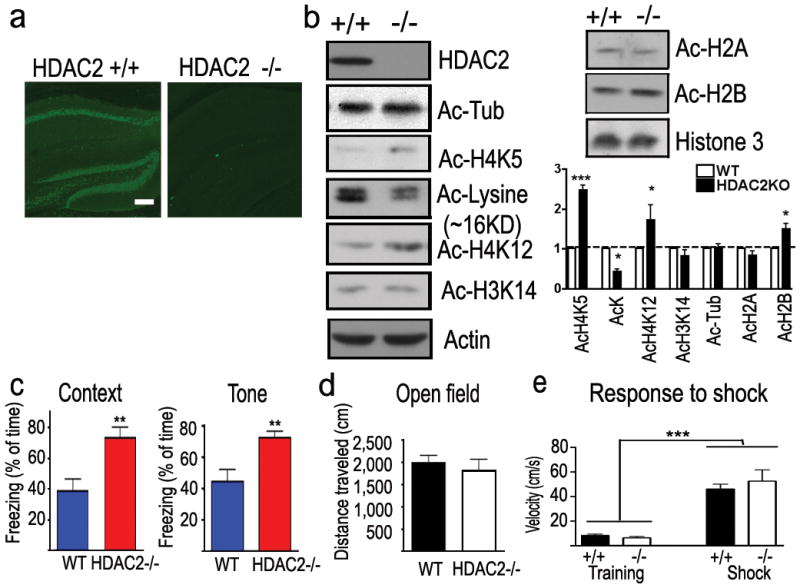
a. Immunohistochemical images showed the HDAC2 expression in the hippocampus of WT mice but not HDAC2KO mice. scale bar, 100μm b. Samples from hippocampal histone extraction showed the histone acetylation level changes in HDAC2KO mice. c. Freezing behaviour of HDAC2KO mice and control littermates (HDAC2 −/−, n = 9; WT, n = 11) during the contextual and tone-dependent memory test. d. Distance traveled during the initial 3 min exposure to the training box. e. Velocity during the training and the electric foot shock (I=0.8 mA). **, p<0.005.
HDAC2 regulates synaptogenesis and synaptic plasticity by suppressing neuronal gene expression
Since the synapse is widely assumed to be the cellular basis for learning and memory22, we assessed whether HDAC2 regulates the density of dendritic spines and therefore synapse numbers. Indeed, the density of dendritic spines along individual dendrites of hippocampal CA1 pyramidal neurons and dentate gyrus (DG) granule cells was markedly reduced in HDAC2OE mice (p<0.005, Fig. 3a, Supplemental Fig. 15ab), but not HDAC1OE mice (Supplemental Fig. 9a), when compared to WT mice. Conversely, spine density was significantly higher in HDAC2KO mice, suggesting that HDAC2 suppresses spine formation in hippocampal CA1 and DG neurons. Detailed quantifications showed that spine shape is not related to the expression level of HDAC2 (Supplemental Fig. 15a,b). Furthermore, immunoreactivity towards synaptophysin10, which labels presynaptic terminals of functional synapses, was significantly increased in the CA1 striatum radiatum of the HDAC2KO mice (p<0.0001) and reduced in HDAC2OE mice when compared to WT mice (p=0.0279, Fig. 3b), indicating more presynaptic terminals in HDAC2KO mice and less in HDAC2OE mice. The pattern of change in synaptophysin staining in the amygdala was similar to that observed in area CA1 (Supplemental Fig. 8b). Together, these results suggest that HDAC2 regulates synapse formation.
Figure 3. HDAC2 regulates synapse formation and plasticity in mouse hippocampus.
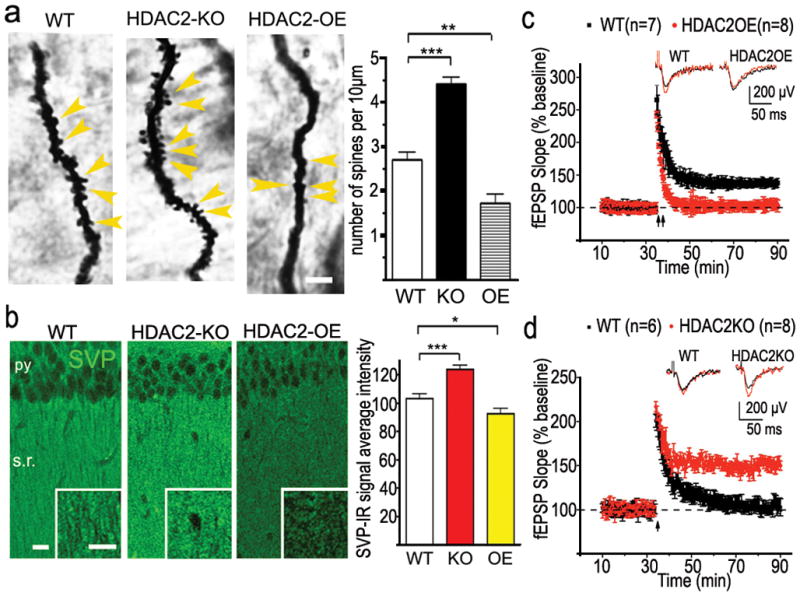
a. Representative images of golgi staining from CA1 region of hippocampus. WT (n=23), HDAC2OE (n=21), HDAC2KO (n=27). Yellow arrowhead points to the spines. Scale bar, 10μm. b. Representative confocal images of synaptophysin (SVP)-immunoreactive signal on CA1. Py, pyramidal neuron layer; s.r. stratum radiatum. scale bar, 50μm (HDAC2KO, n=17; WT, n=25; HDAC2OE, n=21). *, p<0.05; **, p<0.005; ***, p<0.001 c. LTP was induced by two HFS (2 × 100Hz, 1s) in CA1 region from 6 month old HDAC2OE mice or their WT littermates. By 40 min, the fEPSPs from HDAC2OE mice decayed to baseline (103.1± 1.8 % compared with baseline) whereas fEPSPs from control mice remained potentiated (137.9 ± 6.8 % compared with baseline). d. LTP was induced by one HFS in the CA1 region from HDAC2KO mice or their WT littermates. Slices from WT mice showed a transient potentiation that decayed to baseline (n = 6 slice, 102.9± 4.5 % compared with baseline), 40 min after induction, whereas slices from HDAC2KO mice showed a robust potentiation (n = 8 slice 144.1 ± 2.0 % compared with baseline). Inserts in c and d show superimposed sample sweeps from the first 5 min (black) and last 5 min (red) of the recording.
We next determined if HDAC2 also regulates synaptic plasticity. To this end, we performed electrophysiological recordings on hippocampal slices prepared from HDAC2OE, HDAC2KO mice and their control littermates. Long-term potentiation (LTP) of CA1 neurons induced by two trains of high-frequency stimulation (2×HFS) on the Schaffer collaterals was observed in WT mice but impaired in HDAC2OE mice (Fig 3c). Notably, a single train of HFS induced synaptic potentiation of WT CA1 neurons, which rapidly decayed, whereas robust LTP was readily induced by one train of HFS in CA1 neurons of HDAC2KO mice (Fig. 3d). No significant difference between WT and HDAC2OE groups were observed in paired-pulse facilitation (data not shown). As an additional control, we found that hippocampal LTP was not altered in HDAC1OE when compared to WT controls (Supplemental Fig. 9c), Thus, HDAC2-overexpression impaired synaptic plasticity whereas HDAC2 loss of function facilitates synaptic plasticity. Taken together, these data indicate an inverse relationship between levels of HDAC2 and synapse numbers, which in turn impacts synaptic plasticity and learning and memory.
It was previously suggested that HDACs regulate learning and memory by repressing gene expression via chromatin remodeling5,7,9. Specifically, HDACi were reported to enhance memory formation and synaptic plasticity via CREB-CBP dependent transcriptional activation9. We speculated that HDAC2 might suppress the expression of memory-associated genes by binding to their regulatory elements. We surveyed the association of HDAC1 or HDAC2 with the promoter of a total of 24 genes implicated in synaptic remodeling/plasticity or regulated by neuronal activity (Supplemental Table 1), and other genes that are not specifically associated with synaptic function. To this end, chromatin immunoprecipitation (ChIP) was performed. Consistent with previous reports that both HDAC1 and HDAC2 are associated with cell cycle genes, we observed a similar enrichment of HDAC1 and HDAC2 to the promoters of p21, Atf4 and Pgk1 (Fig. 4a). On the other hand, with minor exceptions, HDAC2 was more enriched than HDAC1 in the promoters of genes implicated in synaptic remodeling/plasticity or regulated by neuronal activity including Bdnf promoter I/II, Egr1, c-Fos, Cpg15, CamKIIα, Creb, Cbp, Nrxn III and the NMDA receptor subunits (Fig. 4a & Supplemental Fig. 10b). Importantly, HDAC2 antibody failed to enrich these promoter sequences in preparations made from HDAC2KO brain (Supplemental Fig. 10a), demonstrating the specificity of the previous results. Furthermore, we determined that levels of AcH3 and AcH4 were increased in multiple synaptic plasticity genes including Bdnf-pII, Egr1, c-Fos, and GluR1 promoters in the HDAC2 KO mice compared to the WT controls (Fig. 4b). A significant decrease of AcH3 in Bdnf-pII, c-Fos and GluR1 promoters was also detected in HDAC2OE mice, but not in HDAC1OE. Consistent with the notion that HDAC2 negatively regulates gene expression, the protein levels of multiple synaptic genes were markedly increased in the brain of HDAC2KO mice and decreased in HDAC2OE mice but not in HDAC1OE mice (Supplemental Fig. 10c–d,11a–b). Furthermore, in dissociated neurons, forskolin, KCl and BDNF treatments, all of which activate the CREB pathway23, increased EGR1 expression in an EGR1-GFP reporter assay (Supplemental Figs. 11c–d&16a–b). SAHA treatment markedly potentiated the expression of EGR1-GFP, which is consistent with the notion that HDAC2 inhibition allows greater activation of the CREB:CBP pathway. Notably, in these neurons, the effect of SAHA treatment alone was not as potent as co-treatment with either forskolin or KCl. Together, these experiments suggest that HDAC2 suppresses the expression of synaptic remodeling/plasticity genes. Thus, expression changes of these genes in HDAC2KO and HDAC2OE mice might underlie the facilitated or impaired learning behaviour and synaptic plasticity exhibited by these mice.
Figure 4. HDAC2 but not HDAC1 binds to promoters of memory related genes.

a. Semi-quantitative PCR from ChIP of samples showed specificity of DNA-binding for HDAC2 and HDAC1 quantified according to the real-time PCR signal (n=3). b. Histone acetylation changes in specific gene promoter regions in HDAC1OE, HDAC2OE and HDAC2KO mice brain. Fragmented chromatin was immunoprecipitated with antibody recognizing acetylated histone 3 or histone 4 and quantified with real-time PCR. c. Nuclear extracts prepared from the WT or HDAC2KO mouse brain were immunoprecipitated to evaluate the association of HDAC1/2 with co-repressors.
HDAC2 but not HDAC1 associates with CoREST in mouse brain
In an attempt to decipher the mechanism by which HDAC2, but not HDAC1, preferentially occupies activity-dependent gene promoters in vivo, we investigated the distribution of HDAC1/2 in the brain and the association of these two HDACs with co-repressors. We found that HDAC2 was more abundantly expressed in neurons whereas HDAC1 was more robustly expressed in the GFAP positive cells (Supplemental Fig. 14a–b). When we evaluated the associations of HDAC1 vs HDAC2 with mSin3a, CoREST, and MTA2 (NuRD) in WT and HDAC2KO brains, we observed interactions of HDAC2 with all three co-repressors (Fig. 4c). On the other hand, we failed to detect an association of HDAC1 with CoREST in WT mice and even in HDAC2KO brain lysates, despite HDAC1 being upregulated and its association with mSin3a and MTA2 being higher in these brains (Fig. 4c). These experiments suggest that CoREST preferentially associates with HDAC2. CoREST has been shown to play a key role in repressing neuronal gene expression by recruiting the molecular machinery responsible for silencing across a chromosomal interval24,25. Thus, our finding that HDAC2, but not HDAC1, interacts with CoREST in the brain fits in well with the notion that HDAC2 loss of function in neurons leads to upregulation of neuronal genes involved in basal and activity-induced neuronal functions that facilitates learning and memory. Our results are also consistent with the recent report that alteration of s-nitrosylation of HDAC2 alone could affect EGR1/c-fos expression in neurons26.
HDAC2 is the major target of HDACi in eliciting memory enhancement
The enhanced learning and memory, facilitated synaptic plasticity, and increased dendritic spine density and synapse number exhibited by the HDAC2KO mice are highly reminiscent of the reported effects of HDACi treatment5,7,10. We wondered whether HDAC2 represents the major target for HDACi induced memory enhancement. To this end, one would expect that the learning impairment of HDAC2OE mice would be readily ameliorated by HDACi treatment, whereas the same treatment should have no effect on memory formation in HDAC2KO mice. As SAHA was found to be a more potent memory enhancer than SB when given to mice (Supplemental Fig. 1c), we used SAHA in all subsequent experiments. SAHA was administered daily by intraperitoneal injection (25 mg/kg) for 10 days prior to contextual fear conditioning training and memory test. Remarkably, SAHA significantly increased the freezing behaviour of HDAC2OE mice (26.9 ± 5.9% to 66.7 ± 5.1%, Fig. 5a). It should be noted that in the same training paradigms, SAHA treatment increased the freezing behaviour of WT control mice from 44.8 ± 4.7% to 63.9 ± 4.2%. Thus, the freezing levels of HDAC2OE mice after SAHA treatment were comparable to those of the control mice treated with SAHA, despite the fact that saline treated HDAC2OE mice exhibited lower freezing behaviour. Concordantly, SAHA treatment completely abrogated the decreased dendritic spine and synapses phenotype in HDAC2OE mice (Fig 5b,c).
Figure 5. SAHA, an HDAC inhibitor, improves associative learning by targeting HDAC2.

a. Memory test for mice with contextual fear conditioning training (foot shock 1.0 mA). HDAC2OE mice (n=12, each group) and WT littermates (SAHA group, n=12; saline group, n=15) were treated with saline or SAHA (25mg/kg, i.p.) for 10 days before memory test. b. Immunostaining images of CA1 region from WT and HDAC2OE mice received chronic SAHA treatment or saline treatment. Py, pyramidal neuron layer; s.r., stratum radiatum, Scale bar=50μm, (n=12 for each group). c. Images of Golgi staining from CA1 region of hippocampus. For WT, naïve, n=23; SAHA, n=41; for HDAC2OE, naïve, n=21; SAHA, n=32. Scale bar: 10μm. d. Memory tests for mice with contextual fear conditioning training (foot shock 0.5 mA) after 10-day SAHA injection (25mg/kg, i.p.). WT mice (n=10, each group) and HDAC2 KO mice (n=8, each group). e. Immunostaining images of CA1 region from HDAC2KO mice received chronic SAHA treatment or saline treatment. Saline, n=15; SAHA, n=22. Scale bar=50μm. f. Images of Golgi staining of CA1 region from HDAC2KO mice. HDAC2KO, SAHA, n=24; naïve, n=27. *, p<0.05; **, p<0.005; ***, p<0.001
Next, we investigated the effects of SAHA on HDAC2KO mice. As HDAC2KO mice showed markedly increased freezing behaviour compared to WT littermates without treatment, we sensitized the assay by lowering the foot shock intensity from 1.0 mA to 0.5 mA to prevent a possible ceiling effect. In this paradigm, SAHA treatment induced significantly higher freezing behaviour (_p_=0.0383) in the WT control mice (45.0 ± 6.9% v.s. 25.0 ± 5.8%, Fig 5d). However, SAHA treatment did not alter the freezing behaviour in the HDAC2KO mice (52.1 ± 9.8% v.s. 49.3 ± 8.4%, p= 0.8324, Fig 5d). Furthermore, dendritic spine density of CA1 neurons and synaptophysin staining in the stratum radiatum of the HDAC2KO mice was not significantly affected by SAHA treatment (Fig. 5e,f). Consistently, although SAHA treatment modestly increased LTP in the WT hippocampus, it did not have a detectable effect on LTP in the HDAC2 KO hippocampus (Supplemental Fig. 13). Thus, HDAC2KO mice are refractory to synaptogenesis and facilitation of synaptic plasticity and memory formation induced by SAHA. These results strongly suggest that HDAC2 is the major, if not the only, target of SAHA in eliciting memory enhancement.
Discussion
In summary, using mouse genetic models, we delineated the functions of HDAC1 and HDAC2 in the brain, and showed evidence that HDAC2 plays a negative role in regulating memory formation. Notably, we identified HDAC2 as the major target of HDACi for facilitating learning and memory. However, we cannot rule out the possibility that other HDAC family members also play a role in synaptic function and memory, or that nonhistone substrates may also be modulated by HDAC2 and SAHA treatment.
Our observations suggest that HDAC1 and HDAC2 differentially regulate subsets of activity regulated genes implicated in plasticity and memory. This is unexpected, given the fact that HDAC1 and HDAC2 were reported to form functional hetero-dimers27. However, we document in this study that, HDAC2 is more abundant than HDAC1 in the co-repressor complexes containing CoREST and that HDAC2 is more abundantly expressed in neurons, providing additional insight into the functional differences between HDAC1 and HDAC2 in the nervous system. Other possibilities, such as differences in posttranslational modifications, might also contribute to the biochemical/functional dissociation between HDAC1 and HDAC2, as HDAC2 has recently been shown to be modified by s-nitrosylation and regulate EGR1 expression26. It should be noted that HDAC1-deficiency in mice is detrimental, resulting in embryonic lethality28. A recent study indicates that HDAC1 loss of function in neurons causes DNA damage and cell death29. Conversely, HDAC2 deficient mice are viable and exhibit enhanced memory formation. Using genetic models, we have found a novel and unexpected function of HDAC2 as a repressor of synaptic plasticity genes and as a mediator of the beneficial effects of HDAC inhibitors. These results not only reveal important distinct functions of HDAC 1 and HDAC2 in adult mouse brain, they also suggest a new strategy for therapeutic intervention of human diseases associated with memory impairment.
Methods summary
The mouse HDAC1 or HDAC2 coding sequence was placed into exon 1 of the Tau gene. HDAC2 KO was produced in the laboratory of R.A.D. and engineered to contain loxP recombination sites such that Cre-mediated recombination deletes exons 5 and 6. Sodium butyrate (Sigma) was dissolved in saline. HDAC inhibitors were dissolved in DMSO in 50mg/ml and diluted with saline immediate before injection (100μl–150μl, i.p.). Lysates for immunoblotting were prepared as previously described4. Immunoblot data were quantified by measuring the band intensity using NIH imaging software and UN-SCAN-it gel digitizing software (Silk Scientific). Immunostaining was performed as described previously4 using LSMeta10 software and a confocal microscope (Zeiss). All behavioral testing was performed as described before4. The data were analyzed by unpaired Student’s _t_-test. Two-way ANOVA was employed to compare difference between groups in several time points. Error bars present s.e.m.
Methods
Gene targeting construct for HDAC1 overexpression (OE) mice
The ~1200 nt-long mouse HDAC1 cDNA was amplified from a brain cDNA library and confirmed by sequencing. The cDNA was then cloned upstream of the polyadenylation (pA) signal of pC8N2 with a _Spe_I blunt ligation, subsequently HDAC1-pA was cloned into pBSK (Stratagene). A pGKneoLoxP sequence was directionally inserted into the _Xho_I-_Kpn_1 site downstream of the HDAC1-pA in pBSK. The HDAC1-pA-neo was released with _Xma_I-_Acc_65 and cloned in frame into exon 1 of the Tau gene. The Tau targeting arms were taken from pTauKR21 and modified by insertion of a _Xma_I and _Bsi_WI linker in the unique _Nco_I site. The resulting targeting vector (pTH1) containing the in frame fusion of HDAC1 coding sequence with exon 1 of Tau was confirmed by sequencing. 3–6-month-old mice were used for the behavior test and further analysis.
Gene targeting construct for HDAC2 overexpression (OE) mice
The mouse HDAC2 cDNA was obtained using RT PCR from mouse brain tissue. It was sequenced and subcloned into the _Xho_I-_Eco_R1 site of the Topo-TA vector (Invitrogen). The pTH1 targeting vector (described above) was cut open with _Sma_I-_Sal_I to release HDAC1. The HDAC2 cDNA was cut out from Topo-TA with an _Eco_RI-_Xho_I and cloned into the _Sma_I-_Sal_I site of pTH1, to create the pTH2 targeting vector. The in frame fusion of HDAC2 to exon1 of Tau was verified by sequencing of pTH2. The targeting vectors pTH1 and pTH2 were linearized with _Sac_I and electroporated into V6.5 (129XC57BL/6) F1 embryonic stem (ES) cell line. We picked 96 neomycin resistant clones, of which 46 were analyzed by southern blots. We only used a 3′ external probe, after digestion with _Bam_HI (Left) and _Eco_RI (Right). Wild-type clones display a 8.8-kb band. The correct targeting event results in a band-shift to 13 kb for the targeted allele. 5 clones were correctly targeted. Two clones were used to generate chimeras by injections into (DBA/2XC57BL/6) F1 blastocysts. Chimeras were mated to C57BL/6 females and offspring was analyzed for germline transmission. The heterozygous knock-in strains were maintained in a mixed background and were mated to obtain homozygous animals. 3–6-month-old mice were used for the behavior test and further analysis.
Generation of HDAC2KO mice
The Hdac2 floxed allele was generated by flanking exon 5 and exon 6 with _lox_P recombination sites, assuring the deletion of the HDAC-catalytic core of the protein after Cre-recombinase mediated deletion (Supplemental Fig. 7a). Upon successful targeting of ES-cells and subsequent derivation of chimeric mice, we established a mouse strain carrying a floxed allele of Hdac2 (Hdac2L)(FVB). Infection of mouse embryonic fibroblasts with retroviruses expressing Cre-recombinase resulted in complete ablation of HDAC2 only in MEFs carrying two Hdac2 floxed alleles (Supplemental Fig. 7b). This indicates that the floxed Hdac2 allele is functional and results in an Hdac2 null-genotype upon Cre-recombinase expression. Deletion of Hdac2 in the germline using EIIa-Cre or Nestin-Cre transgenic mice resulted in viable and fertile Hdac2+/− mice with no obvious histological abnormalities up to a year of age. Crossing Hdac2+/− mice gave rise to viable _Hdac2_-deficient mice, but these mice were born with a 2-fold lower frequency than expected from a normal Mendelian ratio (9 Hdac2−/− mice out of 79 littermates, versus 20 out of 79 expected; supplemental Fig. 7c). Although Hdac2−/− mice are viable and are capable of producing offspring their fertility is compromised (data not shown). Hdac2−/− mice (males and females) were approximately 25% smaller compared to wild-type and heterozygote littermates (data not shown). The animals used for behavior tests are in FVBxC57/BL6 background and mated to each other to obtain homozygous animals. 3–6-month-old mice were used for the behavior test and further analysis. There were no difference in behavior tests between males and females.
Fear conditioning tests
Context-dependent fear conditioning. Training consists of a 3 min exposure of mice to the conditioning box (context) followed by a foot shock (2 sec, 0.5/0.8/1.0 mA, constant current). The memory test was performed 24 hr later by re-exposing the mice for 3 min into the conditioning context. Freezing, defined as a lack of movement except for heart beat and respiration associated with a crouching posture, was recorded every 10 sec by two trained observers (one was unaware of the experimental conditions) during 3 min (a total of 18 sampling intervals). The number of observations indicating freezing obtained as a mean from both observers was expressed as a percentage of the total number of observations. For short-term memory test, the memory test was performed 3 hrs after the foot shock training.
Tone-dependent fear conditioning. Training consisted of a 3 min exposure of mice to the conditioning box (context), followed by a tone [30 sec, 20 kHz, 75 dB sound pressure level (SPL)] and a foot shock (2 sec, 0.8 mA, constant current) 30. The memory test was performed 24 hr later by exposing the mice for 3 min to a novel context followed by an additional 3 min exposure to a tone (10 kHz, 75 dB SPL). Freezing was recorded every 10 sec by two nonbiased observers as described above.
Morris water maze test
The water maze paradigm 31 was performed in a circular tank (diameter 1.8 m) filled with opaque water. A platform (11 × 11 cm) was submerged below the water’s surface in the center of the target quadrant. The swimming path of the mice was recorded by a video camera and analyzed by the Videomot 2 software (TSE). For each training session, the mice were placed into the maze consecutively from four random points of the tank. Mice were allowed to search for the platform for 60 s. If the mice did not find the platform within 60 s, they were gently guided to it. Mice were allowed to remain on the platform for 15 s. Two training trials were given every day; the latency for each trial was recorded for analysis. During the memory test (probe test), the platform was removed from the tank, and the mice were allowed to swim in the maze for 60 s.
Spatial working memory on elevated T-maze
Mice were maintained on a restricted feeding schedule at 85% of their free-feeding weight. Spatial working memory was first assessed on an elevated plastic T-maze. This consisted of a start arm (47 × 10 cm) and two identical goal arms (35 × 10 cm), surrounded by a 10 cm high wall. A plastic food well was located 3 cm from the end of each goal arm. The maze was located 1 m above the floor in a well-lit laboratory that contained various prominent distal extramaze cues. The mice were habituated to the maze, and to drinking sweetened, condensed milk, over several days before spatial non-matching-to-place testing.
Each trial consisted of a sample run and a choice run. On the sample run, the mice were forced either left or right by the presence of a plastic block, according to a pseudorandom sequence (with equal numbers of left and right turns per session, and with no more than two consecutive turns in the same direction). A reward consisting of 0.07 mL of sweetened, condensed milk (diluted 50/50 with water) was available in the food well at the end of the arm. The block was then removed, and the mouse was placed, facing the experimenter, at the end of the start arm and allowed a free choice of either arm. The time interval between the sample run and the choice run was approximately 15 s. The animal was rewarded for choosing the previously unvisited arm (that is, for alternating). Mice were run one trial at a time with an intertrial interval (ITI) of approximately 10 min. Each daily session consisted of 4 trials, and mice received 24 trials in total.
Chemical administration
Suberoylanilide hydroxamic acid (SAHA) was synthesized as described previously in WO 93/07148 PTC/US92/08454 32. WT-161 was synthesized by J.E.B (manuscript in preparation). Sodium butyrate was purchased from Sigma (#B5887). SAHA and WT-161 were dissolved in DMSO as stock solutions and diluted in saline just before injection. Sodium butyrate was prepared in saline. Mice received intraperitoneal injection daily with either SAHA or saline for 10 days or 21 days, using a vehicle consisting of 10% DMSO/90% saline (water with 0.9% NaCl). SAHA and WT-161 solutions were first prepared by making a 50 mg/mL compound/DMSO stock solution, then diluted with saline in a 1:9 ratio (5 mg/mL final concentration) so the final volume of DMSO is 10% and administered immediately using a 26-guage needle.
Golgi impregnation
Golgi-Cox-stained brains33 were cut to 200 μm thick cross-sections with vibratome and analyzed using a Zeiss 200 Axiovert microscope and Openlab software. The number of apical and basal spines on hippocampal CA1 pyramidal neurons was counted blind to the genotype. For each experimental group, a minimum of 10 cells per slice (animal number n = 3) were analyzed. CA1 hippocampal neurons within the region −1.4 mm to −1.6 mm (relative to the Bregma position) were included for the analysis.
Virus mediated spine labeling
Tomato expressing HSV (0.5 μL, gift from Rachael Neve) was stereo-injected into both sides of area CA1 or dentate gyrus with 0.05 μL/min rate. Mice were sacrificed 48 hrs after injection. Brains were fixed with 4% PFA and sectioned with vibratome (50 μm, Leica). Hippocampal slices were scanned with a confocal microscope. Obtained image stacks were reconstructed and analyzed using Image J (NIH).
Immunohistochemistry
Immunohistochemical analysis was performed as described before 34. Antibodies were used in a 1:1000 concentration. Anti-HDAC1, and anti-HDAC2 antibodies were purchased from Abcam. Anti-Ac-lysine, anti-Ac-H4K5, anit-Ac-H4K12, anti-Ac-H3K16, anti-CREB, anti-AKT and anti-CaMKIIα antibodies were purchased from Cell Signaling. Anti-Ac-α-tubulin (K40), anti-actin and anti-synaptophysin (SVP-38) antibodies were purchased from Sigma. Anti-NR2A and anti-NR2B were purchased from BD Biosciences. Anti-β-catenin, anti-EGR1, anti-c-FOS, anti-Brn1, anti-TLE4, anti-CDP, anti-ER81 and anti-GAPDH antibodies were purchased from Santa Cruz. Anti-NeuN antibody was purchased from Chemicon. Confocal images (1 μm) were scanned and subjected to three-dimensional reconstruction. LSMeta10 software (Zeiss) was used to calculate the mean synaptophysin intensity. Brain sections with the strongest intensity were scanned first. All other images included in the analysis were scanned using the same settings. Staining was quantified using LSMeta10 software (Zeiss).
Protein extraction and immunoblotting
The hippocampus and forebrain were collected and lysed in RIPA buffer. The lysates were incubated for 15 min on ice and centrifuged for 15 min at 15,000 × g at 4°C. The supernatant was collected as cytosolic protein extract. The lysates were subjected to 10% SDS-PAGE followed by immunoblotting.
Extraction of histone proteins
Hippocampus samples were collected and homogenized in 400 μL TX-buffer (50mM Tris-HCl, pH8.5, 5mM sodium butyrate). The pellets were resuspended in 0.2M HCl/TX buffer and incubated on ice for 30 mins. Samples were spun down at 14000 rpm and the histone-containing supernatants were subjected to western analysis.
Electrophysiological analysis
3–6 months old HDAC2OE, HDAC2KO or their littermates were killed by cervical dislocation, and hippocampi were rapidly dissected in iced oxygenated artificial CSF (ACSF). Transverse hippocampal slices, 400 μm thick were placed in a chamber and continuously perfused with oxygenated ACSF. A bipolar stimulating electrodes (0.002-inch-diameter nichrome wire; A-M Systems) placed in the stratum radiatum was used to elicit action potentials in CA3 axons. An ACSF-filled glass microelectrode with a resistance between 0.5 and 3 MΩ was placed in the stratum radiatum region of CA1 and was used to record the field excitatory post-synaptic potentials (fEPSP). Data were acquired using HEKA EPC10 and analyzed by patchmaster (HEKA). Peak fEPSP amplitudes from stimulators were required to be at least 2 mV, and stimulus intensity was set to produce 40% of the maximal response. Baseline responses were recorded for 20 min. fEPSP were evoked at the CA1 synapses by stimulating Schaffer collaterals at a low frequency (2 per min) to establish a stable baseline. Immediately following LTP induction with high-frequency stimulation (HFS, 100Hz, 1s), slices from HDAC2OE and control mice showed an increase in fEPSP slope and amplitude, suggesting that short-term potentiation (STP) occurs in all groups. For HDAC2KO and its control WT slices, LTP was induced by applying one train of stimuli at 100 Hz for 1s. For HDAC2OE and its control WT slices, LTP was induced by applying two trains of stimuli at 100Hz for 1s, with an interval of 20s.
Image-based EGR1 expression assay for cultured neurons
Embryonic cortices(E17) of EGR1-GFP BAC transgenic mice (Genesat Project) were isolated using standard procedures and triturated with trypsin/DNAse digestion. Cortical neurons were plated at a density of 10,000 cells per well in black/clear bottom plates coated with poly-D-lysine (Costar) in neurobasal medium (1.6% B27, 2% glutamax, 1% pen/strep and 5% heat inactivated fetal calf serum) and in neurobasal medium without serum 24 hrs later. Under these culture conditions, the percentage of glia was estimated to be in the range of 5–25%. On day 6, HDAC inhibitors or DMSO control (triplicates or quadruplicates) were added to the cultures for ~30hr. BDNF, KCl or forskolin were added to the cultures on day 7 for 8hr.
Cell were fixed in 4% PFA/4% sucrose in PBS. Fixative was washed away with PBS (3 wash cycles) and processed for EGR1-GFP imaging. Cells (3,000 – 5,000 per well) were imaged and analyzed with 5X objective using the Cellomics ArrayScan Image system. The built-in TargetActivation algorithm was optimized to measure average EGR1-GFP expression per cell (mean Fluorescence intensity per cell per well), using the Hoechst dye to mark cells. The data was normalized to control (DMSO addition).
After imaging, cells were processed for antibody staining: cells were permeabilized with 0.25% TritonX100 (10–15min). Triton was washed away by 3 PBS wash cycles, cells were blocked in PBS containing 10% goat or horse serum (1hr, 37°C). Cells were exposed to anti-acetyl-Lysine -histone H3 or H4 antibody. Then washed 5 times with PBS followed by secondary antibody conjugated to Alexa594, and Hoechst (1hr, RT). Secondary antibody was washed 5 times with PBS, and assayed on Cellomics ArrayScan Image system.
Chromatin immunoprecipitation (ChIP)
ChIP was performed using mouse forebrains fixed with 4% PFA solution and stored at −80°C prior to use. Brains were chemically cross-linked by the addition of one-tenth volume of fresh 11% formaldehyde solution for 15 min at room temperature, homogenized, resuspended, lysed in lysis buffers, and sonicated to solubilize and shear crosslinked DNA. Sonication conditions vary depending on cells, culture conditions, crosslinking, and equipment. We used a Misonix Sonicator 3000 and sonicated at power 7 for 10 × 30 s pulses (90 s pause between pulses) at 4°C while samples were immersed in an ice bath. The resulting whole-cell extract was incubated overnight at 4°C with 100 μL of Dynal Protein G magnetic beads that had been preincubated with 10 μg of the appropriate antibody. Beads were washed five times with RIPA buffer and one time with TE containing 50 mM NaCl. Bound complexes were eluted from the beads by heating at 65°C with occasional vortexing and crosslinking was reversed by overnight incubation at 65°C. Whole-cell extract DNA (reserved from the sonication step) was also treated for crosslink reversal. Immunoprecipitated DNA and whole-cell extract DNA were then purified by treatment with RNaseA, proteinase K, and multiple phenol:chloroform:isoamyl alcohol extractions. Purified DNA samples were normalized and subjected to PCR analysis. Antibodies used for pull downs were: anti-HDAC1 (#31263), anti-HDAC2(#12169) from Abcam; anti-AcH4 (#06-866), anti-AcH3(# 06-599) from Upstate. After IP, recovered chromatin fragments were subjected to semiquantitative PCR or Real-time PCR for 32–40 cycles using primer pairs specific for 150–250bp segments corresponding to mouse genes promoter regions (regions upstream of the start codon, near the first exon).
Real-time PCR
Real-time PCR was carried out with SYBR-Green-based reagents (Invitrogen, express SYBR GreenER) using a CFX96 real-time PCR Detection system (BioRad). The relative quantities of immunoprecipitated DNA fragments were calculated using the comparative CT method. Results were compared to a standard curve generated by serial dilutions of input DNA. Data were derived from three independent amplifications. Error bars represent standard deviations.
Primer sequences used for PCR:
- BDNF PI:
- 5′-TGATCATCACTCACGACCACG-3′
- 5′-CAGCCTCTCTGAGCCAGTTACG-3′
- BDNF PII:
- 5′-TGAGGATAGTGGTGGAGTTG-3′
- 5′-TAACCTTTTCCTCCTCC-3′
- BDNF PIV:
- 5′-GCGCGGAATTCTGATTCTGGTAAT-3′
- 5′GAGAGGGCTCCACGCTGCCTTGACG-3′
- CREB:
- 5′-CTACACCAGCTTCCCCGGT-3′
- 5′-ACGGAAACAGCCGAGCTC -3
- PKM zeta (100bp upstream of the PKMzeta mRNA initiation site 35, which contains a cAMP response element (CRE) consensus sequence):
- 5′-TGTTGAGTCTGGGCCCTC-3′
- 5′-CCTGGCCTCCGGACC-3′
- Creb binding protein (CBP):
- 5′-CGGGCAGGGGATGAG-3′
- 5′-GCGAGCCAGCGAGGA-3′
- Neurexin I:
- 5′-CAGGGCCTTTGTCCTGAATA-3′
- 5′-GCTTTGAATGGGGTTTTGAG-3′
- Neurexin III:
- 5′-ACTGAGAGCTAGCCACCCAGAC-3′
- 5′-TTGCCCATTTGTGAATTTGA-3′
- PGK1:
- 5′-ACATTTTGGCAACACCGRGAG-3′
- 5′-GAAGTAGCACGTCTCACTAGTCTCGTG-3′
- ATF4:
- 5′-GTGATAACCTGGCAGCTTCG-3′
- 5′-GGGGTAACTGTGGCGTTAGA-3′
- CaMKIIA:
- 5′-GACCTGGATGCTGACGAAG-3′
- 5′-AGGTGATGGTAGCCATCCTG-3′
- p21 (WAP/CIP1):
- 5′-CCACAGTTGGTCAGGGACAG-3′
- 5′-CCCTCCCCTCTGGGAATCTA-3′
- EGR-1:
- 5′-GTGCCCACCACTCTTGGAT-3′
- 5′-CGAATCGGCCTCTATTTCAA-3′
- Agrin:
- 5′-TTGTAACCAACAGGGGTTGC-3′
- 5′-AGTTGTGGCTAGGGGAGCAC-3′
- EGR-2:
- 5′-GGCTGCAAATCGTTCCTG-3′
- 5′-TCGGAGTATTTATGGGCAGGT-3′
- GLUTAMATE RECEPTOR 1 PRECURSOR (GLUR-1/ AMPA 1)
- 5′-GGAGGAGAGCAGAGGGAGAG-3′
- 5′-TTCCTGCAATTCCTTGCTTG-3′
- GLUR-2
- 5′-GCGGTGCTAAAATCGAATGC-3′
- 5′-ACAGAGAGGGGCAGGCAGT-3′
- PSD95:
- 5′-CCCCTACCCCTCCTGAGAAT-3′
- 5′-GAGGGGAAGGAGAAGGTTGG-3′
- HOMER1:
- 5′-CTGCCTGAGTGTCGTGGAAG-3′
- 3′-ATGATTTCACTCGCGCTGAC-3′
- P35:
- 5′-GAGGGAGGGCGCTGAGG-3′
- 5′-GCAGCTAGGGAGCTTCTGTCC-3′
- CDK5:
- 5′-CGCAGCCTGTTGGACTTTGT-3′
- 3′-GCGTTGCAGAGGAGGTGGTA-3′
- SHANK3:
- 5′-TTTTCCAGGTCCCAGTGGTG-3′
- 5′-CCTGCCCACAGTGTCACTCC-3′
- SVP:
- 5′-CTAGCCTCCCGAATGGAATG-3′
- 5′-CAGCAGCAGCATCAGCAATG-3′
- SYNAPSIN2
- 5′-GGCTTTCCTTCCCTCCACAC-3′
- 5′-TGTTAGCGAGGGAGCAGTGG-3′
- BETA-ACTIN:
- 5′-CCCATCGCCAAAACTCTTCA-3′
- 5′-GGCCACTCGAGCCATAAAAG-3′
- GAPDH:
- 5′-CTCCCAGGAAGACCCTGCTT-3′
- 5′-GGAACAGGGAGGAGCAGAGA-3′
- ARC:
- 5′-CAGCATAAATAGCCGCTGGT-3′
- 5′-GAGTGTGGCAGGCTCGTC-3′
- FOS:
- 5′-GAAAGCCTGGGGCGTAGAGT-3′
- 5′-CCTCAGCTGGCGCCTTTAT-3′
- CPG15:
- 5′-GCGAGATTTCGTTGAGATCG-3′
- 5′-GGGATGACACGGATTGATTTT-3′
- SNK:
- 5′-TTTCCCACGTCCAAAGTCAG-3′
- 5′-GCAGCGAAGCTTTAAATACGC-3′
- NR2A:
- 5′-TCGGCTTGGACTGATACGTG-3′
- 5′-AGGATAGACTGCCCCTGCAC-3′
- NR2B:
- 5′-CCTTAGGAAGGGGACGCTTT-3′
- 5′-GGCAATTAAGGGTTGGGTTC-3′
- TUBULIN:
- 5′-TAGAACCTTCCTGCGGTCGT-3′
- 5′-TTTTCTTCTGGGCTGGTCTC-3′
2.17 Immunoprecipitation
For preparation of nuclei, fresh mouse forebrains were washed with PBS, homogenized in 0.32 M sucrose, 1mM MgCl2, 0.5mM CaCl2 and1mM NaHCO3, and then were centrifuged at 710g for 10 min to get nuclei pellet. The nuclear envelope was removed by addition of 1% Triton X-100 and extracted with lysate buffer (1mM EDTA, 0.5mM EGTA, 10 mM Tris (pH8), 100mM NaCl, 0.1%Na-Deoxycholate, 0.5%N-lauroyl sarcosine). All buffers contained complete protease inhibitor (Roche Molecular Biochemicals). For immunoprecipitation, 2–5μg antibody were added into the nuclear lysates and incubate for 1hr at 4C, then 60 uL Sepharose beads conjected with protein-G (GE healthcare Bio-Sciences AB) were added and incubated for 4 hrs. Beads were spin down at 2000 rpm and washed 4 times with 1 ml RIPA buffer (50 mM Hepes (pH7.6),1mM EDTA, 0.7% DOC, 1% NP-40, 0.5M LiCl). Protein were eluted by sample buffer (containing 1% SDS, 2% 2-Mercaptoethanol) and analyzed.
Antibodies used here: HDAC1, HDAC2, mSin3A from Abcam; MTA-2, CoREST from Upstate.
Supplementary Material
1
Acknowledgments
We thank Ed Scolnick, Dan Fass, Pamela Sklar, Tracey Petryshen, Benjamin Adam Samuels, Andre Fischer, Christopher Frank, Dohoon Kim, Susan Su, Yasunori Hayashi for advice and critical reading of the manuscript; Tracey Petryshen, Ann Graybiel, Jill Crittenden, Michael C. Lewis for providing the T-maze behaviour paradigm. Rachael Neve for providing tdTomato HSV. Funding provided by a grant from NINDS (2 ROI NS051874) to L.-H. T.; research fund from the Stanley Center for Psychiatric research to L.-H.T. and S.J.H.; the NARSAD Foundation and a NCI Contract Grant N01-CO-12400 to S.J.H.; fellowship from Damon-Runyon Cancer Research Foundation and The Dutch Cancer Society (KWF) to J.H.D.; R.J. is supported by NIH grants(5-RO1-CA087869, 5-R37-CA084198, 5-RO1-HD0445022); R.A.D. is supported by the Robert A. and Renee E. Belfer Institute for Applied Cancer Science. The content of this publication does not necessarily reflect the views or policies of the Department of Health and Human Service, nor does mention of trade names, commercial products or organizations imply endorsement by the U.S. Government. L.-H. T. is an investigator of the Howard Hughes Medical Institute.
Footnotes
Full methods are included in the supplemental information.
Note: Any requests for Floxed HDAC2 mice, contact R.A.D.; for HDAC1/2OE mice, contact R.J.
Author Contributions
L.-H.T designed, directed and coordinated the project. J.-S.G designed and performed the behaviour tests, biochemical assays and morphological analysis in HDACi treated animals and genetically modified animal models. S.J.H, R.M, J.E.B contributed to the generation and characterization of HDACi. E.G. generated HDAC1/2OE mice in R.J. laboratory; J.-H.D generated HDAC2KO mice in R.A.D laboratory; N.J, W.X.Y, Y.Z., E.G. contributed to behaviour tests and biochemical analysis; J.G. performed electrophysiological analysis; T.J.F.N. performed imaging assay for cultured neurons. Manuscript was written by J.-S.G, S.J.H, L.-H.T and commented by all the authors.
References
- 1.West AE, et al. Calcium regulation of neuronal gene expression. Proc Natl Acad Sci U S A. 2001;98 (20):11024–11031. doi: 10.1073/pnas.191352298. [DOI] [PMC free article] [PubMed] [Google Scholar]
- 2.Guan Z, et al. Integration of long-term-memory-related synaptic plasticity involves bidirectional regulation of gene expression and chromatin structure. Cell. 2002;111 (4):483–493. doi: 10.1016/s0092-8674(02)01074-7. [DOI] [PubMed] [Google Scholar]
- 3.Kurdistani SK, Grunstein M. Histone acetylation and deacetylation in yeast. Nat Rev Mol Cell Biol. 2003;4 (4):276–284. doi: 10.1038/nrm1075. [DOI] [PubMed] [Google Scholar]
- 4.Goldberg AD, Allis CD, Bernstein E. Epigenetics: a landscape takes shape. Cell. 2007;128 (4):635–638. doi: 10.1016/j.cell.2007.02.006. [DOI] [PubMed] [Google Scholar]
- 5.Alarcon JM, et al. Chromatin acetylation, memory, and LTP are impaired in CBP+/− mice: a model for the cognitive deficit in Rubinstein-Taybi syndrome and its amelioration. Neuron. 2004;42 (6):947–959. doi: 10.1016/j.neuron.2004.05.021. [DOI] [PubMed] [Google Scholar]
- 6.Korzus E, Rosenfeld MG, Mayford M. CBP histone acetyltransferase activity is a critical component of memory consolidation. Neuron. 2004;42 (6):961–972. doi: 10.1016/j.neuron.2004.06.002. [DOI] [PMC free article] [PubMed] [Google Scholar]
- 7.Levenson JM, et al. Regulation of histone acetylation during memory formation in the hippocampus. J Biol Chem. 2004;279 (39):40545–40559. doi: 10.1074/jbc.M402229200. [DOI] [PubMed] [Google Scholar]
- 8.Kumar A, et al. Chromatin remodeling is a key mechanism underlying cocaine-induced plasticity in striatum. Neuron. 2005;48 (2):303–314. doi: 10.1016/j.neuron.2005.09.023. [DOI] [PubMed] [Google Scholar]
- 9.Vecsey CG, et al. Histone deacetylase inhibitors enhance memory and synaptic plasticity via CREB:CBP-dependent transcriptional activation. J Neurosci. 2007;27 (23):6128–6140. doi: 10.1523/JNEUROSCI.0296-07.2007. [DOI] [PMC free article] [PubMed] [Google Scholar]
- 10.Fischer A, et al. Recovery of learning and memory is associated with chromatin remodelling. Nature. 2007;447 (7141):178–182. doi: 10.1038/nature05772. [DOI] [PubMed] [Google Scholar]
- 11.Bruserud O, et al. Histone deacetylase inhibitors in cancer treatment: a review of the clinical toxicity and the modulation of gene expression in cancer cell. Curr Pharm Biotechnol. 2007;8 (6):388–400. doi: 10.2174/138920107783018417. [DOI] [PubMed] [Google Scholar]
- 12.Tsankova NM, et al. Sustained hippocampal chromatin regulation in a mouse model of depression and antidepressant action. Nat Neurosci. 2006;9 (4):519–525. doi: 10.1038/nn1659. [DOI] [PubMed] [Google Scholar]
- 13.Renthal W, et al. Histone deacetylase 5 epigenetically controls behavioral adaptations to chronic emotional stimuli. Neuron. 2007;56 (3):517–529. doi: 10.1016/j.neuron.2007.09.032. [DOI] [PubMed] [Google Scholar]
- 14.Hockly E, et al. Suberoylanilide hydroxamic acid, a histone deacetylase inhibitor, ameliorates motor deficits in a mouse model of Huntington’s disease. Proc Natl Acad Sci U S A. 2003;100 (4):2041–2046. doi: 10.1073/pnas.0437870100. [DOI] [PMC free article] [PubMed] [Google Scholar]
- 15.Ferrante RJ, et al. Histone deacetylase inhibition by sodium butyrate chemotherapy ameliorates the neurodegenerative phenotype in Huntington’s disease mice. J Neurosci. 2003;23 (28):9418–9427. doi: 10.1523/JNEUROSCI.23-28-09418.2003. [DOI] [PMC free article] [PubMed] [Google Scholar]
- 16.Witter DJ, et al. Optimization of biaryl Selective HDAC1 & 2 Inhibitors (SHI-1:2) Bioorg Med Chem Lett. 2008;18 (2):726–731. doi: 10.1016/j.bmcl.2007.11.047. [DOI] [PubMed] [Google Scholar]
- 17.Guardiola AR, Yao TP. Molecular cloning and characterization of a novel histone deacetylase HDAC10. J Biol Chem. 2002;277 (5):3350–3356. doi: 10.1074/jbc.M109861200. [DOI] [PubMed] [Google Scholar]
- 18.Hubbert C, et al. HDAC6 is a microtubule-associated deacetylase. Nature. 2002;417 (6887):455–458. doi: 10.1038/417455a. [DOI] [PubMed] [Google Scholar]
- 19.Salisbury CM, Cravatt BF. Activity-based probes for proteomic profiling of histone deacetylase complexes. Proc Natl Acad Sci U S A. 2007;104 (4):1171–1176. doi: 10.1073/pnas.0608659104. [DOI] [PMC free article] [PubMed] [Google Scholar]
- 20.Roberson ED, et al. Reducing endogenous tau ameliorates amyloid beta-induced deficits in an Alzheimer’s disease mouse model. Science. 2007;316 (5825):750–754. doi: 10.1126/science.1141736. [DOI] [PubMed] [Google Scholar]
- 21.Luikenhuis S, Giacometti E, Beard CF, Jaenisch R. Expression of MeCP2 in postmitotic neurons rescues Rett syndrome in mice. Proc Natl Acad Sci U S A. 2004;101 (16):6033–6038. doi: 10.1073/pnas.0401626101. [DOI] [PMC free article] [PubMed] [Google Scholar]
- 22.Martin SJ, Grimwood PD, Morris RG. Synaptic plasticity and memory: an evaluation of the hypothesis. Annu Rev Neurosci. 2000;23:649–711. doi: 10.1146/annurev.neuro.23.1.649. [DOI] [PubMed] [Google Scholar]
- 23.Finkbeiner S, et al. CREB: a major mediator of neuronal neurotrophin responses. Neuron. 1997;19 (5):1031–1047. doi: 10.1016/s0896-6273(00)80395-5. [DOI] [PubMed] [Google Scholar]
- 24.Lunyak VV, et al. Corepressor-dependent silencing of chromosomal regions encoding neuronal genes. Science. 2002;298 (5599):1747–1752. doi: 10.1126/science.1076469. [DOI] [PubMed] [Google Scholar]
- 25.Ballas N, et al. REST and its corepressors mediate plasticity of neuronal gene chromatin throughout neurogenesis. Cell. 2005;121 (4):645–657. doi: 10.1016/j.cell.2005.03.013. [DOI] [PubMed] [Google Scholar]
- 26.Nott A, et al. S-Nitrosylation of histone deacetylase 2 induces chromatin remodelling in neurons. Nature. 2008;455 (7211):411–415. doi: 10.1038/nature07238. [DOI] [PubMed] [Google Scholar]
- 27.Hassig CA, et al. A role for histone deacetylase activity in HDAC1-mediated transcriptional repression. Proc Natl Acad Sci U S A. 1998;95 (7):3519. doi: 10.1073/pnas.95.7.3519. [DOI] [PMC free article] [PubMed] [Google Scholar]
- 28.Montgomery RL, et al. Histone deacetylases 1 and 2 redundantly regulate cardiac morphogenesis, growth, and contractility. Genes Dev. 2007;21 (14):1790–1802. doi: 10.1101/gad.1563807. [DOI] [PMC free article] [PubMed] [Google Scholar]
- 29.Kim D, et al. Deregulation of HDAC1 by p25/Cdk5 in neurotoxicity. Neuron. 2008;60 (5):803–817. doi: 10.1016/j.neuron.2008.10.015. [DOI] [PMC free article] [PubMed] [Google Scholar]
- 30.Radulovic J, Ruhmann A, Liepold T, Spiess J. Modulation of learning and anxiety by corticotropin-releasing factor (CRF) and stress: differential roles of CRF receptors 1 and 2. J Neurosci. 1999;19 (12):5016. doi: 10.1523/JNEUROSCI.19-12-05016.1999. [DOI] [PMC free article] [PubMed] [Google Scholar]
- 31.Morris RG, Garrud P, Rawlins JN, O’Keefe J. Place navigation impaired in rats with hippocampal lesions. Nature. 1982;297 (5868):681. doi: 10.1038/297681a0. [DOI] [PubMed] [Google Scholar]
- 32.Breslow R, Marks P, Rifkind R, Jursic B. Novel potent inducers of terminal differentiation and methods thereof. 1993. [Google Scholar]
- 33.Ramon-Molinier E. Contemporary Research Methods in Neuroanatomy Synaptic Plasticity: Multiple Forms and Mechanisms. Springer; Berlin, Heidelberg, New York: 1970. [Google Scholar]
- 34.Guan JS, et al. Interaction with vesicle luminal protachykinin regulates surface expression of delta-opioid receptors and opioid analgesia. Cell. 2005;122 (4):619. doi: 10.1016/j.cell.2005.06.010. [DOI] [PubMed] [Google Scholar]
- 35.Hernandez AI, et al. Protein kinase M zeta synthesis from a brain mRNA encoding an independent protein kinase C zeta catalytic domain. Implications for the molecular mechanism of memory. J Biol Chem. 2003;278 (41):40305. doi: 10.1074/jbc.M307065200. [DOI] [PubMed] [Google Scholar]
Associated Data
This section collects any data citations, data availability statements, or supplementary materials included in this article.
Supplementary Materials
1