Geographic Variations in Outpatient Antibiotic Prescribing in Older Adults (original) (raw)
. Author manuscript; available in PMC: 2013 Oct 22.
Abstract
Background
Consequences of antibiotic overuse are substantial, especially among older adults who are more susceptible to adverse reactions. Findings on variation in antibiotic prescribing can target policy efforts to focused areas; however, little is known among older adults.
Methods
Using 2007–2009 Medicare Part D data (comprising 1.0–1.1 million patients per year), we examined geographic variations in antibiotic use among older adults in 306 Dartmouth hospital-referral regions (HRRs), 50 states and DC, and 4 national regions (South, West, Midwest, and Northeast). We also examined seasonal variation in antibiotic use across four regions. Differences in patient demographics, insurance status, and clinical characteristics were adjusted across regions.
Results
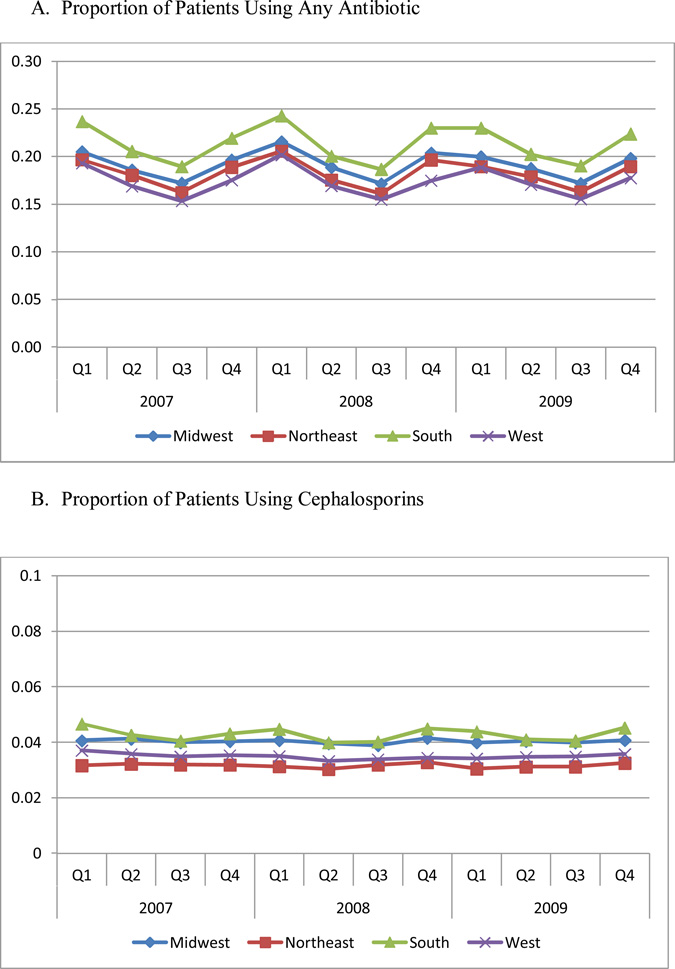
Substantial geographic and seasonal variation existed across regions, after adjusting for population characteristics. These differences could not be explained by differences in the prevalence of the underlying conditions. For example, the ratios of 75th and 25th percentiles of antibiotic spending are 1.31 across states and 1.32 across hospital-referral regions. The South saw the highest antibiotic use, where 21.4% of patients per quarter used an antibiotic, compared to 17.4% in the West (P<0.01), the lowest region. Regardless of region, the rate of antibiotic use was highest in the first quarter (20.9% in January–March) and lowest in the third quarter (16.9% July–September; P<0.01).
Conclusions
Areas with high rates of antibiotic use may benefit from targeted programs to reduce unnecessary antibiotic use. Quality improvement programs can set attainable targets using the low-prescribing areas as reference, particularly targeting to older adults.
Overuse of antibiotics is common and the consequences of overuse are substantial both clinically and financially. Not only can overuse lead to unnecessary spending for prescription drugs, it can also increase the risks of adverse effects such as side effects and population-level antimicrobial resistance.1 Older patients might be more susceptible to adverse drug reactions due to an increased burden of comorbidity and subject to more severe adverse outcomes of antibiotic overuse.2–5 Different regions have different patterns of antimicrobial resistance, which might be due to the regional variation in practice patterns of antibiotic use.
There are some studies of antibiotic variation in the non-Medicare population, but relatively little is known about the antibiotic prescribing patterns among older adults. As national Medicare Part D data have become available, research on regional variation in pharmacy prescribing has emerged.6–8 However, no study has examined variation in antibiotic use among older adults using national Part D data.
Regional variation in antibiotics has important policy implications. Many programs have aimed to reduce inappropriate antibiotic use in ambulatory care settings,9 but there is ample room for additional reductions, especially in the overuse of antibiotics for acute respiratory tract infections and other unnecessary conditions.10 Findings on variation in antibiotic prescribing can guide policy efforts to improve more targeted areas and/or specific therapeutic classes of antibiotics.
Using 2007–2009 Medicare Part D data, we examine geographic variations in antibiotic use in older adults at three levels: 306 Dartmouth hospital-referral regions (HRRs), 50 states and DC, and four aggregated regions (South, West, Midwest, and Northeast). In addition, we examine the quarterly change in antibiotic use across the four regions. In winter months, some antibiotic use could be from inappropriate use due to an increased rate of nonspecific respiratory infections and other acute respiratory tract infections that do not require antibiotic treatment. Examining how seasonal patterns of antibiotic use relate to geographic variations can help us understand when and where inappropriate use is likely to occur. In addition, we compare the use of antibiotics by each subclass and evaluate how regional and seasonal variations might be driven by a specific class, especially the more expensive and broad-spectrum antibiotics.
METHODS
Data source and study population
From the Centers for Medicare & Medicaid Services (CMS), we obtained 2007–2009 prescription drug event data for a 5% random sample of Medicare beneficiaries. The Medicare Part D prescription drug event data is the most comprehensive database from a national prescription drug perspective. We constrained our study sample to beneficiaries aged 65 and older because antibiotic prescribing may be different for younger adults who are eligible for Medicare due to disability. For each year of the three-year study period, we identified beneficiaries who were continuously enrolled in a Part D plan for the entire year so we could observe their full-year drug use and calculate rate of antibiotic use in the year (n=998,703 in 2007; 1,047,467 in 2008; 1,086,798 in 2009; and 825,977 in all three years).
Geographic areas
We evaluated the geographic variations at three levels of areas on the basis of the beneficiary’s ZIP Code of residence: 306 Dartmouth hospital-referral regions (HRRs), 50 states and DC, and four aggregated regions (Northeast, Midwest, South, and West). HRRs were defined by where patients were referred for major cardiovascular surgical procedures and for neurosurgery and are often used as proxy for regional health care markets. Many programs have aimed to improve appropriate antibiotic use and reduce inappropriate use in ambulatory care settings. Since some of these programs are efforts as a result of policy at the state level, we also examined variations in antibiotic use across states. Finally, we attempted to link seasonal data with the aggregated level of regional data for the prevalence of some conditions. These four areas were defined using the US Census region definitions, which are: Northeast (CT, ME, MA, NH, NJ, NY, PA, RI, VT), Midwest (IL, IN, IA, KS, MI, MN, MO, NE, ND, OH, SD, WI), South (AL, AR, DE, DC, FL, GA, KY, LA, MD, MS, NC, OK, SC, TN, TX, VA, WV), and West (AK, AZ, CA, CO, HI, ID, MT, NV, NM, OR, UT, WA, WY).
Outcomes
We defined several measures for antibiotic use per-person-per-year or per-person-per-quarter: proportion of patients using an antibiotic, mean number of antibiotic prescriptions filled, and mean total gross spending for antibiotics. In addition, we measured the proportions of patients using each major antibiotic therapeutic subclass, including cephalosporins, penicillins, tetracyclines, quinolones, and macrolides. Quinolones and the most commonly-used macrolides are mainly brand-name and broad-spectrum antibiotics.12, 13
Prevalence rates of three conditions
To check whether regions with high rates of antibiotic use are likely due to higher prevalence of conditions that require antibiotic treatment, we identified three conditions: bacterial pneumonia (ICD-9 codes: 481, 482, 483, 485, 486) which should almost always require antibiotics, acute nasopharyngitis (common cold) and nonspecific upper respiratory infections (ICD-9 codes: 460, 465) for which antibiotics typically should not be used because they are often viral infections, and other acute respiratory infections (ARIs; ICD-9 codes: 461, 473, 462, 463, 466, 490). Other ARIs include sinusitis (ICD-9 461, 473), pharyngitis and tonsillitis (ICD-9 462, 463), and bronchitis (ICD-9 466, 490), for which antibiotics may have some indications but are often not necessary. For each region and each quarter, we calculated the percentage of patients who received the above diagnoses using Medicare data. We also conducted a sensitivity analysis by using National Ambulatory Medical Care Survey (NAMCS) data to calculate the prevalence of the three conditions by quarter and the four aggregated regions.
Adjustment variables
In order to adjust for the difference in population mix across regions, we adjusted for three major categories of beneficiary-level variables that might influence antibiotic prescribing patterns – patient demographics, insurance status, and clinical characteristics. Patient demographics included age with 5 year increments tied to 65 (65–69, 70–74, 75–79, 80–84, 85–89, 90–94, 95+), gender (1=female; 0=male), and race/ethnicity (non-Hispanic White, non-Hispanic Black, Hispanic, Asian, and other) based on patient self-report and verified by first and last name algorithms.14
Insurance status included an indicator for being in a stand-alone Part D or Medicare-Advantage Part D plan, whether the beneficiary had supplementary drug coverage (e.g., having generic-coverage in the standard “donut hole” gap), and whether the beneficiary had dual Medicaid coverage or federal low-income subsidies for Part D program where the beneficiary only paid zero or a small copayment for their drugs.
Clinical characteristics included an indicator for nursing home institutionalization (defined as having 90 days nursing home stay), and the prospective prescription drug hierarchical condition category (RxHCC) scores calculated using prior year diagnosis and spending.15 CMS-RxHCC is the beneficiary risk adjusters used by CMS to adjust payment to plans for pharmacy costs and also used as a proxy for health status.
Statistical analysis
We plotted the proportion of patients using any antibiotic as well as each therapeutic subclass, by aggregated region and quarter. We conducted regression analysis to test whether the regional and seasonal differences in these proportions are statistically significant.
We used 2009 data to report geographic variations regarding proportion of patients using an antibiotic, mean number of antibiotic prescriptions filled, and mean total gross spending for antibiotics per person per year, at state and HRR levels. To adjust for population characteristics in the different regions, we conducted individual level regression for each outcome. Each regression includes regional indicator variables (state or HRR), year indicators, and all the above adjustment variables. For each outcome, we calculated the predicted value for each region using the estimating equation at national averages for the covariates, thus capturing variation for the region after adjusting for the variation in the adjustment variables across regions. After making these adjustments we created maps to show variation in the adjusted numbers across regions in the US and reported variation statistics such as ratios of 75th to 25th percentiles, and coefficient of variation (COV), which is used to compare variation across distributions with different means.
RESULTS
Rates of antibiotic use by region and quarter
Figure 1 Panel A presents the proportion of patients using any antibiotic, by region and quarter. The rate of patients taking antibiotics was the highest in the South and lowest in the West. The rate in the South was 4.0 percentage points higher than West (21.4% vs. 17.4%, respectively, P<0.01). The rate in Midwest (19.2%) was 1.8 percentage points higher than West (P=0.01). We also observed significant seasonal differences in antibiotic use. The rate of antibiotic use was highest in the first three months of the year (quarter 1). Quarter 3 (July, August, and September), which had the lowest rate of antibiotic use, had a rate that was 4.0 percentage points lower than quarter 1 (16.9% vs. 20.9%, respectively, P<0.01). Including an interaction term between region and quarter in our regression model reveals that seasonal patterns of variation were similar across regions, but were slightly larger in the South than in other regions. For example, as compared to the South, which had the largest seasonal variation (the difference between the first and third quarters was 5.0 percentage points), the difference in utilization between the first and third quarter was 1.3 percentage points lower in the Northeast (P=0.017), 1.3 percentage points lower in the Midwest (P=0.016), and 0.8 percentage points lower in the West (P=0.123).
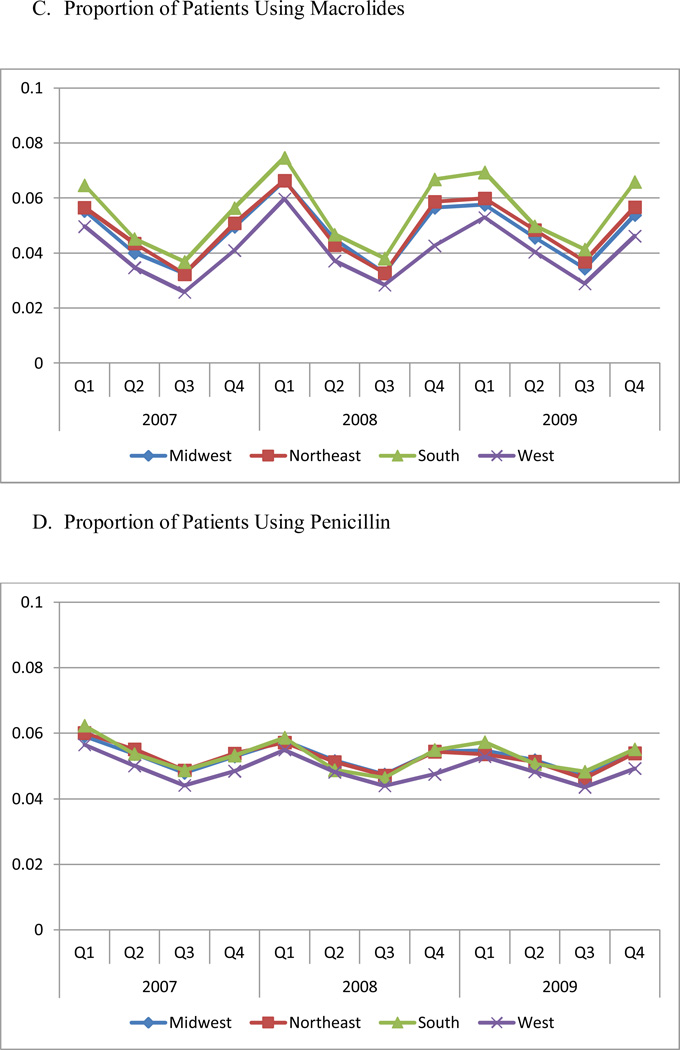
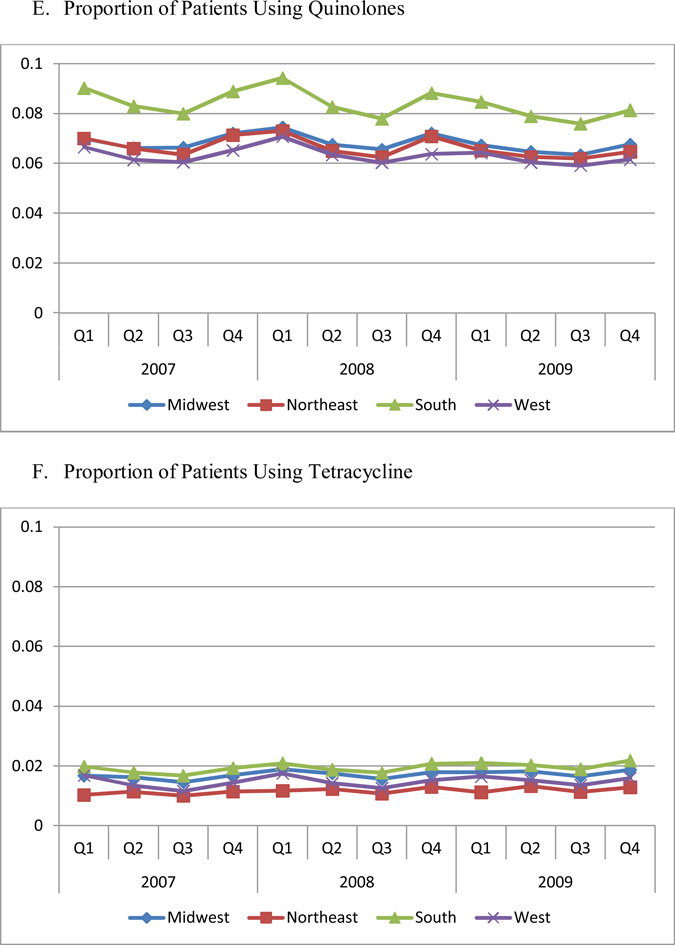
Figure 1. Proportion of Patients Using Any Antibiotic, By Region and Quarter.
Each of four regions includes the following states: Northeast: CT, ME, MA, NH, NJ, NY, PA, RI, VT; Midwest: IL, IN, IA, KS, MI, MN, MO, NE, ND, OH, SD, WI; South: AL, AR, DE, DC, FL, GA, KY, LA, MD, MS, NC, OK, SC, TN, TX, VA, WV; West: AK, AZ, CA, CO, HI, ID, MT, NV, NM, OR, UT, WA, WY.
Figure 1 Panels B through E present the proportion of patients using each antibiotic therapeutic class. The South had the highest utilization rate for every class of drugs (P<0.05), compared to other regions. The West had the lowest utilization of macrolides, penicillin, and quinolones (P<0.01). With the exception of cephalosporins, each drug class exhibited a significant seasonal trend, with the highest utilization occurring in quarter 1, and the lowest in quarter 3.
In addition, the regional difference was mainly driven by two expensive, broad-spectrum antibiotic classes, quinolones and macrolides, because of higher prevalence of use of these two classes (Figure 1). The quarterly trend was also mainly driven by the quarterly change in the use of quinolones and macrolides.
Prevalence rates of three conditions by region and quarter
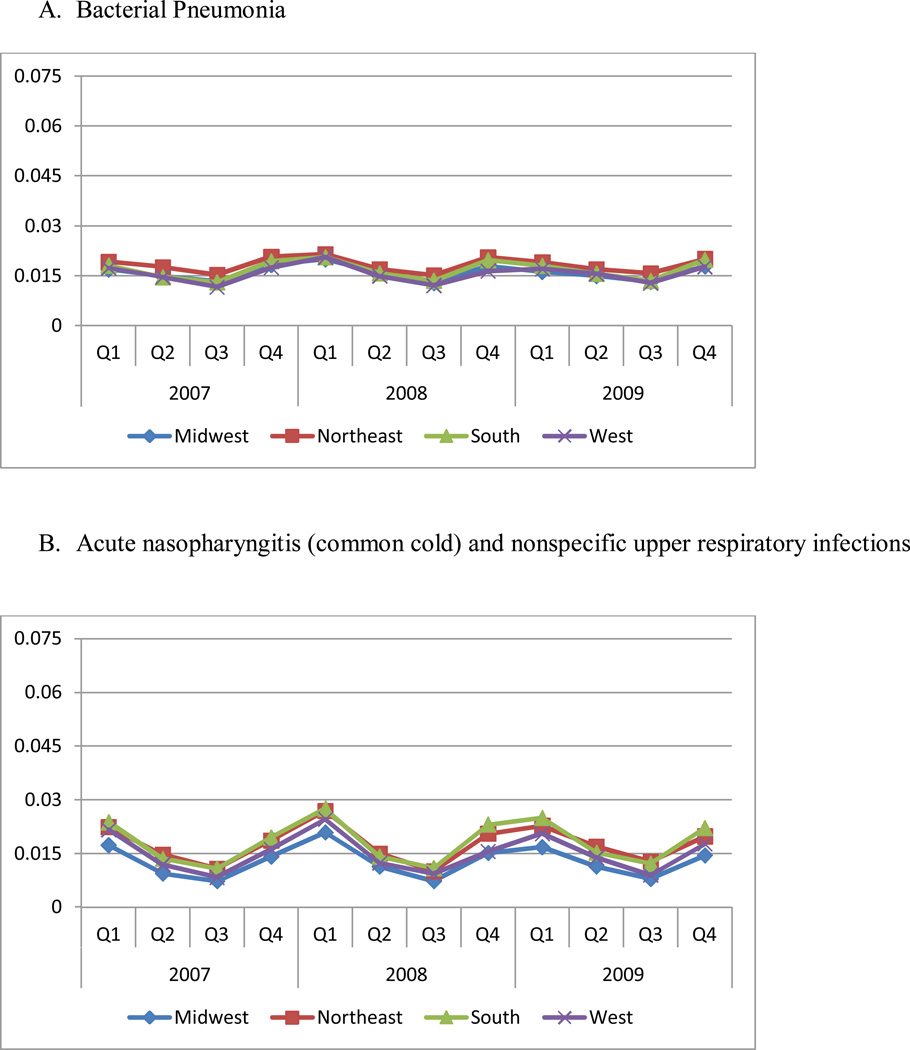
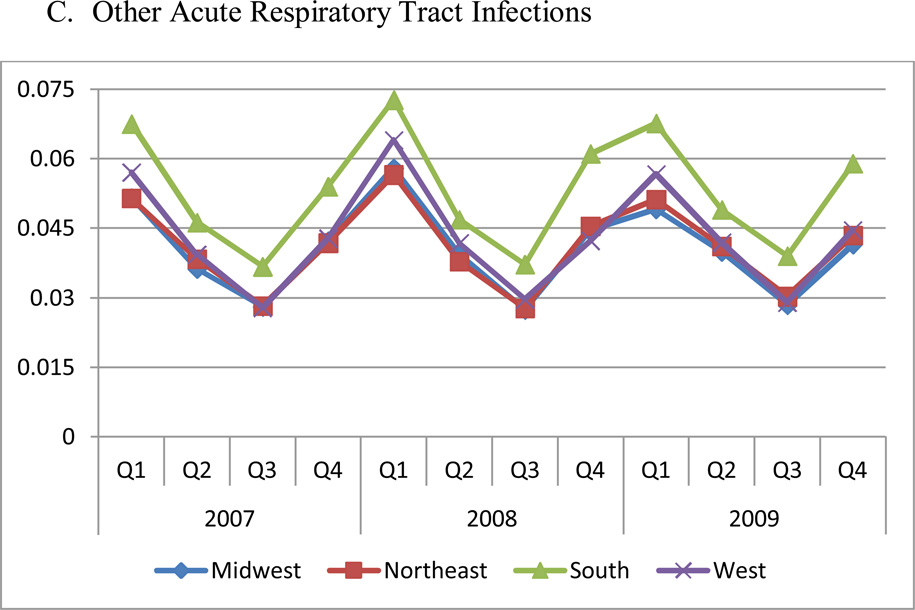
The regional and quarterly difference in antibiotic use does not appear to be explained by differences in prevalence rates of the underlying conditions, as shown in Figure 2. The prevalence rates of three conditions in the NAMCS data confirm these results (data not shown). The Northeast had the highest prevalence of pneumonia despite having the lowest utilization of antibiotics (P<0.05). On the other hand, the South had the highest rates of non-specific upper respiratory infections, which are not necessarily conditions where antibiotics should be used.
Figure 2. Prevalence Rates of Three Conditions by Region and Quarter.
Panel A. Bacterial pneumonia
Panel B. Acute nasopharyngitis (common cold) and nonspecific upper respiratory infections
Panel C. Other acute respiratory infections
Notes: Bacterial pneumonia was defined as ICD-9 codes: 481, 482, 483, 485, 486, which should almost always require antibiotics; acute nasopharyngitis (common cold) and nonspecific upper respiratory infections were defined as ICD-9 codes: 460, 465, for which antibiotics typically should not be used; other acute respiratory infections were defined as ICD-9 codes: 461, 473, 462, 463, 466, 490, including sinusitis (ICD-9 461, 473), pharyngitis and tonsillitis (ICD-9 462, 463), and bronchitis (ICD-9 466, 490).
The sample in this figure excludes patients enrolled in MA-PD plans, since no medical claims information is available for these patients. Each of four regions includes the following states: Northeast: CT, ME, MA, NH, NJ, NY, PA, RI, VT; Midwest: IL, IN, IA, KS, MI, MN, MO, NE, ND, OH, SD, WI; South: AL, AR, DE, DC, FL, GA, KY, LA, MD, MS, NC, OK, SC, TN, TX, VA, WV; West: AK, AZ, CA, CO, HI, ID, MT, NV, NM, OR, UT, WA, WY.
State variation in rates, counts and spending for antibiotics
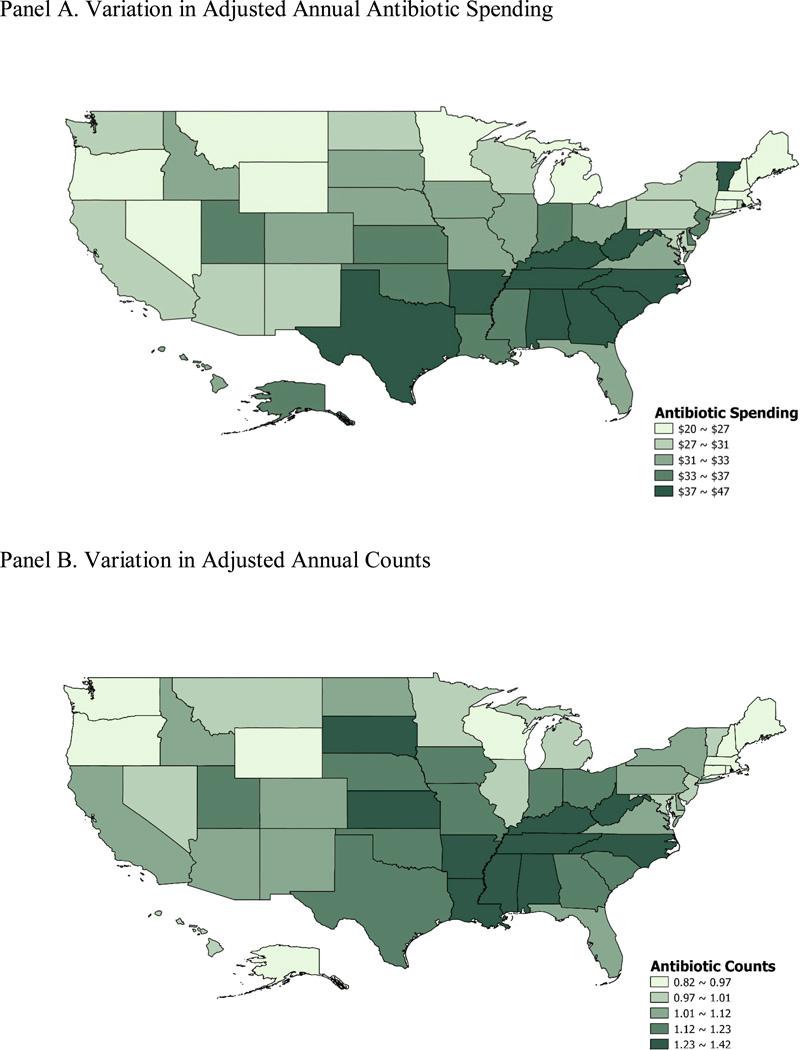
Table 1 presents variations in total antibiotic spending, counts and proportion of patients using each drug class across states. Geographic variations were similar across years, so we only reported numbers in 2009. Overall, we found a high degree of variation in the use of antibiotics across states, with coefficients of variation of 0.17 for spending, 0.14 for counts and 0.09 for the rate of use. The ratios of 75th and 25th percentiles of adjusted annual antibiotic spending are 1.31 across states. Similar to our findings at the aggregated regional level, we found that the highest utilization and spending occurred in southern states including Alabama and Mississippi, while the lowest utilization and spending occurred in Oregon, Wyoming, Maine and New Hampshire (Figure 3). The variation in proportion of patients using quinolones and macrolides is higher that variation in using penicillin and overall antibiotics.
Table 1.
Variation in Adjusted Annual Antibiotic Spending, Counts and Proportion of Use per Person in 2009 in Different States
| TotalAntibioticSpending | Counts ofAntibiotics | Proportion of Patients Using An Antibiotic* | ||||||
|---|---|---|---|---|---|---|---|---|
| AnyAntibiotic | Quinolone | Macrolide | Penicillin | Cephalosporin | Tetracycline | |||
| Min | 19.94 | 0.82 | 0.39 | 0.15 | 0.12 | 0.12 | 0.08 | 0.03 |
| 10th | 26.23 | 0.93 | 0.42 | 0.17 | 0.13 | 0.14 | 0.09 | 0.04 |
| 25th | 27.54 | 0.98 | 0.44 | 0.18 | 0.14 | 0.15 | 0.11 | 0.04 |
| 50th | 31.89 | 1.04 | 0.46 | 0.20 | 0.16 | 0.16 | 0.13 | 0.05 |
| 75th | 36.18 | 1.20 | 0.50 | 0.22 | 0.17 | 0.17 | 0.15 | 0.06 |
| 90th | 39.45 | 1.31 | 0.53 | 0.25 | 0.20 | 0.17 | 0.16 | 0.08 |
| Max | 46.54 | 1.42 | 0.57 | 0.26 | 0.20 | 0.19 | 0.18 | 0.10 |
| Mean | 32.14 | 1.09 | 0.47 | 0.20 | 0.16 | 0.16 | 0.13 | 0.05 |
| s.d. | 5.38 | 0.16 | 0.04 | 0.03 | 0.02 | 0.01 | 0.03 | 0.02 |
| 75th/25th | 1.31 | 1.23 | 1.13 | 1.20 | 1.21 | 1.11 | 1.36 | 1.37 |
| COV | 0.17 | 0.14 | 0.09 | 0.14 | 0.13 | 0.08 | 0.21 | 0.28 |
Figure 3. Quintiles of Adjusted Annual Antibiotic Spending and Counts According to State in 2009.
Panel A. Variation in Adjusted Annual Antibiotic Spending
Panel B. Variation in Adjusted Annual Counts
HRR-level variation in rates, counts and spending for antibiotics
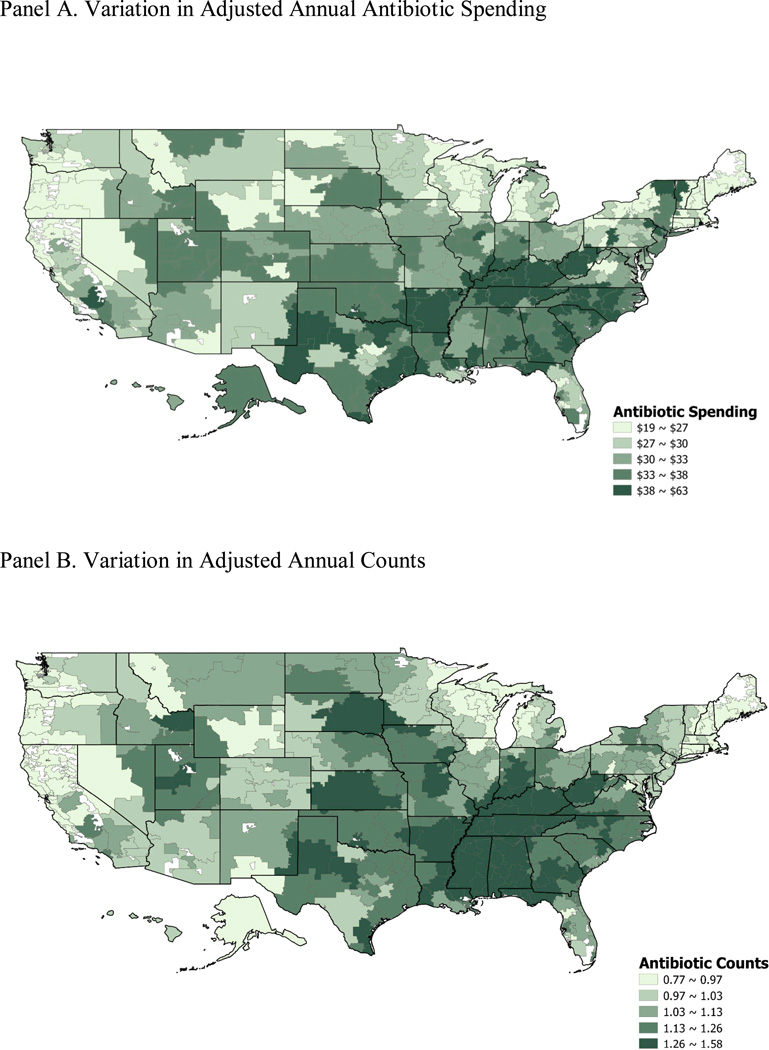
Table 2 presents variations in total antibiotic spending, counts, and the rates of utilization across HRRs. Variation at the HRR level is slightly larger than variation at the state level for antibiotic spending and counts, with coefficients of variation of 0.21 and 0.15, respectively, partially due to smaller sample size at the HRR level compared to state level. HRRs in the south used more antibiotics in general (Figure 4).
Table 2.
Variation in Adjusted Annual Total Antibiotic Spending, Counts and Proportion of Use per Person in 2009 in Different Hospital-referral Regions
| TotalAntibioticSpending | Counts ofAntibiotics | Proportion of Patients Using An Antibiotic* | ||||||
|---|---|---|---|---|---|---|---|---|
| AnyAntibiotic | Quinolone | Macrolide | Penicillin | Cephalosporin | Tetracycline | |||
| Min | 18.91 | 0.77 | 0.38 | 0.14 | 0.08 | 0.11 | 0.07 | 0.02 |
| 10th | 24.74 | 0.90 | 0.42 | 0.17 | 0.13 | 0.14 | 0.09 | 0.03 |
| 25th | 27.42 | 0.98 | 0.45 | 0.19 | 0.14 | 0.15 | 0.11 | 0.04 |
| 50th | 31.94 | 1.08 | 0.47 | 0.21 | 0.16 | 0.16 | 0.13 | 0.05 |
| 75th | 36.15 | 1.21 | 0.51 | 0.23 | 0.18 | 0.17 | 0.14 | 0.07 |
| 90th | 41.86 | 1.34 | 0.54 | 0.25 | 0.19 | 0.18 | 0.17 | 0.08 |
| Max | 62.51 | 1.58 | 0.60 | 0.29 | 0.25 | 0.21 | 0.21 | 0.18 |
| Mean | 32.65 | 1.10 | 0.48 | 0.21 | 0.16 | 0.16 | 0.13 | 0.06 |
| s.d. | 6.99 | 0.17 | 0.05 | 0.03 | 0.03 | 0.02 | 0.03 | 0.02 |
| 75th/25th | 1.32 | 1.24 | 1.14 | 1.25 | 1.23 | 1.15 | 1.34 | 1.55 |
| COV | 0.21 | 0.15 | 0.10 | 0.15 | 0.17 | 0.11 | 0.22 | 0.34 |
Figure 4. Quintiles of Adjusted Annual Antibiotic Spending and Counts According to Hospital-Referral Region in 2009.
Panel A. Variation in Adjusted Annual Antibiotic Spending
Panel B. Variation in Adjusted Annual Counts
DISCUSSION
In this paper, we found substantial variation in the use of antibiotics across regions at all levels, after adjusting for population characteristics. These regional differences did not appear to be simply explained by differences in the prevalence of the underlying conditions, since we found that regions with high utilization of antibiotics often had lower rates of diagnosis with pneumonia.
Compared with previous studies that examined geographic patterns of the use of all medications, we found that variation in the use of antibiotics was substantially larger.6, 8 For example, Zhang and colleagues found that the ratio of the 75th percentile to the 25th percentile for spending on all drugs at the HRR-level was 1.12. By contrast, the present study found that this ratio was 1.32 for antibiotics. Compared to studies that examined antibiotic use in the commercial population (children and younger adults <65), we found that the Medicare population (aged≥65) used more antibiotics, 1.10 per person per year in our sample compared to 0.88 per person per year in commercial population.11 In addition, the variation in utilization of antibiotics we found across states was similar to what Steinman and colleagues reported across commercial health plans.11 For example, a re-examination of their results show that the ratio of the 90th percentile to the 10th of prescription counts is approximately 1.50 across commercial plans. Our results show that the variation across US states is 1.42. Our findings show that the South had the highest utilization of antibiotics, consistent with previous studies both of antibiotic utilization11 and of overall prescribing quality (which found worse quality of prescribing in the South compared to other regions of the country).7
In addition to regional differences, we found significant patterns of seasonal variation in antibiotic use, with the highest utilization in the winter months. While rates of bacterial infection were also higher in these months, so were the rates of upper respiratory tract infections and acute respiratory tract infections. Since patients with these conditions are often prescribed antibiotics unnecessarily, it is likely that the rates of inappropriate use of antibiotics are also highest in the winter months.
There are several limitations of our data and methods. First, we have adjusted for observable patient characteristics, including demographics, insurance status and some clinical characteristics. However, we cannot fully adjust for disease severity and other discrete health status measures, or for a patient’s preferences and explicit requests and expectations for antibiotic treatment. These unadjusted factors could explain part of the variation we found. Second, we cannot directly measure appropriate and inappropriate use of antibiotics at the individual level because under-code and miscode for bacterial pneumonia and other acute respiratory tract infections in claims data are common.16 Instead, we examine this issue by determining whether regions that use more antibiotics have higher disease incidence. This is still subject to under-code and miscode but is less problematic, because we only examine the aggregated trend over time instead of measuring at the individual level. In addition, by looking at diagnosis independent of drug prescribing we reduce bias of upcoding when a diagnosis may be written to implicitly justify the decision to prescribe an antibiotic. We are simply demonstrating substantial variation in antibiotic use across regions. Variation described here suggests that inappropriate use of antibiotics in some regions and months might be higher than other regions and months, but it is difficult to know the right level of antibiotic use.
Despite these limitations, our study yields some important findings that have policy implications. Our study could be the first study using most recent national Medicare Part D data to evaluate geographic variation in outpatient antibiotic prescribing among older adults. Medicare Part D data is the most comprehensive dataset to examine national regional variation in antibiotic use because there are no other comparable national data. Although we do not have the data to directly address the degree to which results seen in Medicare patients extrapolate to younger patients, the findings in our study (e.g., higher rates of antibiotics in the south) are consistent with similar findings among younger adults. This suggests a possible correlation between prescribing behaviors for younger vs older adults.
In addition, it is important to examine antibiotic use in Medicare beneficiaries because older patients often have multiple comorbid conditions, which makes them more susceptible to complications and bad outcomes from untreated infections.17, 18 Consequently, there is an incentive for physicians to treat older patients more aggressively with antibiotics. On the other hand, older patients might be subject to more severe adverse outcomes of antibiotic use regardless of whether or not the antibiotic actually was indicated, including, for example, clostridium difficile colitis, cognitive disturbance with quinolones, and clinically significant drug-drug interactions.3–5 In addition, bacterial resistance is a societal concern. Thus, physicians should be extra careful to ensure not to prescribe unnecessary antibiotics to older patients. However, currently there is no quality measure that tracks the use of antibiotics among older adults – for example, the National Committee for Quality Assurance only tracks the antibiotic use among all children as well as avoidance of antibiotic treatment in adults younger than 65 with acute bronchitis, but not for older adults.19
Overall, areas with high rates of antibiotic use may benefit from more targeted programs to reduce unnecessary antibiotic use. Although the use in lowest-utilization region does not necessarily represent the clinically appropriate use, given that the overuse of antibiotics is common, quality improvement programs can be set at attainable targets using the low-prescribing areas (states in the West) as reference. In the past, quality measures looking at overuse of antibiotics have tended to shy away from older patients. Although older patients might have higher risk of adverse outcomes of infection, they may also be at particularly high risk of adverse outcomes of antibiotic use. Thus, it might be necessary to target some quality improvement initiates to this group.
Using 2007–2009 Medicare Part D data, Zhang et al. examined geographic and seasonal variations in antibiotic use at 306 Dartmouth hospital-referral regions (HRRs), 50 states and DC, and 4 regions (South, West, Midwest, and Northeast). Substantial geographic and seasonal variation existed across regions, after adjusting for population characteristics including demographics, insurance status, and clinical characteristics. These differences could not be explained by differences in the prevalence of the underlying conditions. The South saw the highest antibiotic use, where 21.4% of patients per quarter used an antibiotic, compared to 17.4% in the West (P<0.01), the lowest region. Regardless of region, the rate of antibiotic use was highest in the first quarter (20.9% in January–March) and lowest in the third quarter (16.9% July–September; P<0.01). The authors suggest that areas with high rates of antibiotic use may benefit from targeted programs to reduce unnecessary antibiotic use.
Acknowledgment
We acknowledge the research assistant and programming support provided by Marina Masaki and Shang-Hua (Sean) Wu.
Dr. Zhang was supported by Institute of Medicine (Prime: Centers for Medicare & Medicaid Services HHSP22320042509XI), National Institute of Mental Health (No. RC1 MH088510) and Agency for Healthcare Research and Quality (No. R01 HS018657).
Dr. Steinman was supported by grants from the National Institute on Aging and the American Federation for Aging Research (1K23-AG030999).
Dr. Zhang had full access to all of the data in the study and takes responsibility for the integrity of the data and the accuracy of the data analysis.
Footnotes
Conflict of interest and financial disclosure: none
References
- 1.Goossens H, Ferech M, Vander Stichele R, Elseviers M. Outpatient antibiotic use in Europe and association with resistance: a cross-national database study. Lancet. 2005;365(9459):579–587. doi: 10.1016/S0140-6736(05)17907-0. [DOI] [PubMed] [Google Scholar]
- 2.Gurwitz JH, Field TS, Harrold LR, et al. Incidence and Preventability of Adverse Drug Events Among Older Persons in the Ambulatory Setting. JAMA: The Journal of the American Medical Association. 2003;289(9):1107–1116. doi: 10.1001/jama.289.9.1107. [DOI] [PubMed] [Google Scholar]
- 3.Tome AM, Filipe A. Quinolones: review of psychiatric and neurological adverse reactions. Drug Saf. 2011;34(6):465–488. doi: 10.2165/11587280-000000000-00000. [DOI] [PubMed] [Google Scholar]
- 4.Granowitz EV, Brown RB. Antibiotic adverse reactions and drug interactions. Crit Care Clin. 2008;24(2):421–442. doi: 10.1016/j.ccc.2007.12.011. xi. [DOI] [PubMed] [Google Scholar]
- 5.Kee VR. Clostridium difficile infection in older adults: a review and update on its management. Am J Geriatr Pharmacother. 2012;10(1):14–24. doi: 10.1016/j.amjopharm.2011.12.004. [DOI] [PubMed] [Google Scholar]
- 6.Zhang Y, Baicker K, Newhouse JP. Geographic variation in Medicare drug spending. N Engl J Med. 2010;363(5):405–409. doi: 10.1056/NEJMp1004872. [DOI] [PMC free article] [PubMed] [Google Scholar]
- 7.Zhang Y, Baicker K, Newhouse JP. Geographic variation in the quality of prescribing. N Engl J Med. 2010;363(21):1985–1988. doi: 10.1056/NEJMp1010220. [DOI] [PMC free article] [PubMed] [Google Scholar]
- 8.Donohue JM, Morden NE, Gellad WF, et al. Sources of Regional Variation in Medicare Part D Drug Spending. N Engl J Med. 2012;366(6):530–538. doi: 10.1056/NEJMsa1104816. [DOI] [PMC free article] [PubMed] [Google Scholar]
- 9.Arnold SR, Straus SE. Interventions to improve antibiotic prescribing practices in ambulatory care. Cochrane Database Syst Rev. 2005;(4) doi: 10.1002/14651858.CD003539.pub2. CD003539. [DOI] [PMC free article] [PubMed] [Google Scholar]
- 10.Grijalva CG, Nuorti JP, Griffin MR. Antibiotic prescription rates for acute respiratory tract infections in US ambulatory settings. JAMA. 2009;302(7):758–766. doi: 10.1001/jama.2009.1163. [DOI] [PMC free article] [PubMed] [Google Scholar]
- 11.Steinman MA, Yang KY, Byron SC, Maselli JH, Gonzales R. Variation in outpatient antibiotic prescribing in the United States. Am J Manag Care. 2009;15(12):861–868. [PMC free article] [PubMed] [Google Scholar]
- 12.Steinman MA, Landefeld CS, Gonzales R. Predictors of broad-spectrum antibiotic prescribing for acute respiratory tract infections in adult primary care. JAMA. 2003;289(6):719–725. doi: 10.1001/jama.289.6.719. [DOI] [PubMed] [Google Scholar]
- 13.Steinman MA, Gonzales R, Linder JA, Landefeld CS. Changing use of antibiotics in community-based outpatient practice, 1991–1999. Ann Intern Med. 2003;138(7):525–533. doi: 10.7326/0003-4819-138-7-200304010-00008. [DOI] [PubMed] [Google Scholar]
- 14.Bonito A, Bann C, Eicheldinger C, Carpenter L. Creation of New Race-Ethnicity Codes and Socioeconomic Status (SES) Indicators for Medicare Beneficiaries. Final Report. Sub-Task 2. (Prepared by RTI International for the Centers for Medicare and Medicaid Services through an interagency agreement with the Agency for Healthcare Research and Policy, under Contract No. 500-00-0024, Task No. 21) [Accessed March 16, 2010]; http://www.ahrq.gov/qual/medicareindicators/medicareindicators.pdf.
- 15.Centers for Medicare & Medicaid Services. 2011 RxHCC Model Software. [Accessed March 12, 2011]; http://www.cms.gov/MedicareAdvtgSpecRateStats/06_Risk_adjustment.asp#TopOfPage.
- 16.Linder JA, Kaleba EO, Kmetik KS. Using electronic health records to measure physician performance for acute conditions in primary care: empirical evaluation of the community-acquired pneumonia clinical quality measure set. Med Care. 2009;47(2):208–216. doi: 10.1097/MLR.0b013e318189375f. [DOI] [PubMed] [Google Scholar]
- 17.Gau JT, Acharya U, Khan S, Heh V, Mody L, Kao TC. Pharmacotherapy and the risk for community-acquired pneumonia. BMC Geriatr. 2010;10:45. doi: 10.1186/1471-2318-10-45. [DOI] [PMC free article] [PubMed] [Google Scholar]
- 18.Houston MS, Silverstein MD, Suman VJ. Risk factors for 30-day mortality in elderly patients with lower respiratory tract infection. Community-based study. Arch Intern Med. 1997;157(19):2190–2195. [PubMed] [Google Scholar]
- 19.National Committee for Quality Assurance. Vol 2011. Washington DC: 2010. State of Health Care Quality. [Google Scholar]
- 20.Sorensen TL, Monnet D. Control of antibiotic use in the community: the Danish experience. Infect Control Hosp Epidemiol. 2000;21(6):387–389. doi: 10.1086/501778. [DOI] [PubMed] [Google Scholar]
- 21.Zhang Y, Lee BY, Donohue JM. Ambulatory antibiotic use and prescription drug coverage in older adults. Arch Intern Med. 2010;170(15):1308–1314. doi: 10.1001/archinternmed.2010.235. [DOI] [PMC free article] [PubMed] [Google Scholar]
