Birth and expression evolution of mammalian microRNA genes (original) (raw)
Abstract
MicroRNAs (miRNAs) are major post-transcriptional regulators of gene expression, yet their origins and functional evolution in mammals remain little understood due to the lack of appropriate comparative data. Using RNA sequencing, we have generated extensive and comparable miRNA data for five organs in six species that represent all main mammalian lineages and birds (the evolutionary outgroup) with the aim to unravel the evolution of mammalian miRNAs. Our analyses reveal an overall expansion of miRNA repertoires in mammals, with threefold accelerated birth rates of miRNA families in placentals and marsupials, facilitated by the de novo emergence of miRNAs in host gene introns. Generally, our analyses suggest a high rate of miRNA family turnover in mammals with many newly emerged miRNA families being lost soon after their formation. Selectively preserved mammalian miRNA families gradually evolved higher expression levels, as well as altered mature sequences and target gene repertoires, and were apparently mainly recruited to exert regulatory functions in nervous tissues. However, miRNAs that originated on the X chromosome evolved high expression levels and potentially diverse functions during spermatogenesis, including meiosis, through selectively driven duplication-divergence processes. Overall, our study thus provides detailed insights into the birth and evolution of mammalian miRNA genes and the associated selective forces.
Understanding the molecular basis of phenotypic differences among mammals has been a central topic in evolutionary biology. In addition to protein sequence changes, gene expression alterations due to regulatory mutations are thought to underlie many or even most phenotypic innovations (King and Wilson 1975).
MicroRNAs (miRNAs) are short (approximately 22 nucleotides) noncoding RNA molecules that bind to complementary sequences in target messenger RNAs (mRNAs), thus promoting mRNA degradation or translational repression (Carthew and Sontheimer 2009; Guo et al. 2010). In the past decade, it has become clear that miRNAs are key post-transcriptional regulators of gene expression and are involved in most biological processes (Bartel 2009). For example, they are essential for the regulation of tissue differentiation during development (Stefani and Slack 2008) and the regulation of the immune response (Xiao and Rajewsky 2009).
In the evolutionary context, it is noteworthy that expansions of miRNAs seem to be associated with body-plan innovations and other phenotypic changes in bilaterians and vertebrates (Niwa and Slack 2007; Heimberg et al. 2008; Christodoulou et al. 2010; Berezikov 2011). They may therefore have significantly contributed to phenotypic evolution in animals. However, their origins and functional evolution remain overall little understood. Evolutionary studies of mammalian miRNAs and their expression have been hampered by the lack of appropriate data that can be compared in an unbiased manner among mammalian species. So far, miRNAs have only been annotated on a larger scale in a few species (Landgraf et al. 2007; Dannemann et al. 2012), and available miRNA expression data were produced using different technologies (e.g., Sanger or next generation sequencing approaches, microarrays), rendering cross-mammalian comparisons difficult.
To overcome these limitations, we used high-throughput RNA sequencing (RNA-seq) to generate extensive miRNA data for five major organs from six species that represent all main mammalian lineages and birds. Our analyses of this essentially unbiased data set, in conjunction with small RNA-seq data generated for mouse spermatogenic cells and our previous mammalian mRNA-seq data (Brawand et al. 2011), provide detailed insights into the birth and evolution of mammalian miRNA genes and the associated selective forces.
Results
An unbiased miRNA catalog of mammals and birds
We generated small RNA-seq data for brain (cerebral cortex or whole brain without cerebellum), cerebellum, heart, kidney, and testis from one male representative of six species (Methods; Supplemental Table S1): placental mammals (human, rhesus macaque, mouse), marsupials (gray short-tailed opossum), monotremes (platypus), and birds (red jungle fowl, a nondomesticated chicken). Specifically, we prepared libraries for RNAs of approximately 20–30 nucleotides (nt) from each sample and sequenced each of the 35 libraries (including five biological replicates; Methods) using Illumina Genome Analyser IIx platforms, resulting in a total of 766 million reads of 37 nt. We identified miRNA genes by running a detection pipeline centered around miRDeep (Friedländer et al. 2008), using as input the same total number of mapped RNA-seq reads (47 million) in the expected size range of miRNAs (i.e., 15–23 nt) for each species (Methods). The resulting data were then evaluated to ensure that our procedure was not biased toward any species (Methods; Supplemental Note; Supplemental Figs. S1, S2) and consistent with the expected size range of mature miRNAs: 88%–97% of our detected miRNAs have a mature sequence of length of 21–23 nt (Supplemental Fig. S3). We also calculated expression values, normalized across tissues, for each miRNA gene (Methods).
We thus identified 231–417 expressed miRNA genes per species, which group, on the basis of their sequence similarity (Methods), into 143–266 families (Table 1; Supplemental Tables S2–S7). The largest number of miRNA genes is found in the opossum, followed by the primates, mouse, chicken, and platypus. Using our RNA-seq data, we could initially detect >80% of the miRNAs annotated in miRBase (Release 15), which narrowed down to 33%–72% (depending on the species) after a stringent detection procedure (Methods; Supplemental Fig. S4). miRBase-annotated miRNAs not maintained after our rigorous filtering procedure may be too lowly expressed to display reliable characteristics of miRNA processing (at least in the five tissues covered in our study) or may not represent bona fide miRNAs. Several lines of evidence suggest that our RNA-seq–based data are indeed more suited for comparative analyses than those collected by miRBase. First, the number of miRNAs for the six species varies fivefold in miRBase, whereas this number only varies twofold in our data. Second, we detect approximately the same number of miRNAs in closely related species (human and macaque), whereas miRBase records 270 more miRNAs for humans than for macaque. Third, the genomic densities of miRNA loci detected in our study are very similar among mammals (Table 1).
Table 1.
Summary of the miRNA comparative data set
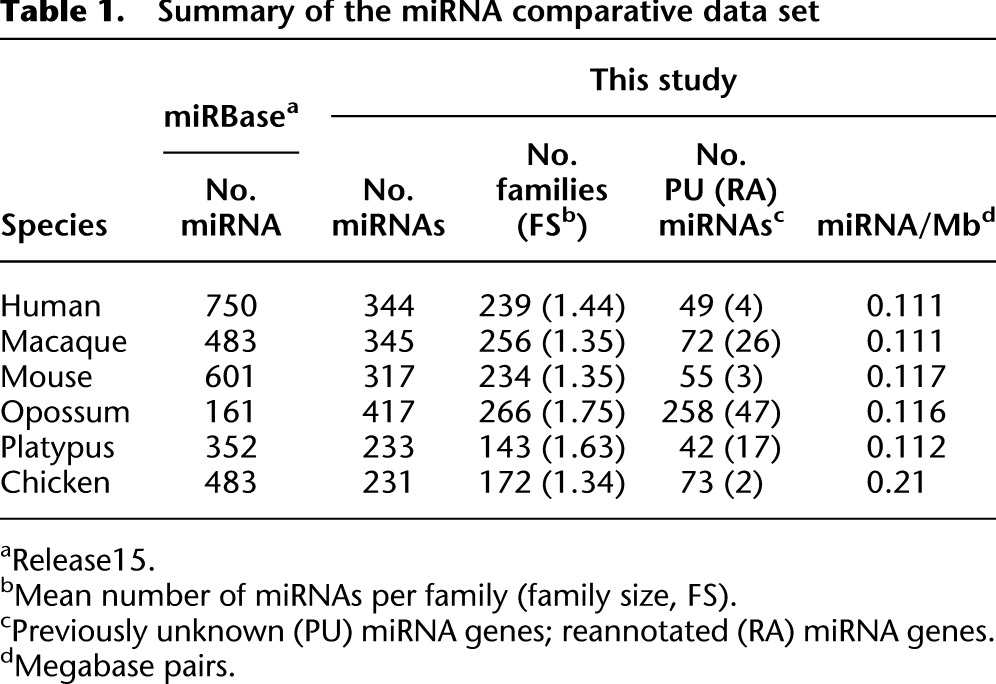
It is also noteworthy that we reliably identified 648 miRNA genes that were previously unannotated or annotated differently in miRBase (Table 1). A large proportion of these novel loci are found in the opossum. Specifically, we identified 256 completely novel miRNA genes for this species in addition to the 161 opossum miRNAs that were previously annotated in miRBase. However, we also detected about 50 novel loci for each of the previously already well-studied human and mouse species. The majority (77%) of newly detected miRNA genes emerged relatively recently in evolution on one of the terminal branches of the phylogeny for the investigated species (Supplemental Table S1), whereas a significantly smaller proportion of previously known miRNAs (17%) are lineage-specific (P < 10−10, Fisher's exact test). Furthermore, the new loci detected here are characterized by low expression levels (see also below), which likely explains why they have previously remained undetected.
Birth and death rates of miRNAs in mammals
With our sets of miRNA gene annotations, we first sought to estimate the birth and death rates and ancestral gene content of miRNA gene families during mammalian evolution using a maximum likelihood procedure (Methods; Csuros 2010). This analysis revealed an overall increase in the number of families in both mammals and birds (from approximately 78 ancestral families to 143–266 families) since the split of these lineages ∼310 million years ago (MYA) (Fig. 1; Table 1). Remarkably, however, the net increase in miRNA gene families since the mammal-bird split is significantly higher in placental and marsupial (i.e., therian) mammals (157 − 188 families) than in platypus (65 families) and chicken (94 families) during this evolutionary time period (Benjamini-Hochberg corrected P < 10−2, one-sample binomial test; Fig. 1). Consequently, the net gain rate of miRNA families in therians (about 0.83 new families per MY) is approximately threefold higher than in monotremes (about 0.23 families/MY) and birds (about 0.3 families/MY). This pattern is due to higher rates of miRNA family birth in therians (Fig. 1). Specifically, although more miRNA families originated in therians (173–193 families) than in monotremes (69 families) since the split of these lineages ∼200 MYA, numbers of family losses during the same time period are comparable (17–48 family losses in therians versus 20 in monotremes; Fig. 1).
Figure 1.

Birth and death rates of miRNA families. Phylogeny of the six studied amniote species and estimated rates of miRNA family gain and loss, as inferred by a maximum likelihood procedure (Methods), are shown. Note that the estimated number of families in the amniote ancestor that have been completely lost during evolution (i.e., with no representative in extant species) is zero. Branch lengths reflect evolutionary divergence times in million of years (MY). Number of gained (+) and lost (–) families (in black) as well as the net gain rate of miRNA families per MY (in red) are indicated next to each branch. The therian net gain rate was computed based on the gain and loss of miRNA families across the entire therian clade (light blue box). The net number of families that have been gained since the bird-mammal split are indicated in the orange box, and the total number of families for each species are indicated above.
However, miRNA family gain rates are also variable within the therian clade (0.43–2 families/MY; Fig. 1). Notably, net gain rates are substantially higher for terminal branches than for internal branches. In particular, the recent terminal branches leading to humans and the macaque show high rates of net miRNA family gain (1.32 and 2 families/MY, respectively), resulting from very high rates of miRNA family origination (2.8–2.9 families/MY), which are only partly counterbalanced by high rates of family loss (0.9–1.5 families/MY). Together, these observations suggest a high rate of miRNA family turnover in mammals. Thus, it seems that many newly born mammalian miRNA families are nonessential and therefore not preserved by purifying selection over long evolutionary time periods, consistent with observations in fruitflies (Lu et al. 2008). Based on the differences in gain rates between internal (0.43–0.69 families/MY) and terminal branches (0.73–2.0 families/MY), we estimate that approximately half of the newly born miRNA families in mammals are lost in the course of evolution.
Introns as catalysts for de novo miRNA family origination in mammals
To study the mechanisms that may underlie the de novo origination of miRNA families, we first assessed the genomic locations of new mammalian miRNA genes. We thus screened for overlaps of miRNA precursor sequences (∼50–70 nt) in the genome with genomic elements of different types, including exons and introns of protein-coding genes, pseudogenes, and transposable elements (Supplemental Table S8). Only intronic sequences showed a sizable overrepresentation of miRNA loci, consistent with previous reports (Berezikov 2011). A detailed analysis revealed that 36%–65% of miRNA genes are overlapping with introns of protein-coding genes in the different species, although annotated introns only constitute ∼22%–45% of the entire genome (Table 2). The overrepresentation of miRNA families in introns is highly significant in all species (corrected P < 0.005, randomization test; Table 2).
Table 2.
Enrichment of miRNAs in introns
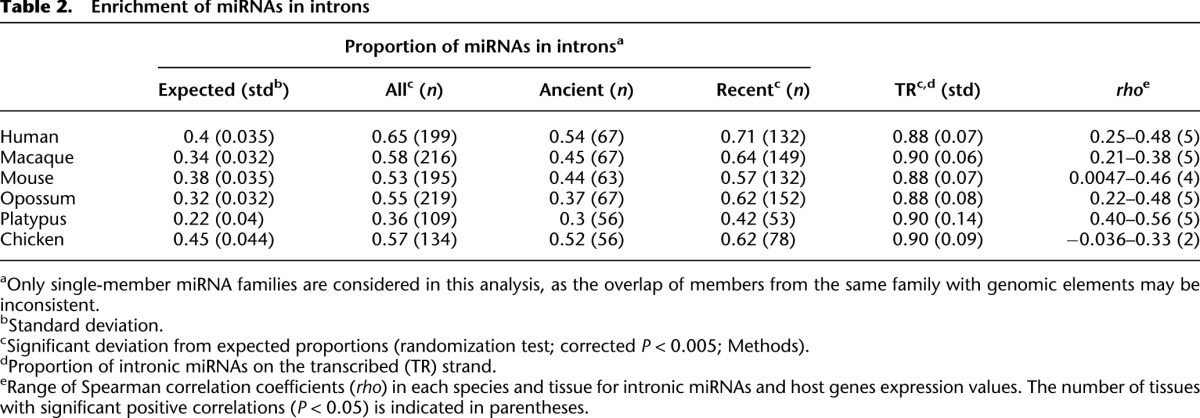
We further noticed that the overrepresentation of miRNA families in introns is more pronounced for recent miRNAs that emerged after the bird-mammal split than for ancient miRNAs that originated before this split (42%–71% versus 30%–54%; Table 2). Given that recent miRNA families are expected to better reflect miRNA birth processes (e.g., old miRNAs may have moved away from their original genomic location during evolution), this observation further emphasizes the important role of introns for the de novo origination of miRNAs. In fact, introns may represent a natural place for the miRNA de novo formation (Berezikov 2011; Campo-Paysaa et al. 2011), given that the host gene provides the capacity for miRNA transcription and that Drosha, the first enzyme in the miRNA processing pathway, can interact with the spliceosome and thus crop intronic hairpins to form miRNA precursors (Kim et al. 2009).
If miRNAs indeed profit from the transcription of the host gene for their formation, we can hypothesize that they are encoded in the same orientation as their host gene (i.e., on the host gene's sense strand) and that their transcription levels are positively correlated with those of their host genes. Consistently, >88% of intronic miRNA genes are located on the sense strand of their host gene in all investigated species, a significantly larger proportion than expected by chance (corrected P < 0.005, one-sample binomial test assuming equal strand probabilities). We also assessed the correlation of miRNA expression and host gene expression levels, taking advantage of our mRNA expression level data recently established for the six species studied here using RNA-seq (Brawand et al. 2011). This analysis reveals significant positive correlations of miRNA and host gene expression levels in most tissues in the different species (Table 2).
Expansion of new miRNA families by gene duplication
In addition to the birth of new miRNA families, miRNA repertoires can also expand through the duplication and subsequent divergence of pre-existing miRNA genes (Chen and Rajewsky 2007). To assess the contribution of duplication versus de novo origination for the expansion of miRNA repertoires in mammals, we contrasted numbers of miRNA families (assuming each of them represents an independent de novo emergence event) with those of their paralogous constituent members (resulting from duplication of ancestral copies). This analysis suggests that 143–256 miRNA genes emerged de novo, whereas 59–151 miRNA genes originated via gene duplication (Supplemental Table S9). However, some divergent families may have arisen from ancient duplication events and thus nevertheless have a common origin (i.e., they did not arise independently in mammals in a de novo manner). Using relaxed sequence similarity criteria (Methods), we detected a number of potential cross-family relationships. When these are considered in the analysis, we estimate that 88–211 new miRNA genes originated by gene duplication and 113–206 miRNAs through de novo mechanisms during mammalian evolution (Supplemental Table S9). Overall, our analyses thus suggest that de novo formation and duplication mechanisms contributed in similar degrees to miRNA repertoires in mammals.
Expression and target gene pool evolution of miRNA genes
To explore the functional evolution of new miRNA gene families, we first contrasted expression levels of miRNA families with their age (Methods), which revealed a striking positive correlation between these two parameters (Spearman rho: 0.47 to 0.71, corrected P < 10−10; Fig. 2A). For example, primate-specific miRNA gene families have approximately 30-fold lower median expression levels than ancient families that originated in the common amniote ancestor (Fig. 2A). These observations suggest that newly emerged miRNAs generally have very low expression levels that gradually increase during evolution, consistent with a previous hypothesis (Chen and Rajewsky 2007) and a recent study (Roux et al. 2012) that was based on human and mouse low-throughput sequencing data (Landgraf et al. 2007).
Figure 2.

Age of miRNA families relative to their expression levels and numbers of predicted target genes. (A) Expression level distributions of miRNA families of different ages. Expression values for each miRNA family were computed as the median expression levels of all family members across all tissues. Also, common expression values associated with two or more miRNA loci with highly similar mature sequences were divided by the number of loci involved. Age categories of miRNA families are represented from the most recent (far left) to the most ancient (far right) for each species based on their phylogenetic distribution (see Methods). (B) Number of predicted target genes of miRNA families of different ages divided by the number of predicted targets for mock miRNAs from random intronic sequences (Methods) using PITA. Number of target genes per miRNA family was computed as the median number of targets of all family members. (C) Evolution of mature miRNA sequences. The percentage of miRNA families displaying one or more modifications in the mature sequence (substitutions in the seed or in the rest of the mature sequence; shifts in the 5′ or 3′ end of the mature miRNA) is shown together with 95% confidence intervals.
Next, we contrasted the age of miRNA gene families and the number of their predicted target genes, using a set of random mock mature miRNAs as a control (Methods). We could not detect any significant correlation between miRNA family age and the number of predicted targets (Fig. 2B; Spearman rho: -0.002 to 0.14, corrected P > 0.17 using predictions obtained with PITA target prediction tool; Spearman rho: -0.073 to 0.094, corrected P > 0.87 using TargetScan predictions). Thus, our analysis provides no evidence for selectively driven elimination of deleterious target sites during evolution (Chen and Rajewsky 2007). However, given the potentially large number of false positive predictions that may be obtained using these in silico methods, differences in target sites, which could be subtle, may not be easily detectable.
We then traced the evolution of miRNA mature sequences and its effect on potential target gene pools. Of 237 miRNA families with two or more representatives, almost half (45%) displayed differences in their mature sequences. Changes modifying the seed were significantly less frequent than other mature sequence alterations (Fig. 2C), which is consistent with the notion that seeds generally represent the most conserved parts of miRNA precursors. Specifically, 12% of all miRNA families experienced substitutions in their seed sequences during evolution, and 23% evolved new predominant mature 5′ ends that also affect the seed sequence. A significantly larger proportion of families were affected by substitutions (35% of 237 families) or 3′ end shifts (41%) in the 3′ end of their mature sequences that do not affect seed sequences (proportion test; P < 10−11). Consistently, the correlation coefficients between predicted target ranks of within-species miRNA paralogs with different seeds were significantly lower compared to those computed for within-species paralogs with identical seeds but different mature sequences (median rho = 0.029 ± 0.005 versus rho = 0.393 ± 0.022 using PITA target predictions ; median rho = 0.176 ± 0.013 versus rho = 0.985 ± 0.003 using TargetScan; P < 10−11 in both cases). The observation that, among changes affecting the seed sequence, 5′ end shifts are twice as frequent as substitutions (12% versus 23%; proportion test; P = 0.0025) may be explained by the fact that frequencies of 5′ end mature sequence variants can change gradually during evolution, whereas substitutions in the seed sequence instantaneously redefine the target gene pool, which may generally have highly deleterious consequences. Notably, our corresponding analyses focusing on 1:1 miRNA orthologs and within-species paralogs revealed very similar patterns (Supplemental Tables S10, S11). Interestingly, mature sequences of within-species paralogs in mammalian-specific miRNA families were particularly frequently affected by changes (Supplemental Table S11), indicating that recent duplications in mammalian-specific miRNA families facilitated the diversification of miRNA mature sequences.
Spatial expression pattern of mammalian miRNA genes and coevolution with target genes
We then investigated spatial expression patterns of miRNA gene families of different ages. We do not detect a clear difference in terms of tissue-specificity between young and old families (Supplemental Fig. S5). However, young miRNAs families (i.e., those that emerged since the mammal-bird split) and old families (i.e., those that originated prior to the mammal-bird split) generally have distinct tissue-specific expression profiles in the different species (Fig. 3A; corrected P < 0.05, permutation test). Remarkably, although ancient miRNAs tend to be predominantly expressed in heart and kidney, recent miRNAs tend to be predominantly expressed in the two nervous tissues, cortex and cerebellum, in mammals (Fig. 3A).
Figure 3.

Spatial expression patterns of miRNAs and 3′-UTR structures of predicted target genes. (A) Age of miRNA families and their relative expression by tissues. Relative expression values for each family were calculated as the sum of expression values of all family members in a given tissue divided by their total expression across all tissues. Colored symbols indicate the median relative expression value of miRNA families. Ancient/recent families: families that originated before/after the mammal-bird split. Samples sizes (n) are indicated (note that miRNA families with low expression levels were filtered out in this analysis; see Methods for details). For all but the ancient macaque and recent platypus families, the difference between the maximum and minimum median values is significantly higher than expected by chance (permutation test on tissue labels, corrected P < 0.05). (B) 3′-UTR lengths of protein-coding genes. Protein-coding genes were classified according to the tissue in which they are most highly expressed. (C) Numbers of miRNA families targeting protein-coding genes (using PITA predictions). A miRNA family was considered to target a gene if one or more of the miRNAs were predicted to target the gene's 3′ UTR. Patterns are shown for all miRNA families. Notably, similar results are obtained for ancient and recent families when these are analyzed separately and using TargetScan target predictions (Supplemental Fig. S15).
Given that 3′ UTRs are the main targets of miRNAs and that 3′-UTR length is likely to be an important factor in miRNA–target co-evolution (Berezikov 2011), we performed analyses of 3′-UTR lengths and miRNA targeting of mRNAs in different organs based on our miRNA and mRNA sequencing data sets. Our analysis shows that genes predominantly expressed in nervous tissues have significantly longer 3′ UTRs in all species (Fig. 3B), consistent with previous human and mouse studies (Zhang et al. 2005; Ramskold et al. 2009). The mRNAs of such genes are therefore predicted to be targeted by larger numbers of both old and young miRNA families (Fig. 3C) given the strong (and expected) correlation between 3′-UTR length and the number of miRNA families that potentially target them (Supplemental Fig. S6). Taken together, our observations suggest that the prevalent origination of new miRNA genes with brain-specific expression patterns contributed to the evolution of gene expression networks in the mammalian brain.
Sequence evolution of miRNA genes of different ages
The birth/death and expression/target analyses described above suggest that the selective pressures acting on young and old miRNA genes are generally different. To further explore this difference, we contrasted nucleotide substitution rates (across primates) in human miRNA precursor sequences from different age classes with rates in the genomic background using a recently developed phylogenetic method (phyloP; Methods) (Pollard et al. 2010). In relatively ancient miRNAs (predating the human-mouse split), we observe an overrepresentation of relatively slowly evolving sites (phyloP score >0.5), whereas fast-evolving site categories are generally underrepresented (Fig. 4A). Thus, these miRNAs have probably evolved under purifying selection in primates. In contrast, the rate of sequence evolution in more recent miRNAs, which originated in the common primate ancestor, is comparable to that of the genomic background, whereas even younger miRNAs that originated in Old World primates (catarrhines) show an excess of fast-evolving sites (phyloP score <−2). Thus, primate-specific miRNAs seem to have been evolving overall neutrally at the sequence level, consistent with our inferences from the birth/death rate and expression analyses (see above). However, our results suggest that at least some catarrhine miRNAs have been evolving rapidly, which may reflect the action of positive selection or nonadaptive forces, such as rapid evolution at CpG dinucleotides and/or biased gene conversion (Duret and Galtier 2009).
Figure 4.

Evolution of miRNA precursor sequences. (A) Comparisons of phyloP score category frequencies between human miRNA precursor sequences and the genomic background. miRNA/genome frequency ratios >1 indicate a higher frequency of sites with a given phyloP score category in miRNAs relative to the genomic background (and vice versa). Primate-based phyloP scores: rapidly evolving sites (score < −0.5); slowly evolving sites (score > 0.5). Error bars: 95% confidence intervals. The age (i.e., phylogenetic distribution; Methods) of miRNAs and the total number of miRNA sites considered (n) are indicated at the bottom of the panel. (B) Sequence evolution of miRNA families on the X chromosome and autosomes. To limit biases due to age variations, only eutherian-specific miRNA families predating the human-mouse split were considered.
Among the 29 previously unannotated catarrhine miRNAs, six have precursor sequences with statistically significant fast-evolving sites (Supplemental Table S12). Detailed analyses of folding structures across primate species of these cases suggest that these miRNAs arose de novo in various ancestors in great apes (Supplemental Table S12). For example, the precursor sequence of hsa-mir-7160 located in intron 12 of MYOM2, a gene with functions related to muscle contraction (van der Ven et al. 1999), has three sites with significantly accelerated evolution (corrected P < 0.05; Methods) (Supplemental Fig. S7A). It is noteworthy that these three sites correspond to CpG dinucleotides in great apes and/or outgroup species (Supplemental Fig. S8), which might indicate that the rapid evolution of these sites is due to CpG hypermutability. Our folding structure analyses suggest that it arose de novo as a functional miRNA in the common ancestor of the great apes, 12–25 MYA (Supplemental Fig. S9). Similar to its host gene, the expression level of this miRNA is approximately 10-fold higher in human heart than in the other four tissues (Supplemental Fig. S7B). An analysis of enriched functional categories among potential target genes suggests that it may be involved in various vascular functions (Supplemental Table S12).
Emergence of miRNA gene families on the mammalian X chromosomes
Previous studies indicated that miRNAs located on the therian X chromosome have evolved in peculiar ways. Thus, clusters of duplicated miRNA genes with testis-expression, some of which were shown to have been rapidly evolving, were identified on the X chromosome of all major mammalian lineages (Zhang et al. 2007; Devor and Samollow 2008; Murchison et al. 2008; Guo et al. 2009; Li et al. 2010). Motivated by these findings, we sought to characterize in detail the birth and expression pattern of X-linked miRNAs.
Our analyses confirm that the densities of miRNA genes are significantly higher on the X chromosome than on autosomes in all mammals (Supplemental Table S13). Furthermore, contrary to autosomes, most miRNA genes on the X emerged recently in the different therian lineages and tend to be organized in clusters. Large proportions (50%–92%) of recent X-linked miRNA genes in clusters have paralogous copies in their vicinity (i.e., within the cluster). Notably, we found a significant excess (relative to the random expectation) of blast hits between families of the same cluster (10-fold to 22-fold excess; P < 10−4, randomization test), suggesting that many of them are the result of duplications. Thus, when taking into account potential cross-family relationships, the proportions of paralagous copies of recent clustered miRNAs increase to 72%–97%. Thus, recently duplicated miRNA gene copies on the X seem to have diverged rapidly. Consistently, our analysis of human miRNA sequence evolution in primates reveals overall low selective constraint and an excess of fast-evolving sites for X-linked miRNA families with more than one member, whereas single-member families on the X or autosomal miRNA genes show an excess of sites under purifying selection (Fig. 4B). Together, our observations suggest multiple independent and selectively driven expansions of miRNA gene repertoires on the X by tandem duplication in the different therian lineages. Although the numbers of X-linked miRNA genes and clusters in the platypus are relatively small, the overall pattern in monotremes seems to be similar to that of therians (Supplemental Table S13).
To explore the functional relevance of these expansions, we performed spatial expression pattern analyses, restricting the analysis to miRNAs of one age category per species (Fig. 5), in order to avoid age-related expression variations (see above). These revealed that therian X-linked miRNA genes from multimember families have at least fourfold higher expression levels in the testis (per copy) than single-member family miRNAs on the X or autosomal miRNAs (corrected P < 10−3, Mann-Whitney _U_-test), whereas expression patterns in somatic tissues are inconspicuous (Fig. 5A). This result is suggestive of selectively driven expression level increases of duplicated X-linked miRNAs in the mammalian testis.
Figure 5.

Expression patterns of sex chromosome-linked and autosomal miRNAs. (A) Spatial expression pattern of miRNA genes on the therian X, platypus X1–X5, and bird Z chromosomes. Expression level distributions of miRNA genes shared among and specific to eutherians, marsupials, monotremes, or specific to chicken (see Methods for miRNA age definitions) are shown. The sample size, n, corresponds to the number of independent expression values. Note that we define expression levels of miRNA genes in somatic tissues as their median expression levels across all four somatic tissues. Also, common expression values associated with two or more miRNA loci with highly similar mature sequences were divided by the number of loci involved. (B) Expression of miRNA genes shared among and specific to eutherians in mouse spermatogenic cells. Sample sizes are the same as indicated for mouse in panel A.
To investigate these patterns in more detail, we turned to the mouse as a model system. We produced additional small RNA-seq data for three major testis cell types (Methods): spermatocytes (meiotic germ cells), round spermatids (haploid germ cells derived from spermatocytes), and sertoli cells (somatic cells that nurture developing germ cells during spermatogenesis). Our analyses of these data show that multimember family miRNAs on the X have significantly higher expression levels than all other miRNA categories in the spermatocytes and spermatids (Fig. 5B), which explains the high expression of these miRNAs in the testis as a whole given that spermatocytes and in particular spermatids constitute a large proportion of cells in the testis (Grabske et al. 1975). Our observation of high expression of X-linked duplicated miRNAs in spermatocytes may seem surprising in view of the mechanism of meiotic sex chromosome inactivation (MSCI) (Turner 2007), but it is consistent with a recent observation that miRNAs may escape MSCI (Song et al. 2009). Together with our finding that miRNAs without paralogous copies on the X have particularly reduced expression levels in spermatocytes (Fig. 5B), our results refine previous conclusions (Song et al. 2009) in that apparently only miRNA families that expanded by gene duplication escape transcriptional silencing by MSCI. Our finding is consistent with recent observations that increased copy number of X-linked protein-coding genes counteracts MSCI (Sin et al. 2012) as well as post-meiotic repression (Mueller et al. 2008; Sin et al. 2012), a secondary consequence of MSCI (Turner 2007). Copy number increase through gene duplication thus seems to represent a general mechanism that allows genes of various types to evade MSCI and post-meiotic silencing, thus ensuring sufficient expression of these genes, which may provide crucial reproductive functions during these stages of spermatogenesis. The precise underlying molecular mechanisms remain to be explored.
Discussion
Here we report a comprehensive set of small RNA-seq data for major organs from representatives of all main mammalian lineages and a bird as well as small RNA-seq data for mouse spermatogenic cells. Our analyses of these data provide the first global picture of miRNA birth and expression evolution in mammals, in which several general patterns stand out. We first uncover a global expansion of miRNA family repertoires in mammals that was facilitated by the frequent de novo formation of miRNA families in host gene introns. Remarkably, the rate of miRNA family gain accelerated significantly in the therian lineage, leading to substantially larger miRNA family repertoires in extant therian species. Previous attempts to assess miRNA expansions did not uncover this expansion due to noncomparable and limited data (Hertel et al. 2006). The therian rate increase might be associated, for example, with the evolution of new developmental programs in therians (e.g., the switch from egg-laying to a lifebearing reproductive mode). It may have been partly facilitated by an overall increase in genome size in these species. Indeed, the density of miRNA genes is remarkably similar across mammals (0.11–0.12 miRNAs/Mb), implying that the number of detected miRNA genes is very well correlated with genome size in mammals (Pearson's r = 0.99, P < 0.01). Thus, the larger size of therian genomes (∼2.7–3.1 billion base pairs, Mb) compared to that of the monotreme platypus (∼2.1 Mb) may have provided more opportunities for the emergence of miRNA precursor sequences on which selection could potentially act. Generally, however, the precise reasons underlying the pronounced therian miRNA family expansion warrant further investigation. In addition to the de novo emergence of new miRNA families, gene duplication substantially contributed to the expansion and functional diversification of miRNA gene repertoires in mammals, in particular with respect to the X chromosome (see below).
Our analyses of new mammalian miRNA families revealed several remarkable patterns. Young mammalian miRNA genes are expressed at low levels and are apparently subject to weak or no purifying selection. Given their generally low expression levels, the regulatory effect of young miRNAs on their target genes is expected to be low. Overall, our data suggest that large proportions of newly emerged miRNA genes were deleterious or effectively neutral and were therefore rapidly lost during evolution, whereas beneficial miRNAs gradually evolved increased expression levels, thus exerting strong regulatory effects. Our findings lend support to previous predictions (Chen and Rajewsky 2007) and are in line with patterns observed in insects and plants (Lu et al. 2008; Fahlgren et al. 2010). Our analyses also revealed that ∼25% of miRNA families also experienced changes in the seed sequence that redefined their potential target genes, mainly by altering the 5′ end of the mature sequence. This observation is probably explained by the fact that frequencies of 5′ end mature sequence variants can change gradually during evolution, whereas substitutions in the seed sequence instantaneously redefine the target gene pool, which may generally have highly deleterious consequences. We also note that our preliminary analyses revealed frequent single-nucleotide (adenine) additions to the 3′ end of mature miRNAs as well as the conservation of such events between human and mouse (data not shown), consistent with a recent report (Burroughs et al. 2010), which suggests that our data will facilitate future evolutionary investigations of mature miRNA variants (isomiRs) (Morin et al. 2008). Finally, although old miRNA genes are mainly expressed in heart and/or kidney, young miRNAs are predominantly expressed in neural tissues that also tend to express protein-coding genes with long 3′ UTRs and many potential target sites. Together, these observations may indicate that young mammalian miRNAs contributed to the evolution of complex expression networks in the mammalian brain.
Our specific analyses of miRNA origination and evolution on the mammalian X chromosome uncovered peculiar patterns. We found that many X-linked miRNA families substantially expanded through tandem gene duplication after the origination of mammalian sex chromosomes. Rather than being expressed in the brain, these miRNAs are predominantly expressed in the testis. Indeed, contrary to other X-linked and autosomal miRNAs, duplicated miRNA genes on the mouse X show high expression levels in meiotic spermatocytes and post-meiotic spermatids. Our results thus suggest that the fixation of new miRNA gene copies was selectively favored during evolution to allow for their expression in spermatocytes and spermatids in spite of MSCI and its post-meiotic aftermath. Consistent with the notion that MSCI and post-meiotic silencing represent the evolutionary forces driving the duplication of X-linked miRNAs, we observed miRNA copy amplification on the X in therians, where MSCI is present (Turner 2007), but not in chicken, for which a recent study reported the absence of MSCI (Guioli et al. 2012). Notably, amplified X-linked miRNA families show rapid sequence evolution, potentially driven by positive selection. Collectively, our findings may suggest that the rapid duplication-divergence pattern observed for X-linked miRNAs reflects the selectively driven evolution of new male functions. Our finding is in line with evolutionary theory, which predicts that the X provides a favorable selective environment for male-beneficial (recessive) alleles (Rice 1984) as well as with a number of previous expression studies, invoking the theory by Rice (1984). These studies showed that protein-coding genes with expression in testis (Zhang et al. 2011; Julien et al. 2012), specifically during spermatogenesis (before and after meiosis) (Wang et al. 2001; Khil et al. 2004; Mueller et al. 2008; Sin et al. 2012), or other male tissues (i.e., prostate) (Lercher et al. 2003) have accumulated on the therian X chromosome, apparently after the differentiation of sex chromosomes from ancestral autosomes (Zhang et al. 2011; Julien et al. 2012).
Methods
Samples
The 30 main organ samples (five different organs from the six amniote species) and five biological replicate samples (macaque: brain, testis, and kidney; opossum: brain and kidney) used in this study were obtained from various sources (Supplemental Table S1). In addition, we extracted three types of spermatogenic cells from C57BL/6J mice (M Soumillon, A Necsulea, M Weier, X Zhang, H Gu, P Barthès, M Kokkinaki, A Gnirke, M Dym, B de Massy, et al., in prep.) Briefly, pachytene spermatocytes and round spermatids were purified by centrifugal elutriation of testes cells as previously described (Buard et al. 2009). Purity of the round spermatid cell fraction was estimated to be ∼90% based on cellular morphology. Purity of the pachytene spermatocyte sample was estimated at ∼70% based on fluorescence analysis using anti-SYCP3 (a marker of the synaptonemal complex) and anti-phospho-H2AX (a marker of double-strand breaks and the sex body). Sertoli cells were isolated from 3-wk-old animals using Datura Stramonium agglutinin (DSA) coated dishes as previously described (Scarpino et al. 1998), with a purity of ∼95%.
Small RNA library preparation and sequencing
We extracted high-quality RNA from the 38 samples described above using standard protocols. We then prepared small RNA-seq libraries for each of these samples using Illumina Small RNA v1.5 Sample Preparation protocol with the following optimizations. We first purified small RNAs (18–30 nt) from total RNA using denaturing PAGE gel electrophoresis. We used 10% Novex TBE PAGE gel instead of the 6% described in the protocol to ensure a better separation of the cDNA constructs during the purification step. In addition, we produced two technical replicate libraries (macaque cerebellum). The 40 libraries were each sequenced (37 cycles) in one lane of llumina Genome Analyzer IIx platforms, resulting in a total of 790 million RNA-seq reads, from which adaptor sequences were removed using standard procedures.
Detection of miRNA genes
The genomes and related annotations from the six studied species were downloaded from Ensembl (Release 57). MiRNA detection was performed by running miRDeep (Friedländer et al. 2008) with default parameters on our RNA-sequencing data, without using seed conservation and using Bowtie (Langmead et al. 2009) to map RNA-seq reads on their respective genomes (allowing for no mismatches: bowtie -v 0 -m 10 -k 10). For each species, we used a total of 47 million mapped reads (15-23 nt); 11 million were sampled from each somatic tissue and 3 million from the testis (because of the expression of germline-related small RNAs, piRNAs, the sequencing of testis libraries resulted in fewer 15-23 nt miRNA reads; Supplemental Note). Finally, we removed miRNAs from the resulting output that lacked reads matching their star strand, as well as miRNAs for which >10% of reads mapped to genomic locations that do not overlap with detected miRNA loci [see Kim et al. (2009) for details on miRNA structure and biogenesis and Kozomara and Griffiths-Jones (2011) for miRNA annotation from RNA-seq data]. As a result, miRNAs in our data set are supported by 90% or more reads that map only to miRNA genes and are not enriched with repeated elements (Supplemental Table S8).
Inference of miRNA clusters and families
MiRNA genes within 50 kb of each other were merged into the same cluster. Distances of 5, 10, and 20 kb resulted in almost identical clusters because the distance between two consecutive miRNA genes was almost always <5 kb or >50 kb. To identify miRNA families, we performed an all-against-all blast (Altschul et al. 1990) analysis (blastall parameters were chosen to optimize the similarity search for short sequences) of miRNA precursors (as detected by miRDeep). We then retained hits with >50% of both precursors aligned, an identity of 70% or more and an e-value <10−5. The miRNA genes interconnected through blast hits were then grouped into families using single-linkage clustering. Blast hits that did not pass the above criteria and that involved two miRNAs belonging to different families are referred to as cross-family blast hits (see main text). To evaluate the validity of our family annotation procedure, we assessed the overlap of our family definitions with those of miRBase (Griffiths-Jones et al. 2006). In nearly all cases (99.7%), two miRNAs belonging to distinct families in our data set (and present in miRBase) are consistently annotated as belonging to distinct families in miRBase. Conversely, two miRNAs of the same family in our data set are also classified into the same miRBase family in 77.1% of the cases. Thus, our family annotation procedure results in family definitions that are very consistent with those of miRBase (family size distribution is shown in Supplemental Fig. S10). Precursor sequences from the same miRNA family were then aligned using Muscle (Edgar 2004) with standard parameters to identify substitutions and/or shifts in the mature sequences of homologous miRNA genes.
Age of miRNA families
To assess the age of miRNA families, we first searched for genomic sequences similar (potentially homologous) to all miRNA precursor sequences using blastall (same parameters and filtering criteria as above). The following genomes were used in this analysis (Ensembl, Release 60): mammals (platypus, opossum, wallaby, armadillo, sloth, mouse, rat, human, macaque, and treeshrew), diapsids (chicken, zebra finch, and Anolis lizard), and Xenopus. The age of miRNA families was based on the species or group of species in which family members (detected using our RNA-seq data) or homologous genomic sequences were identified (parsimony principle). The following distinct groups were considered: amniotes, birds, mammals, marsupials, therians, eutherians, boreoeutheria (rodents and primates but not sloth and armadillo), rodents, primates, and catarrhines.
Expression of miRNAs
To assess expression levels of miRNAs, we first mapped reads onto the mature strand of miRNAs using Bowtie, allowing for multiple mappings but no mismatch (bowtie -v 0 -a). Reads were required to map within the 5′ position of the mature sequence and three nucleotides downstream from its 3′ end position to account for alternative precursor cleavage that does not affect the seed sequence. To obtain raw expression values, we then counted the number of reads for each miRNA. We tested various mapping options, including one that allows for one nucleotide mismatch between the read and mature sequence. These options led to very similar expression values (Spearman rho: 0.99 ± 0.01). When two (or more) miRNA genes shared >10% of their reads, a single joint expression value was computed for them, thus only counting once every single read (i.e., the two miRNAs are considered as one in the relevant analyses). For two analyses (miRNA family age versus expression level; miRNA duplicates on X chromosomes), this value was divided by the number of loci sharing this single expression value in order to obtain an average expression level per gene copy. If two (or more) miRNA genes shared <10% of their reads, then shared reads were equally distributed across the miRNA genes. Thus, in all cases, multiple mapping reads are never counted more than once for expression values. Notably, we assessed whether our use of multiple mapping reads introduced any bias by repeating all major biological analyses using only the subset of miRNAs without ambiguously mapping reads. Results from these analyses are very similar to our original results (data not shown), which validates our multiple mapping read treatment procedure. Normalization across tissues was performed using edgeR (Robinson et al. 2010), which takes into account variable library sizes and corrects for biases in expression level estimates caused by highly expressed genes in a subset of tissues. Notably, expression levels in our technical replicates are very highly correlated (_rho_ > 0.98), which suggests that our data are essentially unaffected by biases in the RNA-seq procedure (Supplemental Fig. S11A). Correlation coefficients in our expression level comparisons of biological replicate samples are very high as well (rho > 0.97 and rho > 0.94 for opossum and macaque replicates, respectively) (Supplemental Fig. S11B); they are higher than coefficients estimated for between-tissue or between-species comparisons (Supplemental Fig. S11C–D). Thus, comparisons of tissues and miRNA categories (e.g., miRNAs of different ages) are essentially unaffected by inter-individual variation. Finally, we assessed the correlation between expression level and expression variability in our technical replicates. We found no significant correlation when removing miRNAs with less than 30 sequenced reads (Supplemental Fig. S12). Thus, for analyses of tissue-specificity, miRNAs with on average <30 reads per tissue were discarded.
Birth and death of miRNA families
We assessed the birth and death of miRNA families using the Count software (Csuros 2010) based on the presence/absence of miRNA families in each species. We used the maximum likelihood procedure implemented in Count with the default settings, which provided estimates of gain and loss rates along the species tree as well as an estimation of the ancestral gene content. Our data were best explained when allowing for variable gain/loss ratios across lineages (likelihood ratio test; df=9; P = 0.026), so we used this option for our analysis (Fig. 1). As an alternative, we also used the parsimony approach implemented in Count. Specifically, we used the Wagner parsimony model with parameters that slightly favor gain events (gain penalty parameter: 0.6–1), given that previous work is indicative of an overall gain of miRNAs during metazoan evolution (Berezikov 2011). Notably, the results from the parsimony approach are very similar to those of the maximum likelihood procedure (Supplemental Fig. S13).
Target prediction
To obtain extensive sets of 3′-UTR sequence data, even in species with more limited annotation (e.g., platypus), we dowloaded genomic coding sequence coordinates from Ensembl and combined them with refined exon and gene boundaries from (Brawand et al. 2011). For each gene, the 3′-UTR sequence was estimated by concatenating all the exonic sequences downstream from the Ensembl-annotated stop codon. We confirmed that our procedure provides a reasonable estimate of the longest 3′ UTR of human genes, a species with well-annotated UTR structures (Supplemental Fig. S14). We used PITA with default parameters (Kertesz et al. 2007) as well as the TargetScan context score method, which can identify nonconserved target sites, i.e., it predicts site efficacy without recourse to evolutionary conservation (Grimson et al. 2007) to predict miRNA target sites in the 3′ UTRs. We then defined all protein-coding genes with a PITA score <–10 (the recommended cutoff) (Kertesz et al. 2007) as predicted target genes. Similarly, for TargetScan, genes yielding predicted target sites with a context score above zero were defined as predicted target genes (Grimson et al. 2007). We obtained very similar results when considering only 7-mer and 8-mer seeds with no mismatches using PITA. Finally, to assess random genomic target site patterns for comparisons to distributions in 3′ UTR, we selected, for each mature miRNA sequence in our data set, a corresponding mock miRNA from a random intronic sequence with the exact same length and GC-content and predicted their targets as above.
Overlap of miRNA loci with genomic elements
We screened for overlaps of miRNA precursor sequence coordinates with genomic elements as annotated by Ensembl (Supplemental Table S8; Hubbard et al. 2009). To assess miRNA overrepresentation in introns, deviations from expected proportions were assessed by randomization tests (i.e., for each species, we randomly sampled genomic locations corresponding to the number of miRNA genes in that species, a process that was repeated 1000 times).
Evolution of miRNA precursor sequences
PhyloP scores for the human genome, based on primate genomic alignments (Pollard et al. 2010), were downloaded from the UCSC Genome Browser (http://genome.ucsc.edu/). We computed phyloP score distributions for the genomic sequences encoding miRNA precursors and the rest of the human genome. To assess the presence of fast-evolving sites in individual precursor sequences, we computed for each site the _P_-value associated with its phyloP score and corrected this value for multiple testing. Sites with a negative phyloP score and a corrected _P_-value <0.05 were defined as statistically significant fast-evolving sites. For the functional analysis of targets of primate-specific miRNA genes with fast-evolving sites, we first downloaded gene ontology (GO) annotations of human protein-coding genes from Ensembl (Release 62). Gene set enrichment analysis (GSEA) was then performed with the topGO R package (using the Kolmogorov-Smirnov test and the elim algorithm), ranking protein-coding genes by PITA target scores. We then selected the biological process with <500 genes that has the lowest _P_-value. Folding structures of catharrine miRNAs were predicted with RNAfold (Bernhart et al. 2006).
Multiple test correction
All corrections for multiple tests were performed using the Benjamini-Hochberg procedure (Benjamini and Hochberg 1995).
Data access
Sequencing data are available from the the NCBI Gene Expression Omnibus (GEO) (http://www.ncbi.nlm.nih.gov/geo/) under accession number GSE40499. Novel miRNA genes were submitted to miRBAse (http://www.mirbase.org/). The genomic locations, expression levels, and predicted targets of reported miRNA genes are available as Supplemental material.
Acknowledgments
We thank L. Andersson, F. Grützner, P. Jensen, and U. Zeller for tissue or RNA samples; K. Harshman and the Lausanne Genomic Technologies Facility for high-throughput sequencing support; I. Xenarios and the Vital-IT computational facility (Swiss Institute of Bioinformatics) for computational support; A. Necsulea for providing RNA-Seq-refined genome annotations; and the members of the H.K. group, Y. Romero, M. Sémon, J. Roux, C. Vejnar, G. Degueurce, M. Warnefors, and three anonymous reviewers for valuable comments. This research was supported by grants from the European Research Council (Starting Independent Researcher Grant: 242597, SexGenTransEvolution) and the Swiss National Science Foundation (grant 31003A_130287) to H.K.
Footnotes
[Supplemental material is available for this article.]
References
- Altschul SF, Gish W, Miller W, Myers EW, Lipman DJ 1990. Basic local alignment search tool. J Mol Biol 215: 403–410 [DOI] [PubMed] [Google Scholar]
- Bartel DP 2009. MicroRNAs: Target recognition and regulatory functions. Cell 136: 215–233 [DOI] [PMC free article] [PubMed] [Google Scholar]
- Benjamini Y, Hochberg Y 1995. Controlling the false discovery rate: A practical and powerful approach to multiple testing. JR Stat Soc 57: 289–300 [Google Scholar]
- Berezikov E 2011. Evolution of microRNA diversity and regulation in animals. Nat Rev Genet 12: 846–860 [DOI] [PubMed] [Google Scholar]
- Bernhart SH, Tafer H, Mückstein U, Flamm C, Stadler PF, Hofacker IL 2006. Partition function and base pairing probabilities of RNA heterodimers. Algorithms Mol Biol 1: 3 doi: 10.1186/1748-7188-1-3 [DOI] [PMC free article] [PubMed] [Google Scholar]
- Brawand D, Soumillon M, Necsulea A, Julien P, Csardi G, Harrigan P, Weier M, Liechti A, Aximu-Petri A, Kircher M, et al. 2011. The evolution of gene expression levels in mammalian organs. Nature 478: 343–348 [DOI] [PubMed] [Google Scholar]
- Buard J, Barthes P, Grey C, de Massy B 2009. Distinct histone modifications define initiation and repair of meiotic recombination in the mouse. EMBO J 28: 2616–2624 [DOI] [PMC free article] [PubMed] [Google Scholar]
- Burroughs AM, Ando Y, de Hoon MJ, Tomaru Y, Nishibu T, Ukekawa R, Funakoshi T, Kurokawa T, Suzuki H, Hayashizaki Y, et al. 2010. A comprehensive survey of 3′ animal miRNA modification events and a possible role for 3′ adenylation in modulating miRNA targeting effectiveness. Genome Res 20: 1398–1410 [DOI] [PMC free article] [PubMed] [Google Scholar]
- Campo-Paysaa F, Sémon M, Cameron RA, Peterson KJ, Schubert M 2011. microRNA complements in deuterostomes: Origin and evolution of microRNAs. Evol Dev 13: 15–27 [DOI] [PubMed] [Google Scholar]
- Carthew RW, Sontheimer EJ 2009. Origins and mechanisms of miRNAs and siRNAs. Cell 136: 642–655 [DOI] [PMC free article] [PubMed] [Google Scholar]
- Chen K, Rajewsky N 2007. The evolution of gene regulation by transcription factors and microRNAs. Nat Rev Genet 8: 93–103 [DOI] [PubMed] [Google Scholar]
- Christodoulou F, Raible F, Tomer R, Simakov O, Trachana K, Klaus S, Snyman H, Hannon GJ, Bork P, Arendt D 2010. Ancient animal microRNAs and the evolution of tissue identity. Nature 463: 1084–1088 [DOI] [PMC free article] [PubMed] [Google Scholar]
- Csuros M 2010. Count: Evolutionary analysis of phylogenetic profiles with parsimony and likelihood. Bioinformatics 26: 1910–1912 [DOI] [PubMed] [Google Scholar]
- Dannemann M, Nickel B, Lizano E, Burbano HA, Kelso J 2012. Annotation of primate miRNAs by high throughput sequencing of small RNA libraries. BMC Genomics 13: 116 doi: 10.1186/1471-2164-13-116 [DOI] [PMC free article] [PubMed] [Google Scholar]
- Devor EJ, Samollow PB 2008. In vitro and in silico annotation of conserved and nonconserved microRNAs in the genome of the marsupial Monodelphis domestica. J Hered 99: 66–72 [DOI] [PubMed] [Google Scholar]
- Duret L, Galtier N 2009. Biased gene conversion and the evolution of mammalian genomic landscapes. Annu Rev Genomics Hum Genet 10: 285–311 [DOI] [PubMed] [Google Scholar]
- Edgar RC 2004. MUSCLE: Multiple sequence alignment with high accuracy and high throughput. Nucleic Acids Res 32: 1792–1797 [DOI] [PMC free article] [PubMed] [Google Scholar]
- Fahlgren N, Jogdeo S, Kasschau KD, Sullivan CM, Chapman EJ, Laubinger S, Smith LM, Dasenko M, Givan SA, Weigel D, et al. 2010. MicroRNA gene evolution in Arabidopsis lyrata and Arabidopsis thaliana. Plant Cell 22: 1074–1089 [DOI] [PMC free article] [PubMed] [Google Scholar]
- Friedländer MR, Chen W, Adamidi C, Maaskola J, Einspanier R, Knespel S, Rajewsky N 2008. Discovering microRNAs from deep sequencing data using miRDeep. Nat Biotechnol 26: 407–415 [DOI] [PubMed] [Google Scholar]
- Grabske RJ, Lake S, Gledhill BL, Meistrich ML 1975. Centrifugal elutriation: Separation of spermatogenic cells on the basis of sedimentation velocity. J Cell Physiol 86: 177–189 [DOI] [PubMed] [Google Scholar]
- Griffiths-Jones S, Grocock RJ, van Dongen S, Bateman A, Enright AJ 2006. miRBase: microRNA sequences, targets and gene nomenclature. Nucleic Acids Res 34: D140–D144 [DOI] [PMC free article] [PubMed] [Google Scholar]
- Grimson A, Farh KK, Johnston WK, Garrett-Engele P, Lim LP, Bartel DP 2007. MicroRNA targeting specificity in mammals: Determinants beyond seed pairing. Mol Cell 27: 91–105 [DOI] [PMC free article] [PubMed] [Google Scholar]
- Guioli S, Lovell-Badge R, Turner JM 2012. Error-prone ZW pairing and no evidence for meiotic sex chromosome inactivation in the chicken germ line. PLoS Genet 8: e1002560 doi: 10.1371/journal.pgen.1002560 [DOI] [PMC free article] [PubMed] [Google Scholar]
- Guo X, Su B, Zhou Z, Sha J 2009. Rapid evolution of mammalian X-linked testis microRNAs. BMC Genomics 10: 97 doi: 10.1186/1471-2164-10-97 [DOI] [PMC free article] [PubMed] [Google Scholar]
- Guo H, Ingolia NT, Weissman JS, Bartel DP 2010. Mammalian microRNAs predominantly act to decrease target mRNA levels. Nature 466: 835–840 [DOI] [PMC free article] [PubMed] [Google Scholar]
- Heimberg AM, Sempere LF, Moy VN, Donoghue PCJ, Peterson KJ 2008. MicroRNAs and the advent of vertebrate morphological complexity. Proc Natl Acad Sci 105: 2946–2950 [DOI] [PMC free article] [PubMed] [Google Scholar]
- Hertel J, Lindemeyer M, Missal K, Fried C, Tanzer A, Flamm C, Hofacker IL, Stadler PF, The students of Bioinformatics Computer Labs of 2004 and 2005 2006. The expansion of the metazoan microRNA repertoire. BMC Genomics 7: 25 doi: 10.1186/1471-2164-7-25 [DOI] [PMC free article] [PubMed] [Google Scholar]
- Hubbard TJ, Aken BL, Ayling S, Ballester B, Beal K, Bragin E, Brent S, Chen Y, Clapham P, Clarke L, et al. 2009. Ensembl 2009. Nucleic Acids Res 37: D690–D697 [DOI] [PMC free article] [PubMed] [Google Scholar]
- Julien P, Brawand D, Soumillon M, Necsulea A, Liechti A, Schütz F, Daish T, Grützner F, Kaessmann H 2012. Mechanisms and evolutionary patterns of Mammalian and avian dosage compensation. PLoS Biol 10: e1001328 doi: 10.1371/journal.pbio.1001328 [DOI] [PMC free article] [PubMed] [Google Scholar]
- Kertesz M, Iovino N, Unnerstall U, Gaul U, Segal E 2007. The role of site accessibility in microRNA target recognition. Nat Genet 39: 1278–1284 [DOI] [PubMed] [Google Scholar]
- Khil PP, Smirnova NA, Romanienko PJ, Camerini-Otero RD 2004. The mouse X chromosome is enriched for sex-biased genes not subject to selection by meiotic sex chromosome inactivation. Nat Genet 36: 642–646 [DOI] [PubMed] [Google Scholar]
- Kim VN, Han J, Siomi MC 2009. Biogenesis of small RNAs in animals. Nat Rev Mol Cell Biol 10: 126–139 [DOI] [PubMed] [Google Scholar]
- King M, Wilson A 1975. Evolution at two levels in humans and chimpanzees. Science 188: 107–116 [DOI] [PubMed] [Google Scholar]
- Kozomara A, Griffiths-Jones S 2011. miRBase: Integrating microRNA annotation and deep-sequencing data. Nucleic Acids Res 39: D152–D157 [DOI] [PMC free article] [PubMed] [Google Scholar]
- Landgraf P, Rusu M, Sheridan R, Sewer A, Iovino N, Aravin A, Pfeffer S, Rice A, Kamphorst AO, Landthaler M, et al. 2007. A mammalian microRNA expression atlas based on small RNA library sequencing. Cell 129: 1401–1414 [DOI] [PMC free article] [PubMed] [Google Scholar]
- Langmead B, Trapnell C, Pop M, Salzberg SL 2009. Ultrafast and memory-efficient alignment of short DNA sequences to the human genome. Genome Biol 10: R25 doi: 10.1186/gb-2009-10-3-r25 [DOI] [PMC free article] [PubMed] [Google Scholar]
- Lercher MJ, Urrutia AO, Hurst LD 2003. Evidence that the human X chromosome is enriched for male-specific but not female-specific genes. Mol Biol Evol 20: 1113–1116 [DOI] [PubMed] [Google Scholar]
- Li J, Liu Y, Dong D, Zhang Z 2010. Evolution of an X-linked primate-specific micro RNA cluster. Mol Biol Evol 27: 671–683 [DOI] [PubMed] [Google Scholar]
- Lu J, Shen Y, Wu Q, Kumar S, He B, Shi S, Carthew RW, Wang SM, Wu CI 2008. The birth and death of microRNA genes in Drosophila. Nat Genet 40: 351–355 [DOI] [PubMed] [Google Scholar]
- Morin RD, O'Connor MD, Griffith M, Kuchenbauer F, Delaney A, Prabhu AL, Zhao Y, McDonald H, Zeng T, Hirst M, et al. 2008. Application of massively parallel sequencing to microRNA profiling and discovery in human embryonic stem cells. Genome Res 18: 610–621 [DOI] [PMC free article] [PubMed] [Google Scholar]
- Mueller JL, Mahadevaiah SK, Park PJ, Warburton PE, Page DC, Turner JMA 2008. The mouse X chromosome is enriched for multicopy testis genes showing postmeiotic expression. Nat Genet 40: 794–799 [DOI] [PMC free article] [PubMed] [Google Scholar]
- Murchison EP, Kheradpour P, Sachidanandam R, Smith C, Hodges E, Xuan Z, Kellis M, Grützner F, Stark A, Hannon GJ 2008. Conservation of small RNA pathways in platypus. Genome Res 18: 995–1004 [DOI] [PMC free article] [PubMed] [Google Scholar]
- Niwa R, Slack FJ 2007. The evolution of animal microRNA function. Curr Opin Genet Dev 17: 145–150 [DOI] [PubMed] [Google Scholar]
- Pollard KS, Hubisz MJ, Rosenbloom KR, Siepel A 2010. Detection of nonneutral substitution rates on mammalian phylogenies. Genome Res 20: 110–121 [DOI] [PMC free article] [PubMed] [Google Scholar]
- Ramsköld D, Wang ET, Burge CB, Sandberg R 2009. An abundance of ubiquitously expressed genes revealed by tissue transcriptome sequence data. PLoS Comput Biol 5: e1000598 doi: 10.1371/journal.pcbi.1000598 [DOI] [PMC free article] [PubMed] [Google Scholar]
- Rice WR 1984. Sex chromosomes and the evolution of sexual dimorphism. Evolution 38: 735–742 [DOI] [PubMed] [Google Scholar]
- Robinson MD, McCarthy DJ, Smyth GK 2010. edgeR: A bioconductor package for differential expression analysis of digital gene expression data. Bioinformatics 26: 139–140 [DOI] [PMC free article] [PubMed] [Google Scholar]
- Roux J, Gonzalez-Porta M, Robinson-Rechavi M 2012. Comparative analysis of human and mouse expression data illuminates tissue-specific evolutionary patterns of miRNAs. Nucleic Acids Res 40: 5890–5900 [DOI] [PMC free article] [PubMed] [Google Scholar]
- Scarpino S, Morena AR, Petersen C, Froysa B, Soder O, Boitani C 1998. A rapid method of Sertoli cell isolation by DSA lectin, allowing mitotic analyses. Mol Cell Endocrinol 146: 121–127 [DOI] [PubMed] [Google Scholar]
- Sin HS, Ichijima Y, Koh E, Namiki M, Namekawa SH 2012. Human postmeiotic sex chromatin and its impact on sex chromosome evolution. Genome Res 22: 827–836 [DOI] [PMC free article] [PubMed] [Google Scholar]
- Song R, Ro S, Michaels JD, Park C, McCarrey JR, Yan W 2009. Many X-linked microRNAs escape meiotic sex chromosome inactivation. Nat Genet 41: 488–493 [DOI] [PMC free article] [PubMed] [Google Scholar]
- Stefani G, Slack FJ 2008. Small non-coding RNAs in animal development. Nat Rev Mol Cell Biol 9: 219–230 [DOI] [PubMed] [Google Scholar]
- Turner JMA 2007. Meiotic sex chromosome inactivation. Development 134: 1823–1831 [DOI] [PubMed] [Google Scholar]
- van der Ven PF, Speel EJ, Albrechts JC, Ramaekers FC, Hopman AH, Furst DO 1999. Assignment of the human gene for endosarcomeric cytoskeletal M-protein (MYOM2) to 8p23.3. Genomics 55: 253–255 [DOI] [PubMed] [Google Scholar]
- Wang PJ, McCarrey JR, Yang F, Page DC 2001. An abundance of X-linked genes expressed in spermatogonia. Nat Genet 27: 422–426 [DOI] [PubMed] [Google Scholar]
- Xiao C, Rajewsky K 2009. MicroRNA control in the immune system: Basic principles. Cell 136: 26–36 [DOI] [PubMed] [Google Scholar]
- Zhang H, Lee JY, Tian B 2005. Biased alternative polyadenylation in human tissues. Genome Biol 6: R100 doi: 10.1186/gb-2005-6-12-r100 [DOI] [PMC free article] [PubMed] [Google Scholar]
- Zhang R, Peng Y, Wang W, Su B 2007. Rapid evolution of an X-linked microRNA cluster in primates. Genome Res 17: 612–617 [DOI] [PMC free article] [PubMed] [Google Scholar]
- Zhang YE, Landback P, Vibranovski MD, Long M 2011. Accelerated recruitment of new brain development genes into the human genome. PLoS Biol 9: e1001179 doi: 10.1371/journal.pbio.1001179 [DOI] [PMC free article] [PubMed] [Google Scholar]