CircaDB: a database of mammalian circadian gene expression profiles (original) (raw)
Abstract
CircaDB (http://circadb.org) is a new database of circadian transcriptional profiles from time course expression experiments from mice and humans. Each transcript’s expression was evaluated by three separate algorithms, JTK_Cycle, Lomb Scargle and DeLichtenberg. Users can query the gene annotations using simple and powerful full text search terms, restrict results to specific data sets and provide probability thresholds for each algorithm. Visualizations of the data are intuitive charts that convey profile information more effectively than a table of probabilities. The CircaDB web application is open source and available at http://github.com/itmat/circadb.
INTRODUCTION
Circadian rhythms are biological rhythms of ∼24 h in many physiological and behavioral processes (1,2). These rhythms are generated by a cell autonomous circadian clock, present in most cells in mammals. This circadian clock is composed of interlocked transcriptional, translational feedback loops, where transactivators activate repressors that later feedback on the activators (3). Components of the required E-box loop include Bmal1, Bmal2, Clock and Npas2, bHLH-PAS transactivators, Per1, Per2 and Per3, PAS domain containing repressors and Cry1 and Cry2 (4), transcriptional repressors related to cryptochromes from plants and insects. An important secondary loop also exists, the ROR loop, which comprises Rev-erb-alpha, Rev-erb-beta, transcriptional repressors, as well as Rorα, Rorb and Rorγ, transcriptional activators (5–7). Factors in this loop regulate transcript levels of several of the E-box components including Bmal1, Cry1, Npas2 and Per2. The cAMP Responsive Element Binding Protein (CREB) pathway (8,9) and D-box binding factors, Dbp, Hlf, Tef, Nfil3, also regulate clock function (10,11). Thus, transcription factors play a major role in the functioning of the core clock.
In addition to regulating transcription of each other, clock factors also impart circadian rhythms in expression of many ‘output’ genes. First order clock control genes are those directly regulated by clock factors (e.g. Clock/Bmal1), while second order output genes could be regulated by a first-order clock-control gene, but not clock components (12–14). Because of this, the research community has spent more than a decade cataloging genes under clock control (12,13,15–17). Historically, these include many disease genes, drug targets and important components of various biological pathways (1,18–20). For example, HMG-CoA reductase, the rate limiting enzyme of cholesterol biosynthesis and target of statins, is under clock control in liver (21). Several factors have catalysed a more complete description of circadian rhythms, including the advent of DNA arrays (16) and now RNA sequencing (22), powerful statistical approaches to find rhythmic genes (23) and appropriate experimental design.
The goal of CircaDB is to systematically collect, analyse and visualize circadian expression profiles for bench researchers in a simple and straightforward fashion. Common queries are supported and include straightforward queries of expression profiles, as well as compound queries searching keywords in the gene annotation, in multiple tissues, with the ability to restrict results by probability of cycling.
MATERIALS AND METHODS
Various publicly available microarray time course studies (23–26) were collected (Table 1). References and links to download the expression data sets are outlined on the website. Data from each study were re-analysed using three circadian rhythm detection algorithms: JTK_CYCLE, Lombe Scargle, de Lichtenberg (23,27,28). Table 2 lists the runtime parameters of the algorithms on each data set. The reported expression values from each study were not filtered, as each algorithm accounts for technical replicates. The significance calls and other results reported by each algorithm were entered into a MySQL database.
Table 1.
Expresssion data sets in CircaDB
| Name | Time points | Species/tissue |
|---|---|---|
| Panda 2002 | 12 | Mouse suprachiasmatic nuclei (SCN) of the hypothalamus, and liver |
| Hughes 2009 | 48 | Mouse liver, NIH3T3 cells, pituitary gland and human U2OS cells |
| Miller 2007 and Andrews 2010 | 12 (WT) | Wild type mouse liver, SCN and skeletal muscle |
| 7 (KO) | Clock mutant mouse liver, SCN and skeletal muscle | |
| Rudic 2004 | 12 | Mouse aorta, kidney |
Table 2.
Runtime parameters for each data set and algorithm
| Data set | JTK_CYCLE | Lomb Scargle | De Lichtenberg |
|---|---|---|---|
| Panda 2002 | Periods: 16–32 h | minFrequency = 1/32, maxFrequncy = 1/18; (periods = 18–32 h; #test frequencies: 4*N | Period = 24 h |
| #Permutations = 10 000 | |||
| Hughes 2009 (mouse) | Periods: 6–42 h | minFrequency = 1/6, maxFrequncy = 1/42; (periods = 6–42 h; #test frequencies: 4*N | Period = 24 h |
| #Permutations = 10 000 | |||
| Hughes 2009 (human) | Periods: 6–42 h | minFrequency = 1/6, maxFrequncy = 1/42; (periods = 6–42 h; #test frequencies: 4*N | Period = 24 h |
| #Permutations = 10 000 | |||
| Miller 2007 | Periods: 16–32 h | minFrequency = 1/32, maxFrequncy = 1/18; (periods = 18–32 h; #test frequencies: 4*N | Period = 24 h |
| #Permutations = 10 000 | |||
| Andrews 2010 | Periods: 20–28 h | minFrequency = 1/6, maxFrequncy = 1/42; (periods = 6–42 h; #test frequencies: 4*N | Period = 24 h |
| #Permutations = 10 000 | |||
| Rudic 2004 | Periods: 16–32 h | minFrequency = 1/32, maxFrequncy = 1/18; (periods = 18–32 h; #test frequencies: 4*N | Period = 24 h |
| #Permutations = 10 000 |
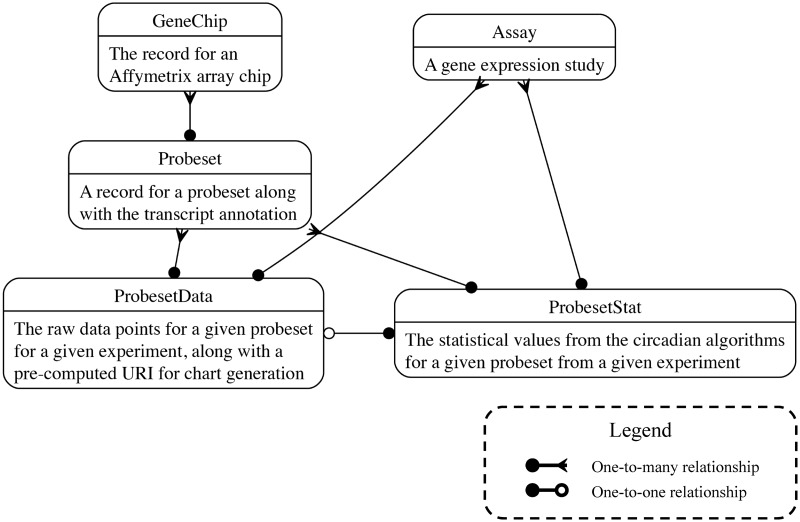
Gene annotation data were downloaded from the Affymetrix NetAffx resource (http://www.affymetrix.com/analysis/index.affx). Annotations were then entered into the database alongside the unfiltered experimental values and the results of the circadian rhythm detection algorithms. Transcript information was supplemented with links to the GeneWiki project (29,30) and Homologene (http://www.ncbi.nlm.nih.gov/homologene). The data model for the database is described in Figure 1.
Figure 1.
The database schema. Boxes represent table, and edges represent foreign key relationships. Further documentation is available at http://github.com/itmat/circadb.
The transcript annotation and the statistical results were indexed with the Sphinx full text search system (http://sphinxsearch.com/). Visualization of data is accomplished by created using pre-formatted URI requests to the Google Charts API (https://developers.google.com/chart/). The web application was coded using the Ruby on Rails framework (http://rubyonrails.org/).
All source code for data loading and the web application is licensed under the GNU General Public License (GPL-2.0) license and available at http://github.com/itmat/circadb.
RESULTS AND DISCUSSION
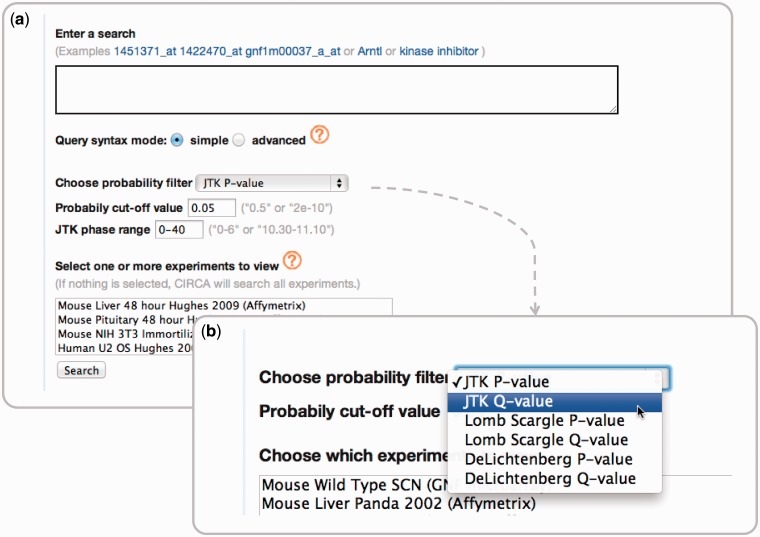
In creating CircaDB, we have provided the research community a clear, concise and powerful interface for querying genes within the context of circadian expression profile data. Another circadian expression database, Diurnal 2.0 (31), provides a similar resource to CircaDB but focuses on plant data. It also restricts its initial search to transcript accessions, whereas CircaDB allows full query capabilities on gene annotation. CircaDB provides advanced keyword search capabilities of gene annotation. This includes the ability to search by phrases, boolean conditions and combinations thereof. Queries can also be restricted by a given experiment’s data set, phase of expression and significance of a particular algorithm (Figure 2).
Figure 2.
(a) The query interface for CircaDB. The interface consists of a simple and powerful full-text search capability, with possible restrictions on the data sets, phase information and a significance threshold for a given algorithm. (b) The set of available threshold categories for the circadian classification algorithms.
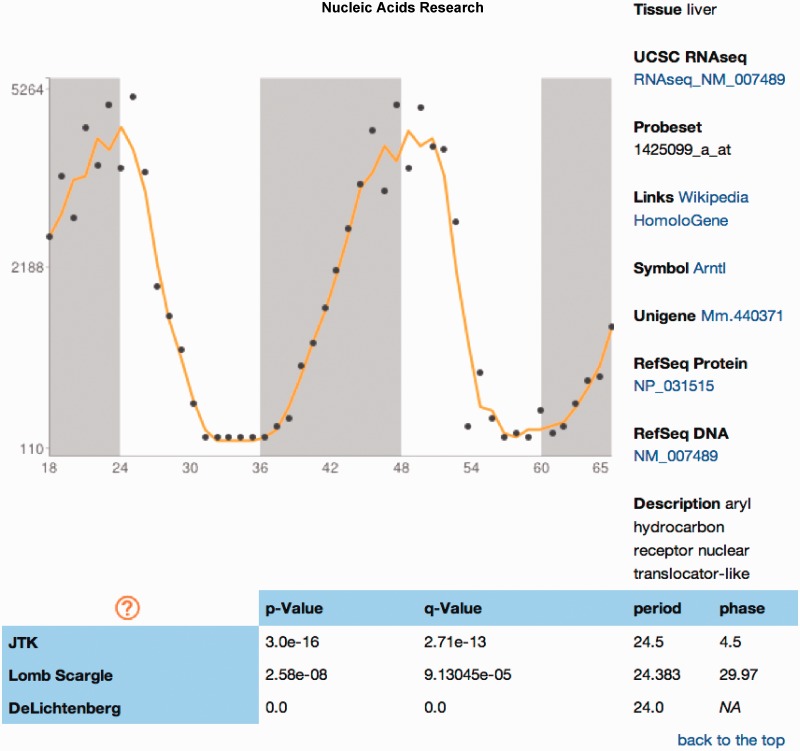
The Database of Circadian Gene Expression (24), part of the Gene Atlas Project (32), contains a subset of the same data sets in CircaDB, but uses a single circadian expression algorithm. CircaDB contains all of these data and re-analysed them with newer and more robust set of algorithms (23,27,28). Three algorithms were used to allow for the inspection of the differences between each algorithm’s results (Figure 3). CircaDB is actively maintained and will continue to add new features and data sets as time they become available. Requests for integration of data sets are handled via submitting a request via the project site at Github. CiraDB also provides integration expression profiles for use within BioGPS (33).
Figure 3.
Expression profile report. A simple visualization of the data accompanies the main annotation of the gene probe, probability values from various circadian rhythm detection algorithms and other circadian information.
Finally, to facilitate use of this database framework by other researcher groups, we have made the source code for the application freely available under the GPL 2.0 open source license. The project has been recently used to visualize circadian experiments for Anopheles gambiae (34). All of these together make CircaDB a unique and valuable resource for the circadian research community.
FUNDING
The National Institutes of Health, the National Center for Advancing Translational Sciences [8UL1TR000003] (to Garret FitzGerald, University of Pennsylvania); National Heart, Lung, and Blood Institute [1R01HL097800-04 to J.B.H.]; the Defense Advanced Research Projects Agency [BAA-11-65] (to John Harer, Duke University). Funding for open access charge: Departmental Funds.
Conflict of interest statement. None declared.
REFERENCES
- 1.Hastings MH, Reddy AB, Maywood ES. A clockwork web: circadian timing in brain and periphery, in health and disease. Nat. Rev. Neurosci. 2003;4:649–661. doi: 10.1038/nrn1177. [DOI] [PubMed] [Google Scholar]
- 2.Green CB, Takahashi JS, Bass J. The meter of metabolism. Cell. 2008;134:728–742. doi: 10.1016/j.cell.2008.08.022. [DOI] [PMC free article] [PubMed] [Google Scholar]
- 3.Lowrey PL, Takahashi JS. Mammalian circadian biology: elucidating genome-wide levels of temporal organization. Annual review of genomics and human genetics. 2004;5:407–4. doi: 10.1146/annurev.genom.5.061903.175925. [DOI] [PMC free article] [PubMed] [Google Scholar]
- 4.Ko CH, Takahashi JS. Molecular components of the mammalian circadian clock. Hum. Mol. Genet. 2006;15:R271–R277. doi: 10.1093/hmg/ddl207. [DOI] [PubMed] [Google Scholar]
- 5.Yin L, Lazar MA. The orphan nuclear receptor Rev-erbalpha recruits the N-CoR/histone deacetylase 3 corepressor to regulate the circadian Bmal1 gene. Mol. Endocrinol. 2005;19:1452–1459. doi: 10.1210/me.2005-0057. [DOI] [PubMed] [Google Scholar]
- 6.Guillaumond F, Dardente H, Giguère V, Cermakian N. Differential control of Bmal1 circadian transcription by REV-ERB and ROR nuclear receptors. J. Biol Rhythms. 2005;20:391–403. doi: 10.1177/0748730405277232. [DOI] [PubMed] [Google Scholar]
- 7.Takeda Y, Jothi R, Birault V, Jetten AM. RORγ directly regulates the circadian expression of clock genes and downstream targets in vivo. Nucleic Acids Res. 2012;40:8519–8535. doi: 10.1093/nar/gks630. [DOI] [PMC free article] [PubMed] [Google Scholar]
- 8.Akashi M, Hayasaka N, Yamazaki S, Node K. Mitogen-activated protein kinase is a functional component of the autonomous circadian system in the suprachiasmatic nucleus. J Neurosci. 2008;28:4619–4623. doi: 10.1523/JNEUROSCI.3410-07.2008. [DOI] [PMC free article] [PubMed] [Google Scholar]
- 9.Sanada K, Okano T, Fukada Y. Mitogen-activated protein kinase phosphorylates and negatively regulates basic helix-loop-helix-PAS transcription factor BMAL1. J. Biol. Chem. 2002;277:267–271. doi: 10.1074/jbc.M107850200. [DOI] [PubMed] [Google Scholar]
- 10.Ueda HR, Hayashi S, Chen W, Sano M, Machida M, Shigeyoshi Y, Iino M, Hashimoto S. System-level identification of transcriptional circuits underlying mammalian circadian clocks. Nat. Genet. 2005;37:187–192. doi: 10.1038/ng1504. [DOI] [PubMed] [Google Scholar]
- 11.Ukai-Tadenuma M, Yamada RG, Xu H, Ripperger JA, Liu AC, Ueda HR. Delay in feedback repression by cryptochrome 1 is required for circadian clock function. Cell. 2011;144:268–281. doi: 10.1016/j.cell.2010.12.019. [DOI] [PubMed] [Google Scholar]
- 12.Hughes ME, DiTacchio L, Hayes KR, Vollmers C, Pulivarthy S, Baggs JE, Panda S, Hogenesch JB. Harmonics of circadian gene transcription in mammals. PLoS Genet. 2009;5:e1000442. doi: 10.1371/journal.pgen.1000442. [DOI] [PMC free article] [PubMed] [Google Scholar]
- 13.Gachon F, Olela FF, Schaad O, Descombes P, Schibler U. The circadian PAR-domain basic leucine zipper transcription factors DBP, TEF, and HLF modulate basal and inducible xenobiotic detoxification. Cell Metabol. 2006;4:25–36. doi: 10.1016/j.cmet.2006.04.015. [DOI] [PubMed] [Google Scholar]
- 14.Poliandri AHB, Gamsby JJ, Christian M, Spinella MJ, Loros JJ, Dunlap JC, Parker MG. Modulation of clock gene expression by the transcriptional coregulator receptor interacting protein 140 (RIP140) J. Biol. Rhythms. 2011;26:187–199. doi: 10.1177/0748730411401579. [DOI] [PMC free article] [PubMed] [Google Scholar]
- 15.Storch K-F, Lipan O, Leykin I, Viswanathan N, Davis FC, Wong WH, Weitz CJ. Extensive and divergent circadian gene expression in liver and heart. Nature. 2002;417:78–83. doi: 10.1038/nature744. [DOI] [PubMed] [Google Scholar]
- 16.Kornmann B, Schaad O, Bujard H, Takahashi JS, Schibler U. System-driven and oscillator-dependent circadian transcription in mice with a conditionally active liver clock. PLoS Biol. 2007;5:e34. doi: 10.1371/journal.pbio.0050034. [DOI] [PMC free article] [PubMed] [Google Scholar]
- 17.Hughes ME, Hong H-K, Chong JL, Indacochea AA, Lee SS, Han M, Takahashi JS, Hogenesch JB. Brain-specific rescue of clock reveals system-driven transcriptional rhythms in peripheral tissue. PLoS Genet. 2012;8:e1002835. doi: 10.1371/journal.pgen.1002835. [DOI] [PMC free article] [PubMed] [Google Scholar]
- 18.Takahashi JS, Hong H-K, Ko CH, McDearmon EL. The genetics of mammalian circadian order and disorder: implications for physiology and disease. Nat. Rev. Genet. 2008;9:764–75. doi: 10.1038/nrg2430. [DOI] [PMC free article] [PubMed] [Google Scholar]
- 19.Curtis AM, Fitzgerald GA. Central and peripheral clocks in cardiovascular and metabolic function. Ann. Med. 2006;38:552–9. doi: 10.1080/07853890600995010. [DOI] [PubMed] [Google Scholar]
- 20.Sancar A, Lindsey-Boltz LA, Kang T-H, Reardon JT, Lee JH, Ozturk N. Circadian clock control of the cellular response to DNA damage. FEBS Lett. 2010;584:2618–2625. doi: 10.1016/j.febslet.2010.03.017. [DOI] [PMC free article] [PubMed] [Google Scholar]
- 21.Le Martelot G, Claudel T, Gatfield D, Schaad O, Kornmann B, Sasso GL, Moschetta A, Schibler U. REV-ERBalpha participates in circadian SREBP signaling and bile acid homeostasis. PLoS Biol. 2009;7:e1000181. doi: 10.1371/journal.pbio.1000181. [DOI] [PMC free article] [PubMed] [Google Scholar]
- 22.Hughes ME, Grant GR, Paquin C, Qian J, Nitabach MN. Deep sequencing the circadian and diurnal transcriptome of Drosophila brain. Genome Res. 2012;22:1266–81. doi: 10.1101/gr.128876.111. [DOI] [PMC free article] [PubMed] [Google Scholar]
- 23.Hughes ME, Hogenesch JB, Kornacker K. JTK_CYCLE: an efficient nonparametric algorithm for detecting rhythmic components in genome-scale data sets. J. Biol. Rhythms. 2010;25:372–380. doi: 10.1177/0748730410379711. [DOI] [PMC free article] [PubMed] [Google Scholar]
- 24.Panda S, Antoch MP, Miller BH, Su AI, Schook AB, Straume M, Schultz PG, Kay SA, Takahashi JS, Hogenesch JB. Coordinated transcription of key pathways in the mouse by the circadian clock. Cell. 2002;109:307–320. doi: 10.1016/s0092-8674(02)00722-5. [DOI] [PubMed] [Google Scholar]
- 25.Andrews JL, Zhang X, McCarthy JJ, McDearmon EL, Hornberger TA, Russell B, Campbell KS, Arbogast S, Reid MB, Walker JR, et al. CLOCK and BMAL1 regulate MyoD and are necessary for maintenance of skeletal muscle phenotype and function. Proc. Natl Acad. Sci. USA. 2010;107:19090–19095. doi: 10.1073/pnas.1014523107. [DOI] [PMC free article] [PubMed] [Google Scholar]
- 26.Rudic RD, McNamara P, Curtis A-M, Boston RC, Panda S, Hogenesch JB, Fitzgerald GA. BMAL1 and CLOCK, two essential components of the circadian clock, are involved in glucose homeostasis. PLoS Biol. 2004;2:e377. doi: 10.1371/journal.pbio.0020377. [DOI] [PMC free article] [PubMed] [Google Scholar]
- 27.Glynn EF, Chen J, Mushegian AR. Detecting periodic patterns in unevenly spaced gene expression time series using Lomb-Scargle periodograms. Bioinformatics. 2006;22:310–316. doi: 10.1093/bioinformatics/bti789. [DOI] [PubMed] [Google Scholar]
- 28.de Lichtenberg U, Jensen LJ, Fausbøll A, Jensen TS, Bork P, Brunak S. Comparison of computational methods for the identification of cell cycle-regulated genes. Bioinformatics. 2005;21:1164–1171. doi: 10.1093/bioinformatics/bti093. [DOI] [PubMed] [Google Scholar]
- 29.Huss JW, Orozco C, Goodale J, Wu C, Batalov S, Vickers TJ, Valafar F, Su AI. A gene wiki for community annotation of gene function. PLoS Biol. 2008;6:e175. doi: 10.1371/journal.pbio.0060175. [DOI] [PMC free article] [PubMed] [Google Scholar]
- 30.Huss JW, Lindenbaum P, Martone M, Roberts D, Pizarro A, Valafar F, Hogenesch JB, Su AI. The Gene Wiki: community intelligence applied to human gene annotation. Nucleic acids research. 2010;38:D633–D639. doi: 10.1093/nar/gkp760. [DOI] [PMC free article] [PubMed] [Google Scholar]
- 31.Mockler TC, Michael TP, Priest HD, Shen R, Sullivan CM, Givan SA, McEntee C, Kay SA, Chory J. The DIURNAL project: DIURNAL and circadian expression profiling, model-based pattern matching, and promoter analysis. Cold Spring Harb. Symp. Quant. Biol. 2007;72:353–363. doi: 10.1101/sqb.2007.72.006. [DOI] [PubMed] [Google Scholar]
- 32.Su AI, Wiltshire T, Batalov S, Lapp H, Ching KA, Block D, Zhang J, Soden R, Hayakawa M, Kreiman G, et al. A gene atlas of the mouse and human protein-encoding transcriptomes. Proc. Natl Acad. Sci. USA. 2004;101:6062–6067. doi: 10.1073/pnas.0400782101. [DOI] [PMC free article] [PubMed] [Google Scholar]
- 33.Wu C, Orozco C, Boyer J, Leglise M, Goodale J, Batalov S, Hodge CL, Haase J, Janes J, Huss JW, et al. BioGPS: an extensible and customizable portal for querying and organizing gene annotation resources. Genome Biol. 2009;10:R130. doi: 10.1186/gb-2009-10-11-r130. [DOI] [PMC free article] [PubMed] [Google Scholar]
- 34.Rund SSC, Hou TY, Ward SM, Collins FH, Duffield GE. Genome-wide profiling of diel and circadian gene expression in the malaria vector Anopheles gambiae. Proc. Natl Acad. Sci. USA. 2011;108:E421–E430. doi: 10.1073/pnas.1100584108. [DOI] [PMC free article] [PubMed] [Google Scholar]


