Arsenic trioxide-mediated oxidative stress and genotoxicity in human hepatocellular carcinoma cells (original) (raw)
Abstract
Background
Arsenic is a ubiquitous environmental toxicant, and abnormalities of the skin, lung, kidney, and liver are the most common outcomes of long-term arsenic exposure. This study was designed to investigate the possible mechanisms of genotoxicity induced by arsenic trioxide in human hepatocellular carcinoma cells.
Methods and results
A mild cytotoxic response of arsenic trioxide was observed in human hepatocellular carcinoma cells, as evident by (3-(4,5-dimethyl thiazol-2-yl)-2, 5-diphenyl tetrazolium bromide) and lactate dehydrogenase assays after 24 and 48 hours of exposure. Arsenic trioxide elicited a significant (P < 0.01) reduction in glutathione (15.67% and 26.52%), with a concomitant increase in malondialdehyde level (67.80% and 72.25%; P < 0.01), superoxide dismutase (76.42% and 81.09%; P < 0.01), catalase (73.33% and 76.47%; P < 0.01), and reactive oxygen species generation (44.04% and 56.14%; P < 0.01) after 24 and 48 hours of exposure, respectively. Statistically significant (P < 0.01) induction of DNA damage was observed by the comet assay in cells exposed to arsenic trioxide. It was also observed that apoptosis occurred through activation of caspase-3 and phosphatidylserine externalization in human hepatocellular carcinoma cells exposed to arsenic trioxide.
Conclusion
The results demonstrate that arsenic trioxide induces apoptosis and genotoxicity in human hepatocellular carcinoma cells through reactive oxygen species and oxidative stress.
Keywords: arsenic trioxide, DNA damage, hepatocellular carcinoma cells, oxidative stress, apoptosis
Introduction
Arsenic is a naturally occurring element in the earth’s crust and is distributed throughout the environment by water. In addition, arsenic compounds are used for treatment of human disease as well as in agricultural applications, such as insecticides, fertilizers, and fungicides.1 The first time arsenic trioxide was used in cancer therapy was to treat acute promyelocytic leukemia, and there are now studies reporting the cytotoxic potential of arsenic trioxide in mammalian cells.2,3 Yedjou et al4 reported that the cytotoxicity of arsenic trioxide was mediated through generation of reactive oxygen species and oxidative stress. Apoptosis induced by arsenic trioxide is also associated with generation of reactive oxygen species that contribute significantly to cell killing.5 Arsenic trioxide has been found to be genotoxic in human cells.6 In addition, a few studies have shown that exposure to arsenic increases the frequency of micronuclei, chromosome aberrations, and sister chromatid exchanges both in humans and animals.7 Reactive oxygen species are an important factor not only in the apoptosis process but also in DNA damage, oxidative stress-induced damage, and many other cellular processes.8–10 Oxidative stress and DNA damage induced by arsenic trioxide occur via production of superoxide and hydrogen peroxide radicals, specifically reactive oxygen species.11 The mechanism of genotoxicity is not clearly understood, but may be due to the ability of arsenate to inhibit DNA and replicating or repair enzymes.12 However, information about the mechanisms of apoptosis and genotoxicity induced by arsenic trioxide is scarce.
In the present study, we used human hepatocellular carcinoma cells because the human hepatic system plays an important role in the digestion of xenobiotic compounds. Subsequently, measurement of reactive oxygen species using the 2,7-dichlorfluorescein-diacetate (DCFH-DA) assay was done to determine whether reactive oxygen species generation could be a possible mechanism in the observed cytotoxicity of arsenic trioxide. The comet assay is a promising technique that has been applied mainly to the study of single-strand DNA breaks induced by a variety of toxic agents, including chemical compounds, ionizing radiation, nanoparticles in cells, and aquatic organisms.13–15 Thus, the present investigations were carried out to study the mechanisms of apoptosis and genotoxicity induced by arsenic trioxide in human hepatocellular carcinoma cells through reactive oxygen species generation and oxidative stress.
Materials and methods
Chemicals and reagents
Fetal bovine serum, penicillin-streptomycin, and Dulbecco’s modified Eagle’s medium/F-12 medium were purchased from Invitrogen (Carlsbad, CA). Glutathione, 5, 5-dithio-bis-(2-nitrobenzoic acid) (DTNB), MTT (3-(4,5-dimethylthiazol-2-yl)-2,5-diphenyltetrazoliumbromide), DCFH-DA, Annexin V FITC, and propidium iodide were obtained from Sigma-Aldrich (St Louis, MO). Arsenic trioxide was purchased from Merck (Whitehouse Station, NJ). All other chemicals were obtained from commercial sources and were of analytical reagent grade.
Cell culture and exposure of arsenic trioxide
A human hepatocellular carcinoma cell line (passage 28) was sourced from the American Type Culture Collection (Accession HB-8065, Rockville, MD), preserved, subcultured up to passage 40 in the laboratory, and then used to determine cell viability after exposure to arsenic trioxide. The cells were cultured in Dulbecco’s modified Eagle’s medium/F-12 medium supplemented with 10% fetal bovine serum and penicillin-streptomycin 100 U/mL at 5% CO2 and 37°C. At 85% confluence, the cells were harvested using 0.25% trypsin and subcultured in 75 cm2 flasks, six-well plates, and 96-well plates according to the experiment being performed. The cells were allowed to attach to the surface for 24 hours prior to treatment. A stock solution of arsenic trioxide 1 mg/mL was made in slightly acidic water (Milli Q, Millipore, Billerica, MA) and diluted to appropriate concentrations in cell culture medium.
Cell morphology
The morphology of the hepatocellular carcinoma cells was observed using a DMIL phase-contrast microscope (Leica, Wetzlar, Germany) after exposure to different concentrations of arsenic trioxide for 24 and 48 hours.
Mitochondrial function
An MTT assay was used to investigate mitochondrial function as described by Mossman.16 Briefly, 1 × 10⁴ cells/well were seeded in 96-well plates and exposed to different concentrations (0.1, 0.5, 2.5, 5.0, 10, and 20 ìg/mL) of arsenic trioxide for 24 and 48 hours. At the end of exposure, the culture medium was replaced with new medium containing MTT solution (0.5 mg/mL) and incubated for 4 hours at 37°C. As a result, a formazan crystal was formed and was dissolved in dimethyl sulfoxide. The plates were kept on a shaker for 10 minutes at room temperature and then analyzed at 530 nm using a Multiwell microplate reader (FLUOstar Omega, BMG Lab Technologies Inc, Durham, NC). Untreated sets were also run under identical conditions and served as controls.
Lactate dehydrogenase leakage assay
The release of cytoplasmic lactate dehydrogenase into the culture medium was determined by Wroblewski and LaDue.17 The hepatocellular carcinoma cells were treated with arsenic trioxide at concentrations of 0.1, 0.5, 2.5, 5.0, 10, and 20 ìg/mL for 24 and 48 hours. After exposure, 100 ìL samples from the centrifuged culture medium were collected. The lactate dehydrogenase activity was assayed in 3.0 mL of reaction mixture with 100 ìL of pyruvic acid (2.5 mg/mL phosphate buffer) and 100 ìL of reduced nicotinamide adenine dinucleotide (NADH) (2.5 mg/mL phosphate buffer) and the rest of the volume was adjusted with phosphate buffer (0.1 M, pH 7.4). The rate of NADH oxidation was determined by following the decrease in absorbance at 340 nm for 3 minutes at one-minute intervals and 25°C using a spectrophotometer (Varian-Cary 300 Bio, Varian Medical Systems Inc, Palo Alto, CA). The amount of lactate dehydrogenase released is expressed as lactate dehydrogenase activity (IU/L) in culture medium.
Measurement of intracellular reactive oxygen species
Generation of reactive oxygen species was assessed in the hepatocellular carcinoma cells after exposure to different concentrations (0.1, 0.5, 2.5, 5.0, and 10 ìg/mL) of arsenic trioxide using DCFH-DA dye as a fluorescence agent.18 Reactive oxygen species generation was studied by two methods, ie, fluorometric analysis and microscopic fluorescence imaging. For fluorometric analysis, cells (1 × 10⁴ per well) were seeded in 96-well black bottom culture plates and allowed to adhere for 24 hours in a CO2 incubator at 37°C. The hepatocellular carcinoma cells were then exposed to the above concentrations of arsenic trioxide for 24 and 48 hours. On completion of the respective exposure periods, the cells were incubated with DCFH-DA (10 mM) for 30 minutes at 37°C. The reaction mixture was aspirated and replaced by 200 ìL of phosphate-buffered solution in each well. The plates were kept on a shaker for 10 minutes at room temperature in the dark. Fluorescence intensity was measured using a Multiwell microplate reader (FLUOstar) at an excitation wavelength of 485 nm and at emission wavelength of 528 nm, and the values were expressed as a percentage of fluorescence intensity relative to the control wells.
A parallel set of cells (5 × 10⁴ per well) was analyzed for intracellular fluorescence using an upright fluorescence microscope equipped with a charge-coupled device color camera (Nikon Eclipse 80i equipped with a Nikon DS-Ri1 12.7 mega pixel camera, Nikon, Tokyo, Japan).
Oxidative stress biomarkers
Cells at a final density of about 6 × 10⁶ in a 75 cm2 culture flask were exposed to different concentrations of arsenic trioxide (0.1, 0.5, 2.5, 5.0, and 10ìg/mL) for 24 and 48 hours. After exposure, the cells were scraped and washed twice with chilled 1x phosphate-buffered solution. The harvested cell pellets were lysed in cell lysis buffer (20 mM Tris-HCl [pH 7.5], 150 mM NaCl, 1 mM Na2EDTA, 1% Triton, and 2.5 mM sodium pyrophosphate). The cells were centrifuged at 15,000 g for 10 minutes at 4°C and the supernatant (cell extract) was maintained on ice until assayed for oxidative stress biomarkers. Protein content was measured using the method described by Bradford19 using bovine serum albumin as the standard.
Lipid peroxidation assay
The extent of membrane lipid peroxidation was estimated by measuring the formation of malondialdehyde using the method of Ohkawa et al.20 Malondialdehyde is one of the products of membrane lipid peroxidation. A mixture of 0.1 mL cell extract and 1.9 mL of 0.1 M sodium phosphate buffer (pH 7.4) was incubated at 37°C for one hour. The incubation mixture, after precipitation with 5% trichloroacetic acid was centrifuged (2300 g for 15 minutes at room temperature) and the supernatant was collected. Next, 1.0 mL of 1% thiobarbituric acid was added to the supernatant and placed in boiling water for 15 minutes. After cooling to room temperature, absorbance of the mixture was taken at 532 nm and expressed in nmol malondialdehyde/hour/mg protein using a molar extinction coefficient of 1.56 × 10⁵ M per cm.
Glutathione estimation
The glutathione level was quantified using Ellman’s reagent.21 The assay mixture contained phosphate buffer, DTNB, and cell extract. The reaction was monitored at 412 nm and the amount of glutathione was expressed in terms of nmol glutathione per mg protein.
Measurement of super oxide dismutase
Superoxide dismutase activity was estimated employing a method described by Kakkar et al.22 The assay mixture contained sodium pyrophosphate buffer, nitroblue tetrazolium, phenazine methosulphate, reduced NADH, and the required volume of cell extract. One unit of superoxide dismutase enzyme activity is defined as the amount of enzyme required for inhibiting chromogen production (optical density at 560 nm) by 50% in one minute under assay conditions and expressed as specific activity in units per minute per mg protein.
Measurement of catalase level
Catalase activity was measured by following its ability to split hydrogen peroxide (H2O2) within one minute of incubation time. The reaction was then stopped by adding dichromate-acetic acid reagent, and the remaining H2O2 was determined by measuring the chromic acetate formed by reduction of dichromate-acetic acid in the presence of H2O2 at 570 nm as described elsewhere.23 Catalase activity was expressed as ìmol H2O2 decomposed per minute per mg protein.
Caspase-3 assay
The activity of caspase-3 was determined from the cleavage of the caspase-3 substrate (N-acetyl-DEVD-p-nitroaniline), with p-nitroaniline used as the standard. Cleavage of the substrate was monitored at 405 nm, and its specific activity was expressed in picomoles of the product (nitroaniline) per minute per mg of protein.
4’,6-diamidino-2-phenylindole (DAPI) staining for chromosome condensation
Chromosome condensation in hepatocellular carcinoma cells due to arsenic trioxide was observed by DAPI staining according to the method described by Dhar-Mascareno et al.24 The DAPI solution was added to the exposed cells on eight chamber slides, which were incubated for 10 minutes in the dark at 37°C. Images of the nuclei were captured by a Nikon fluorescence microscope at an excitation of 330 nm and at an emission of 420 nm.
Phosphatidylserine externalization
Human hepatocellular carcinoma cells (5 × 10⁴) were seeded in eight-chamber precoated slides (Nunc, Roskilde, Denmark). After 24 hours, the cells were exposed to different concentrations of arsenic trioxide for 24 hours. After exposure to arsenic trioxide, the cells were incubated in Hank’s Buffered Salt Solution for 15 minutes with 5 μL of Annexin V-FITC and 5 μL of propidium iodide. The cells were then fixed using fresh ice-cold 2% paraformaldehyde in Hank’s Buffered Salt Solution for 15 minutes. Fluorescence was observed with a confocal microscope (Leica DMRB/E, confocal scanner Leica TCS 4D) using 485 nm excitation and 525 nm emission for Annexin-V and 580 nm excitation and 610 nm emission for propidium iodide (40×, NA = 1.4).
Determination of DNA strand breakage
Alkaline single cell gel electrophoresis (the comet assay) was performed as a three-layer procedure25 with slight modification.15 In brief, 70,000 cells/well were seeded in a six-well plate. After 24 hours of seeding, the cells were treated with different concentrations (0.1, 0.5, 1.5, and 2.5 μg/mL) of arsenic trioxide for 24 and 48 hours. After treatment, the hepatocellular carcinoma cells were trypsinized and resuspended in Dulbecco’s modified Eagle’s medium. The cell suspension was then centrifuged at 1200 rpm and 4°C for 5 minutes. The cell pellet was finally suspended in chilled phosphate-buffered solution for single cell gel electrophoresis. Viability of the cells was evaluated using the trypan blue exclusion method.26 The cell samples showing viability greater than 84% were further processed for single cell gel electrophoresis. In brief, about 15 μL of cell suspension (approximately 20,000 cells) was mixed with 85 μL of 0.5% low melting point agarose and layered on one end of a frosted plain glass slide precoated with a 200 μL layer of normal agarose (1%). Next, it was covered with a third layer of 100 μL of low melting-point agarose. After solidification of the gel, the slides were immersed in lysing solution (2.5 M NaCl, 100 mM Na2EDTA, 10 mM Tris pH 10, with 10% dimethyl sulfoxide and 1% Triton X-100 added fresh) overnight at 4°C. The slides were then placed in a horizontal gel electrophoresis unit. Fresh cold alkaline electrophoresis buffer (300 mM NaOH, 1 mM Na2 EDTA, and 0.2% dimethyl sulfoxide, pH 13.5) was poured into the chamber and left for 20 minutes at 4°C for DNA unwinding and conversion of alkali-labile sites to single-strand breaks. Electrophoresis was carried out using the same solution at 4°C for 20 minutes at 15 V (0.8 V/cm) and 300 mA. The slides were neutralized gently with 0.4 M Tris buffer at pH 7.5 and stained with 75 μL of ethidium bromide (20 μg/mL). For the positive control, hepatocellular carcinoma cells were treated with 100 μM H2O2 for 10 minutes at 4°C. Two slides were prepared from each well (per concentration) and 50 cells per slide (100 cells per concentration) were scored randomly and analyzed using an image analysis system (Komet-5.0, Kinetic Imaging, Liverpool, UK) attached to a fluorescence microscope (DMLB, Leica) equipped with appropriate filters. The parameters, ie, percent tail DNA (ie, percent tail DNA = 100 − % head DNA) and olive tail moment were selected for quantification of DNA damage in the hepatocellular carcinoma cells as determined by the software.
Statistical analysis
At least three independent experiments were carried out in duplicate for each experiment. Data were expressed as the mean (± standard error) and analyzed by one-way analysis of variance. P < 0.01 was considered to be statistically significant.
Results
Effect of arsenic trioxide on morphological changes and cytotoxicity
Figure 1 shows the comparative morphology of untreated and arsenic trioxide-treated hepatocellular carcinoma cells. Morphological changes in the cells started to become visible after exposure to arsenic trioxide 0.5 μg/mL for 24 hours. After 48 hours, the cells treated with arsenic trioxide 5.0 μg/mL changed to a spherical shape and detached from the surface (Figure 1B). The morphology of the hepatocellular carcinoma cells exposed to arsenic trioxide was consistent with the membrane damage and cytotoxicity results.
Figure 1.

Morphology of human hepatocellular carcinoma cells. (A) Control cells and (B) cells exposed to 5.0 μg/mL of arsenic trioxide for 48 hours (magnification 200×).
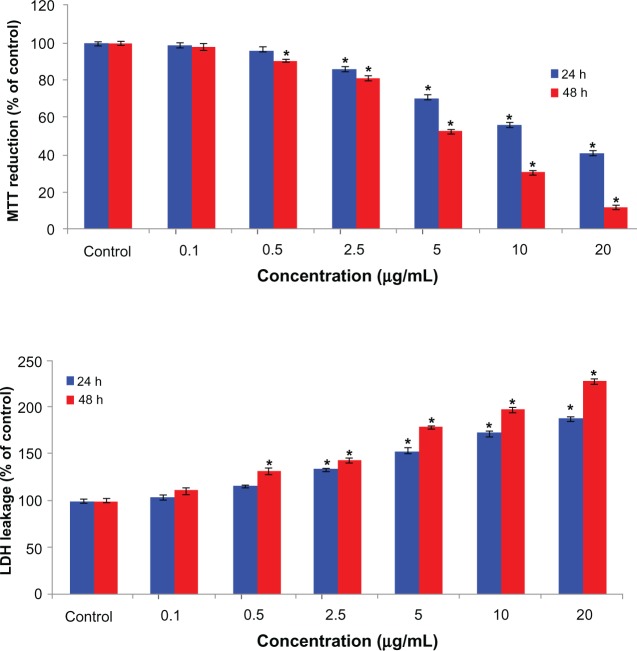
We examined mitochondrial function (by MTT reduction) and membrane damage (by lactate dehydrogenase leakage) as end points for cytotoxicity. The MTT results demonstrated concentration-dependent and time-dependent cytotoxicity after exposure to arsenic trioxide in the hepatocellular carcinoma cells (Figure 2A). The MTT reduction observed after 24 hours of exposure at the concentrations of 2.5, 5.0, 10, and 20 μg/mL was 86%, 70%, 56.0%, and 40.70%, respectively, with a further reduction to 81%, 53%, 30.41%, and 12.20% after 48 hours of exposure. Arsenic trioxide was also found to induce lactate dehydrogenase leakage in a concentration-dependent and time-dependent manner (Figure 2B).
Figure 2.
Cytotoxicity of arsenic trioxide in human hepatocellular carcinoma cells for 24 hours and 48 hours. (A) MTT reduction and (B) lactate dehydrogenase leakage.
Notes: Each value represents the mean ± standard error of three experiments performed in duplicate. *P < 0.01 versus control.
Abbreviations: LDH lactate dehydrogenase leakage; MTT, 3-(4,5-dimethyl thiazol-2-yl)-2, 5-diphenyl tetrazolium bromide.
Arsenic trioxide-induced reactive oxygen species generation and oxidative stress
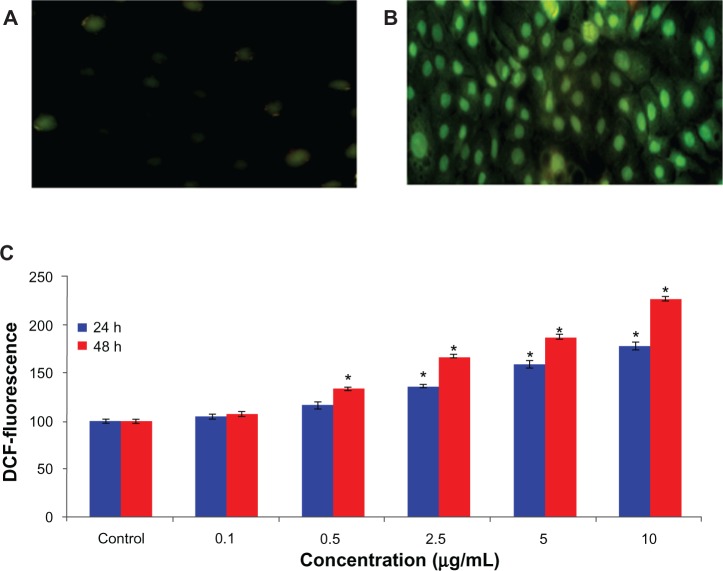
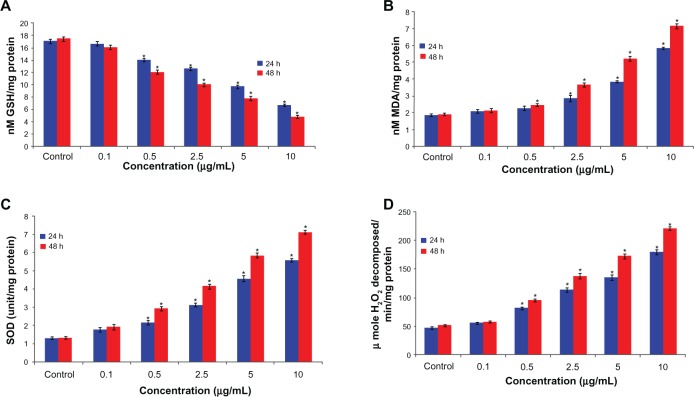
The ability of arsenic trioxide to induce oxidative stress was evaluated by measuring levels of reactive oxygen species, lipid peroxidation, glutathione, superoxide dismutase, and catalase in the hepatocellular carcinoma cells. The results showed that arsenic trioxide induced generation of intracellular reactive oxygen species in a dose-dependent and time-dependent manner (Figure 3A–C). Arsenic trioxide-induced oxidative stress was further evidenced by depletion of glutathione and induction of lipid peroxidation, superoxide dismutase, and catalase with increasing concentrations and duration of arsenic trioxide exposure (Figure 4A–D).
Figure 3.
Representative microphotographs showing arsenic trioxide-induced reactive oxygen species generation in human hepatocellular carcinoma cells. Reactive oxygen species generation was studied using dichlorofluorescein diacetate dye. The images were captured by a Nikon phase contrast fluorescence microscope. (A) Control cells, (B) cells exposed to 2.5 μg/mL of arsenic trioxide, (C) and percentage change in reactive oxygen species generation assessed by microplate reader after 24 and 48 hours of exposure to various concentrations of arsenic trioxide in human hepatocellular carcinoma cells.
Notes: Each value represents the mean ± standard error of three experiments performed in duplicate. *P < 0.01 versus control.
Abbreviation: DCF, 2’,7’-dichlorofluorescein.
Figure 4.
(A) Lipid peroxide, (B) glutathione, (C) superoxide dismutase (D) and catalase levels in human hepatocellular carcinoma cells after exposure to arsenic trioxide for 24 and 48 hours.
Notes: Each value represents the mean ± standard error of three experiments performed in duplicate. *P < 0.01 versus control.
Abbreviations: SOD, Superoxide dismutase; MDA, Malondialdehyde, GSH Glutathione; H2O2, hydrogen per oxide.
Induction of caspase-3 activity and chromosome condensation by arsenic trioxide
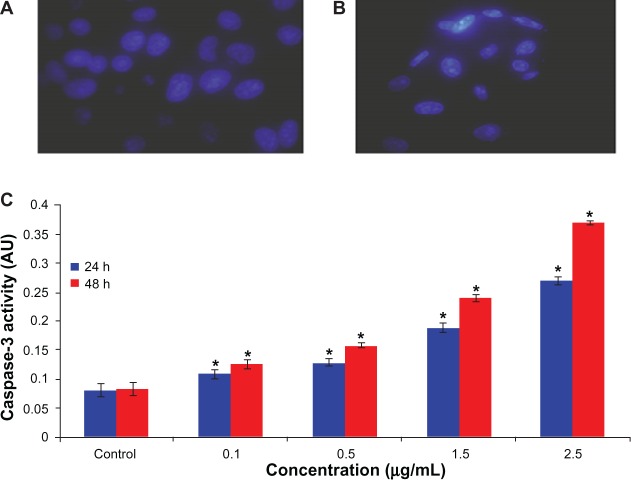
Caspase-3, which plays a key role in the apoptotic pathway, was induced following treatment with arsenic trioxide (Figure 5C). When cells were treated with 0.1, 0.5, 1.5, and 2.5 μg/mL concentrations of arsenic trioxide for 24 and 48 hours, the activity of caspase-3 was increased even from the lowest concentration of 0.1 μg/mL to the highest concentration of 2.5 μg/mL. In addition to caspase-3 activity, chromatin condensation was also evaluated by DAPI staining. When cells were treated with the above concentrations of arsenic trioxide for 24 hours, chromatin condensations were observed in the treated group in a concentration-dependent manner (Figure 5A and B). The caspase-3 activation and chromatin condensation in hepatocellular carcinoma cells suggest that arsenic trioxide caused cell death via an apoptotic process.
Figure 5.
Increase in chromosome condensation and caspase-3 activity in human hepatocellular carcinoma cells after exposure to arsenic trioxide for 24 and 48 hours. (A) Control cells, (B) cells exposed to 2.5 μg/mL of arsenic trioxide, and (C) caspase-3 activity.
Notes: Each value represents the mean ± standard error of three experiments. *P < 0.01 versus control.
Abbreviation: AU, arbitrary units.
Externalization of phosphatidylserine by arsenic trioxide
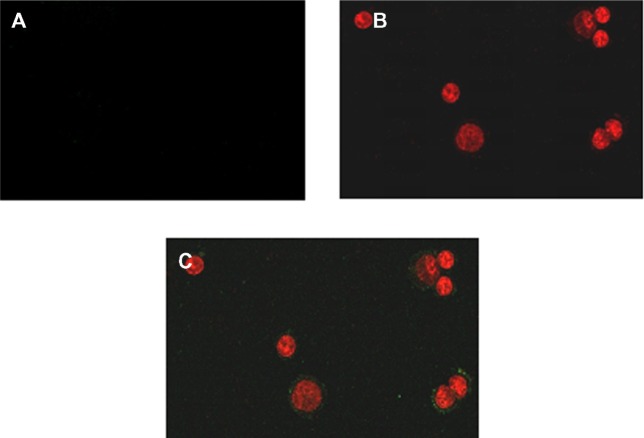
Externalization of phosphatidylserine, another marker of apoptosis, is one of the first events in the apoptotic process. The externalization of phosphatidylserine from the inner to the outer surface of the lipid bilayer membrane occurs without disruption of other membrane components. We assessed externalization of phosphatidylserine in hepatocellular carcinoma cells treated with arsenic trioxide using Annexin-V FITC as a specific marker. Both Annexin-V FITC and propidium iodide fluorescence were observed in the arsenic trioxide-treated cells. The results suggest that either early apoptosis or necrosis was induced in the treated cells (Figure 6B and C). No externalization of phosphatidylserine was observed in untreated hepatocellular carcinoma cells (Figure 6A).
Figure 6.
Phosphatidylserine translocation in human hepatocellular carcinoma cells. (A) Control cells, (B) red fluorescence is propidium iodide indicating disruption of the plasma membrane, and (C) green fluorescence is phosphatidylserine detected on the outer surface of the plasma membrane by Annexin-V-FITC in arsenic trioxide-treated cells.
Note: The data are representative of three independent experiments.
DNA damage by arsenic trioxide
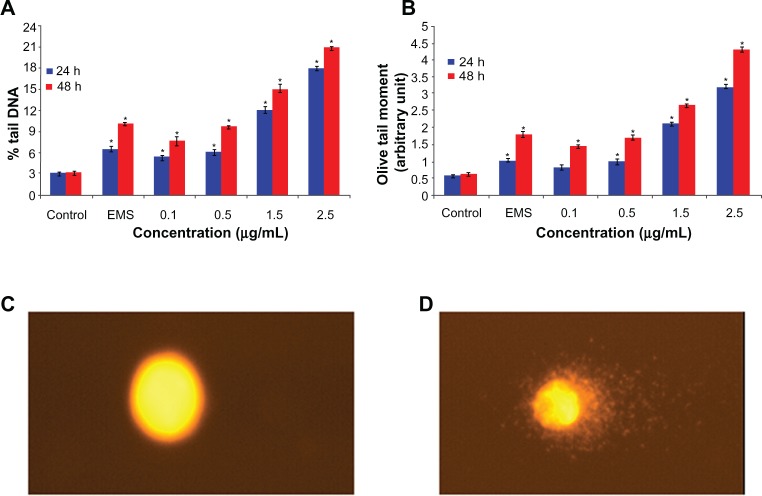
DNA damage was measured as percent tail DNA and olive tail moment in both the controls and exposed cells. During electrophoresis, DNA in the cells was observed to migrate more rapidly towards the anode at the highest concentration than at the lowest concentration. The cells exposed to different concentrations of arsenic trioxide showed significantly (P > 0.01) more DNA damage in cells than did the control cells. The gradual nonlinear increase in DNA damage was observed in cells as the dose and duration of exposure to arsenic trioxide increased. The greatest DNA damage was recorded in hepatocellular carcinoma cells exposed to 2.5 μg/mL arsenic trioxide (see Figure 7).
Figure 7.
DNA damage in human hepatocellular carcinoma cells after 24 and 48 hours of exposure to different concentrations of arsenic trioxide. (A) Percent tail DNA, (B) olive tail moment (arbitrary unit), (C) control cells, (D) and exposed cells.
Notes: Each value represents the mean ± standard error of three experiments performed in duplicate. *P < 0.01 versus control.
Abbreviation: EMS, Ethyl methane sulfonate.
Discussion
Reactive oxygen species generation and cellular oxidative stress have been cited as a possible mechanism for the toxicity of arsenic trioxide.27 Our results also show arsenic trioxide-induced cytotoxicity and oxidative stress in human hepatocellular carcinoma cells. Arsenic trioxide induced generation of reactive oxygen species in the treated cells. Levels of malondialdehyde, a marker of lipid peroxidation, were significantly higher and antioxidant glutathione levels were significantly lower in arsenic trioxide-treated cells. Levels of the antioxidant enzymes, superoxide dismutase and catalase, were also significantly higher in the cells exposed to arsenic trioxide. Depletion of glutathione in arsenic trioxide-exposed cells combined with the increased levels of reactive oxygen species, lipid peroxidation, superoxide dismutase, and catalase, suggest that oxidative stress might be the primary mechanism for the toxicity of arsenic trioxide in human hepatocellular carcinoma cells. Our results are consistent with previous studies suggesting that the cytotoxicity of arsenic trioxide is mediated via generation of reactive oxygen species and oxidative stress.28
Apoptosis is a key process in the development and progression of cancer. The ability of cancer cells to avoid apoptosis and continue to propagate is one of the basic characteristics of cancer and is a major target in the development of cancer therapy.29 We have provided evidence that arsenic trioxide induces apoptosis in hepatocellular carcinoma cells. In support of this finding, our results also show that arsenic trioxide activates the caspase-3 enzyme. Furthermore, externalization of phosphatydylserine and chromosomal condensation occurred in arsenic trioxide-exposed cells, suggesting that these could be excellent biomarkers to assess the apoptotic response. Our results are consistent with the finding by other investigators that arsenic trioxide has the potential to induce apoptotic cell death.30
In the present study, various concentrations of arsenic trioxide caused a significant increase in mean percentage tail DNA and olive tail moment indicative of DNA damage after 24 hours of treatment when compared with controls. The mean percentage tail DNA and olive tail moment showed a dose-related and time-related increase at different concentrations of arsenic trioxide. The DNA damage caused by arsenic trioxide in the present study can be explained on the basis of the experimental evidence of its genotoxic effect. Its mode of action may include inhibition of various enzymes involved in DNA repair and expression, and possibly induction of reactive oxygen species capable of inflicting DNA damage. Walker et al31 reported that arsenic trioxide is acutely toxic to both breast carcinoma and lung carcinoma cell lines. Moreover, in vivo studies have also reported that arsenic trioxide induces micronuclei in Swiss albino mice after 24 hours of exposure.32 The fact that arsenic is able to cause chromosomal damage but unable to induce direct mutations has led to the concept that arsenic promotes DNA damage by inhibiting DNA repair. Arsenic trioxide has been found to induce gene expression of a number of stress response proteins, such as ubiquitin, that has resulted in alteration of the DNA repair mechanisms causing DNA damage.33,34 After 48 hours of treatment, all the doses showed a significant increase in DNA damage when compared with those at 24 hours post-treatment. This can be attributed to inefficient DNA repairing capacity and increased levels of free oxygen radicals. Glutathione is known to provide good protection against xenobiotics. Depletion of glutathione below a critical concentration allows enhancement of lipid peroxidation evoked by endogenous substances. This could result in oxidative stress leading to induction of reactive oxygen species that play a key role in DNA damage. Arsenic trioxide is reported to deplete cellular glutathione levels and to induce oxidative stress.11 This could result in induction of reactive oxygen species affecting DNA repair mechanisms, leading to DNA damage. Arsenic trioxide is reported to induce reactive oxygen species in mammalian cells, also causing DNA damage.35 The findings of the above studies contribute to the observed DNA damage caused by different doses of arsenic trioxide. It is reported that the presence of arsenic trioxide in the body activates antioxidants, such as superoxide dismutase and catalase, to metabolize the reactive oxygen species causing damage to DNA.36 Reactive oxygen species typically include the superoxide radical (O2−), hydrogen peroxide and the hydroxyl radical (•OH), which cause damage to cellular components, including DNA, and ultimately apoptotic cell death.37,38 The results of the present study are in agreement with the findings of Yedjou et al4 for human leukemia (HL-60) and human Jurkat T cells exposed to arsenic trioxide. Gallagher39 has also shown that in certain leukemia cell lines, thiol diester bonds are lysed by arsenic trioxide and that this is the main mechanism of cytotoxicity. Reactive oxygen species, such as hydrogen peroxide, superoxide anion, singlet oxygen, and hydroxyl radicals, can directly or indirectly damage cellular DNA and protein.40 Consequently, arsenic trioxide shows much promise as a new anticancer agent given its specific apoptotic activity in cancer cells, as shown in this work. Long-term biological safety is another issue that will need clarification in future investigations. Our results demonstrate arsenic trioxide-induced oxidative stress, caspase-3 activity, and DNA strand breaks in human hepatocellular carcinoma cells. Therefore, arsenic trioxide has the potential to be a potent cytotoxic and genotoxic agent capable of inducing DNA damage.
Acknowledgment
The authors extend their appreciation to the Deanship of Scientific Research at King Saud University for funding this study through research group project RGP-VPP-180.
Footnotes
Disclosure
The authors report no conflicts of interest in this work.
References
- 1.Murgo AJ. Clinical trials of arsenic trioxide in hematologic and solid tumors: overview of the National Cancer Institute Cooperative Research and Development studies. Oncologist. 2001;6:22–28. doi: 10.1634/theoncologist.6-suppl_2-22. [DOI] [PubMed] [Google Scholar]
- 2.Chow SKY, Chan JYW, Fung KP. Inhibition of cell proliferation and the action mechanisms of arsenic trioxide (As203) on human breast cancer cells. J Cell Biochem. 2004;93:173–187. doi: 10.1002/jcb.20102. [DOI] [PubMed] [Google Scholar]
- 3.Udensi UK, Graham-Evans BE, Rogers CS, Isokpehi RD. Cytotoxicity patterns of arsenic trioxide exposure on HaCaT keratinocytes. Clin Cosmet Investig Dermatol. 2011;4:183–190. doi: 10.2147/CCID.S24677. [DOI] [PMC free article] [PubMed] [Google Scholar]
- 4.Yedjou CG, Tchouwou PB. In-vitro cytotoxic and genotoxic effects of arsenic trioxide on human leukemia (HL-60) cells using the MTT and alkaline single cell electrophoresis (comet) assays. Mol Cell Biochem. 2007;301:123–130. doi: 10.1007/s11010-006-9403-4. [DOI] [PMC free article] [PubMed] [Google Scholar]
- 5.Huang HS, Chang WC, Chen CJ. Involvement of reactive oxygen species in arsenite-induced down regulation of phospholipid hydroperoxide glutathione peroxidase in human epidermoid carcinoma A431 cells. Free Radic Biol Med. 2002;33:864–873. doi: 10.1016/s0891-5849(02)00983-8. [DOI] [PubMed] [Google Scholar]
- 6.Graham-Evans B, Cohly HHP, Yu H, Tchounwou PB. Arsenic-induced genotoxic and cytotoxic effects in human keratinocytes, melanocytes and dendritic cells. Int J Environ Res Public Health. 2004;1:83–89. doi: 10.3390/ijerph2004020083. [DOI] [PubMed] [Google Scholar]
- 7.Waclavicek M, Berer A, Oehler L, et al. Calcium ionophore: a single reagent for the differentiation of primary human acute myelogenous leukaemia cells towards dendritic cells. Br J Haematol. 2001;114:466–473. doi: 10.1046/j.1365-2141.2001.02970.x. [DOI] [PubMed] [Google Scholar]
- 8.Fahmy B, Cormier SA. Copper oxide nanoparticles induce oxidative stress and cytotoxicity in airway epithelial cells. Toxicol In Vitro. 2009;23:1365–1371. doi: 10.1016/j.tiv.2009.08.005. [DOI] [PMC free article] [PubMed] [Google Scholar]
- 9.Patlolla A, Patlolla B, Tchounwou P. Evaluation of cell viability, DNA damage, and cell death in normal human dermal fibroblast cells induced by functionalized multi walled carbon nanotube. Mol Cell Biochem. 2010;338:225–232. doi: 10.1007/s11010-009-0356-2. [DOI] [PubMed] [Google Scholar]
- 10.Ye JS, Li J, Yu YM, Wei Q, Deng WF, Yu LX. L-carnitine attenuates oxidant injury in HK-2 cells via ROS-mitochondria pathway. Regul Pept. 2010;161:58–66. doi: 10.1016/j.regpep.2009.12.024. [DOI] [PubMed] [Google Scholar]
- 11.Matsui M, Nishigori C, Toyokuni S, et al. The role of oxidative DNA damage in human arsenic carcinogenesis: detection of 8-hydroxy-2′-deoxyguano sine in arsenic-related Bowen’s disease. J Invest Dermatol. 1999;113:26–31. doi: 10.1046/j.1523-1747.1999.00630.x. [DOI] [PubMed] [Google Scholar]
- 12.Li JH, Rossman TG. Inhibition of DNA ligase activity by arsenite: a possible mechanism of its co mutagenesis. Mol Toxicol. 1989;2:1–9. [PubMed] [Google Scholar]
- 13.Tice RR, Agurell E, Anderson D, et al. Single cell gel/comet assay: guidelines for in vitro and in vivo genetic toxicology testing. Environ Mol Mutagen. 2000;35:206–221. doi: 10.1002/(sici)1098-2280(2000)35:3<206::aid-em8>3.0.co;2-j. [DOI] [PubMed] [Google Scholar]
- 14.Collins AR. The comet assay for DNA damage and repair principles, applications, and limitations. Mol Biotechnol. 2004;26:249–260. doi: 10.1385/MB:26:3:249. [DOI] [PubMed] [Google Scholar]
- 15.Ali D, Nagpure NS, Kumar S, Kumar R, Kushwaha B. Genotoxicity assessment of acute exposure of chlorpyriphos to fresh water fish Channa punctatus (Bloch) using micronucleus assay and alkaline single-cell gel electrophoresis. Chemosphere. 2008;71:1823–1831. doi: 10.1016/j.chemosphere.2008.02.007. [DOI] [PubMed] [Google Scholar]
- 16.Mossman T. Rapid colorimetric assay for cellular growth and survival: application to proliferation and cytotoxicity assays. J Immunol Methods. 1983;65:55–63. doi: 10.1016/0022-1759(83)90303-4. [DOI] [PubMed] [Google Scholar]
- 17.Wroblewski F, LaDue JS. Lactate dehydrogenase activity in blood. Proc Soc Exp Biol Med. 1955;90:210–213. doi: 10.3181/00379727-90-21985. [DOI] [PubMed] [Google Scholar]
- 18.Wang H, Joseph JA. Quantifying cellular oxidative stress by dichlorofluorescein assay using micro plate reader. Free Radical Biol Med. 1999;27:612–616. doi: 10.1016/s0891-5849(99)00107-0. [DOI] [PubMed] [Google Scholar]
- 19.Bradford MM. A rapid and sensitive method for the quantization of microgram quantities of protein utilizing the principle of protein-dye binding. Anal Biochem. 1976;72:248–254. doi: 10.1016/0003-2697(76)90527-3. [DOI] [PubMed] [Google Scholar]
- 20.Ohkawa H, Ohishi N, Yagi K. Assay for lipid peroxides in animal tissues by thiobarbituric acid reaction. Anal Biochem. 1979;95:351–358. doi: 10.1016/0003-2697(79)90738-3. [DOI] [PubMed] [Google Scholar]
- 21.Ellman G. Tissue sulfhydryl groups. Arch Biochem Biophys. 1959;82:70–77. doi: 10.1016/0003-9861(59)90090-6. [DOI] [PubMed] [Google Scholar]
- 22.Kakkar PS, Das B, Viswanathan PN. A modified spectrophotometric assay of superoxide dismutase. Indian J Biochem Biophys. 1984;21:130–132. [PubMed] [Google Scholar]
- 23.Sinha AK. Colorimetric assay of catalase. Anal Biochem. 1972;47:389–394. doi: 10.1016/0003-2697(72)90132-7. [DOI] [PubMed] [Google Scholar]
- 24.Dhar-Mascareno M, Carcamo JM, Golde DW. Hypoxia-reoxygenation-induced mitochondrial damage and apoptosis in human endothelial cells are inhibited by vitamin C. Free Radic Biol Med. 2005;38:1311–1322. doi: 10.1016/j.freeradbiomed.2005.01.017. [DOI] [PubMed] [Google Scholar]
- 25.Singh NP, McCoy MT, Tice RR, Schneider EL. A simple technique for quantization of low levels of DNA damage in individual cells. Exp Cell Res. 1988;175:184–191. doi: 10.1016/0014-4827(88)90265-0. [DOI] [PubMed] [Google Scholar]
- 26.Anderson D, Yu TW, Philips BJ, Schmezer P. The effect of various antioxidants and other modifying agents on oxygen-radical-generated DNA damage in human lymphocytes in the COMET assay. Mutat Res. 1994;307:261–271. doi: 10.1016/0027-5107(94)90300-x. [DOI] [PubMed] [Google Scholar]
- 27.Laurence M, Alain D, Francette J, et al. Arsenic trioxide induces apoptosis of cutaneous T cell lymphoma cells: evidence for a partially caspase-independent pathway and potentiation by ascorbic acid (vitamin C) J Invest Dermatol. 2003;121:881–893. doi: 10.1046/j.1523-1747.2003.12479.x. [DOI] [PubMed] [Google Scholar]
- 28.Jomova K, Jenisova Z, Feszterova M, et al. Arsenic: toxicity, oxidative stress and human disease. J Appl Toxicol. 2011;31:95–107. doi: 10.1002/jat.1649. [DOI] [PubMed] [Google Scholar]
- 29.Ashkenazi A. Targeting death and decoy receptors of the tumor-necrosis factor super family. Nat Rev Cancer. 2002;2:420–430. doi: 10.1038/nrc821. [DOI] [PubMed] [Google Scholar]
- 30.Yoon-Jae K, Jin-Yong C, Seung GL, et al. Arsenic trioxide-induced apoptosis in TM4 Sertoli cells: the potential involvement of p21 expression and p53 phosphorylation. Toxicology. 2011;285:142–151. doi: 10.1016/j.tox.2011.04.013. [DOI] [PubMed] [Google Scholar]
- 31.Walker AM, Stevens JJ, Tchounwou PB. Arsenic trioxide mediated cytotoxicity and cell proliferation in breast and lung carcinoma cell lines. Met Ions Biol Med. 2006;9:287–292. [Google Scholar]
- 32.Biswas S, Talukder G, Sharma A. Prevention of cytotoxic effects of arsenic by short-term dietary supplementation with selenium in mice in vivo. Mutat Res. 1999;441:155–160. doi: 10.1016/s1383-5718(99)00028-5. [DOI] [PubMed] [Google Scholar]
- 33.Bond U, Schlesinger MJ. Ubiquitin is a heat shock protein in chicken embryo fibroblasts. Mol Cell Biol. 1985;5:949–956. doi: 10.1128/mcb.5.5.949. [DOI] [PMC free article] [PubMed] [Google Scholar]
- 34.Parag HA, Raboy B, Kulka RG. Effects of heat shock on protein degradation in mammalian cells involvement of the ubiquitin system. EMBO J. 1987;6:55–61. doi: 10.1002/j.1460-2075.1987.tb04718.x. [DOI] [PMC free article] [PubMed] [Google Scholar]
- 35.Hei K, Liu SX, Waldren C. Mutagenicity of arsenic in mammalian cells: role of reactive oxygen species. Proc Natl Acad Sci U S A. 1998;95:8103–8107. doi: 10.1073/pnas.95.14.8103. [DOI] [PMC free article] [PubMed] [Google Scholar]
- 36.Nordenson I, Beckman L. Is the genotoxic effect of arsenic mediated by oxygen free radicals? Hum Hered. 1991;41:71–73. doi: 10.1159/000153979. [DOI] [PubMed] [Google Scholar]
- 37.Ott M, Gogvadze V, Orrenius S, Zhivotovsky B. Mitochondria, oxida-tive stress and cell death. Apoptosis. 2007;12:913–922. doi: 10.1007/s10495-007-0756-2. [DOI] [PubMed] [Google Scholar]
- 38.Rana SV. Metals and apoptosis: recent developments. J Trace Elem Med Biol. 2008;22:262–284. doi: 10.1016/j.jtemb.2008.08.002. [DOI] [PubMed] [Google Scholar]
- 39.Gallagher RE. Arsenic: new life for an old potion. N Engl J Med. 1998;339:1389–1391. doi: 10.1056/NEJM199811053391909. [DOI] [PubMed] [Google Scholar]
- 40.Abernathy C, Liu Y, Longfellow D, et al. Arsenic: health effects, mechanism of actions, and research issues. Environ Health Perspect. 1999;107:1–8. doi: 10.1289/ehp.99107593. [DOI] [PMC free article] [PubMed] [Google Scholar]
