In Vivo Light-Induced Activation of Neural Circuitry in Transgenic Mice Expressing Channelrhodopsin-2 (original) (raw)
. Author manuscript; available in PMC: 2013 Apr 24.
SUMMARY
Channelrhodopsin-2 (ChR2) is a light-gated, cation-selective ion channel isolated from the green algae Chlamydomonas reinhardtii. Here, we report the generation of transgenic mice that express a ChR2-YFP fusion protein in the CNS for in vivo activation and mapping of neural circuits. Using focal illumination of the cerebral cortex and olfactory bulb, we demonstrate a highly reproducible, light-dependent activation of neurons and precise control of firing frequency in vivo. To test the feasibility of mapping neural circuits, we exploited the circuitry formed between the olfactory bulb and the piriform cortex in anesthetized mice. In the olfactory bulb, individual mitral cells fired action potentials in response to light, and their firing rate was not influenced by costimulated glomeruli. However, in piriform cortex, the activity of target neurons increased as larger areas of the bulb were illuminated to recruit additional glomeruli. These results support a model of olfactory processing that is dependent upon mitral cell convergence and integration onto cortical cells. More broadly, these findings demonstrate a system for precise manipulation of neural activity in the intact mammalian brain with light and illustrate the use of ChR2 mice in exploring functional connectivity of complex neural circuits in vivo.
INTRODUCTION
Mapping functional circuits within the nervous system has been a major goal for both cellular and systems neuroscience. To this end, a great deal of effort has been placed on determining the functional connections that comprise different sensory and motor systems in vivo and how these connections contribute to neural computations. To date, much of the work addressing these questions consists of anterograde and retrograde labeling techniques, in conjunction with independent electrophysiological recordings. It has been challenging to combine these two approaches into a single experiment by genetically specifying a population of cells to be simultaneously monitored by a fluorescent reporter and manipulated to elicit precise electrophysiological activity. Although the recent use of genetically targeted, heterologous receptors has proven successful in stimulating neural activity in vitro (Zemelman et al., 2002, 2003) and in invertebrate model systems (Liedtke et al., 2003; Lima and Miesenbock, 2005; Nagel et al., 2005a), such in vivo manipulations have remained elusive in the mammalian nervous system.
Techniques for anatomical visualization of neurons and their axonal projections, such as transgenic expression systems, viral transduction, and vital dyes, have been extensively utilized to define the overall blueprint for diverse neural circuitry (Chen et al., 2000; Feng et al., 2000; Gan et al., 2000; Kobbert et al., 2000; Maskos et al., 2002; Song et al., 2005). A shortcoming of these anatomical methods is the inability to reveal direct information regarding the functional connectivity of a given circuit. For this, in vivo electrophysiological studies have been invaluable (Kandel et al., 2000; Shepherd, 2004) but are limited by the lack of technologies for evoking a spatially restricted or cell type-specific neural activity. Current methods of neural stimulation rely largely on either local application of undiscriminating fields of electrical currents, glutamate uncaging, or the presentation of artificial sensory stimuli. Incorporating spatial and temporal control over neural activity through genetic manipulation of neuronal subsets would allow for a more precise means to map functional brain circuitry. Manipulating activity in this manner requires a tool that can be genetically encoded and allows simple and rapid control of neuronal firing. Recent in vitro, in ovo, and viral transduction studies have revealed the light-gated ion channel Channelrhodopsin-2 (ChR2) as a potentially ideal candidate for this approach (Nagel et al., 2003, 2005b; Boyden et al., 2005; Li et al., 2005; Bi et al., 2006; Zhang and Oertner, 2007).
ChR2 is a 7-transmembrane-helix protein from the unicellular green algae Chlamydomonas reinhardtii that opens as a nonselective cation channel upon the concomitant binding of _all-trans_-retinal and activation by photons (Nagel et al., 2003, 2005b). In dissociated hippocampal neuron cultures, the rapid influx of cations into cells expressing ChR2 leads to depolarization and initiation of action potentials with precise temporal control (Boyden et al., 2005; Li et al., 2005; Nagel et al., 2005a). Here, we report a novel mouse model with targeted expression of a heterologous ChR2-YFP fusion protein in the CNS for precise activation of spatially defined subsets of neurons with light and have sought to determine whether this activity could be monitored transsynaptically in downstream target cells in vivo. To test the utility of our mouse model for in vivo circuit analysis, we took advantage of the known connectivity and experimental tractability of the mouse olfactory system.
Olfactory circuits first converge in the formation of discrete glomeruli in the olfactory bulb (Mombaerts et al., 1996; Mombaerts, 1999) and then expand through distributed connections made by mitral cells projecting to the olfactory cortex (Shepherd, 2004; Shepherd et al., 2004). Studies using dye tracers have revealed a widespread network of contacts in the piriform cortex originating from single mitral cells located in the bulb (Ojima et al., 1984; Buonviso et al., 1991; Johnson et al., 2000). Using genetic tracing techniques (Zou et al., 2001) and patterns of immediate-early gene expression in response to odor stimuli (Illig and Haberly, 2003; Zou et al., 2005), recent studies have found that mitral cells project their afferents into the piriform cortex to conserved domains based on glomerular origin. Electrophysiological experiments indicate that individual mitral cells make strong synaptic connections with neurons in the piriform cortex, suggesting that only a few mitral cells need to be active to elicit action potentials in target neurons in the piriform cortex (Franks and Isaacson, 2006). Other studies find that action potential generation in the piriform cortex relies on multiple subthreshold synaptic inputs from several mitral cells dispersed over the bulb surface (Johnson et al., 2000; Zou and Buck, 2006; Lei et al., 2006). Ultimately, to determine the level of mitral cell convergence and synaptic integration required for initiation of action potentials in the piriform cortex requires precise control overmitral cell activation with high temporal precision across bulbar space.
In the present study, we report the generation and use of transgenic mice expressing ChR2-YFP from the Thy1 promoter and further demonstrate precise regulation of neuronal activity by focal illumination of cells transgenically expressing ChR2-YFP. We demonstrate a high degree of temporal resolution and fidelity in light-evoked response properties that can be obtained in vivo. We subsequently apply this mouse model to the problem of olfactory cortical integration by presenting focal light stimulation in the olfactory bulb while recording electrophysiological responses in both the bulb and piriform cortex. By varying the size and area of bulb photostimulation, we find that olfactory information processing shows a high degree ofmitral cell convergence and integration onto the piriform cortex. Thus, transgenic Thy1-ChR2-YFP mice can be utilized for the precise and rapid activation of genetically defined populations of mammalian neurons. As such, this model system enables controlled neuronal stimulation for exploring complex brain circuitry in vivo. As a proof of principle for the in vivo application of this approach, we have focused on the main olfactory bulb (MOB), using simultaneous photostimulation and electrophysiological recordings both in vivo and in brain slices. We expect that this approach will be applicable to other brain regions and neuronal populations and will have both in vivo and in vitro applications. A separate paper characterizes in more detail these mice and their use for manipulation of neuronal activity in brain slice preparations (Wang et al., 2007). Here, we focus on in vivo applications.
RESULTS
Transgenic Expression of ChR2-YFP in Subsets of Neurons in the Mouse CNS
In vitro studies using cultured hippocampal neurons transduced by lentivirus engineered to express ChR2-YFP have demonstrated that mammalian neurons are capable of synthesizing the functional channel and propagating millisecond time scale spike responses and synaptic transmission in response to light (Boyden et al., 2005; Li et al., 2005). To determine whether this strategy could be applied in the intact animal, we generated a transgenic mouse model that expresses ChR2-YFP broadly throughout the nervous system under control of the Thy1 promoter (Figure 1A). Since transgene expression from the Thy1 promoter results in random expression in subsets of neurons in different lines (Caroni, 1997; Feng et al., 2000), several different founders were generated that showed regionally restricted expression of ChR2-YFP in different cells of the mouse nervous system (see Experimental Procedures). From 19 offspring, 10 founder lines were identified as having transgene incorporation into the genome, and 7 of these lines showed expression of ChR2-YFP in the central and/or the peripheral nervous system. In certain lines, expression of ChR2-YFP was detected in hippocampal CA1 and CA3 pyramidal neurons (lines 9, 15, 18, and 19), cerebellar mossy fibers (lines 18, 19), various nuclei of the thalamus, midbrain and brainstem (9, 15, 18, and 19), and retinal ganglion cells (lines 2 and 9). In addition, several lines (lines 9, 15, and 18) exhibited high levels of ChR2-YFP in layer 5 cortical neurons. As will be shown below, layer 5 neurons are accessible for in vivo photoactivation due to the extensive ChR2-YFP expression in apical dendrites at the surface of the brain. For our experiments, we considered one particular line, line 18, which exhibited high levels of ChR2-YFP expression in multiple tissue domains throughout the brain, including neurons of the brainstem, cerebellum, hippocampus, and cortex (Figures 1B–1D). In the olfactory system, line 18 mice expressed membrane-localized ChR2-YFP in most of the mitral cells (96 of 104 mitral cells counted) and in the neuropil of the inner plexiform layer of the olfactory bulb (Figures 1E–1J, and see Figure S1 in the Supplemental Data available with this article online). In the bulb, ChR2-YFP expression was restricted to mitral cells as shown by colocalization with the 5-HT2A receptor (McLean et al., 1995; Hamada et al., 1998; Hardy et al., 2005) and was undetectable in inhibitory granule and periglomerular cells as shown by lack of colocalization with GAD67, Calbindin, or Pax6 (Kohwi et al., 2005; Parrish-Aungst et al., 2007; Figures 1H–1J and S1). Neurons expressing ChR2-YFP exhibited no sign of degeneration or altered morphology and were otherwise indistinguishable from nonexpressing cells.
Figure 1. The Thy1 Promoter Drives Transgenic Expression of ChR2-YFP in Subsets of Neurons in the Central Nervous System.
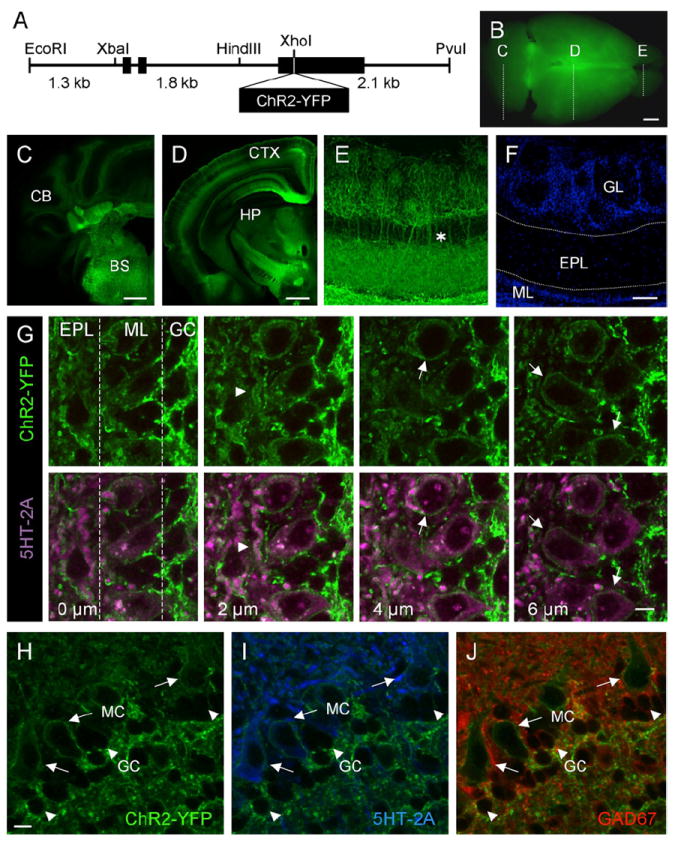
(A) Diagram of the Thy1-ChR2-YFP transgene construct.
(B) Whole-brain image of ChR2-YFP expression in Thy1 transgenic mouse brain, illustrating the coronal planes of section shown in (C)–(E).
(C) Coronal section through the caudal end of the Thy1-ChR2-YFP transgenic mouse brain. CB, cerebellum; BS, brainstem.
(D) Midcoronal section through the Thy1-ChR2-YFP transgenic mouse brain. CTX, cortex; HP, hippocampus.
(E) Immunoenhanced section using an anti-GFP antibody to amplify ChR2-YFP detection in the mitral cells of the olfactory bulb. The asterisk illustrates apical dendrites extending from mitral cell bodies, forming tufts in the glomerular layer.
(F) DAPI stain of the section shown in (E), highlighting the cell layers of the olfactory bulb. GL, glomerular layer; EPL, external plexiform layer; ML, mitral cell layer.
(G) Serial z sections taken at 2 μm intervals through the olfactory bulb of Thy1-ChR2-YFP mice showing the localization of ChR2-YFP at the plasma membrane of mitral cells. Top panels show ChR2-YFP expression in serial z planes of section. Bottom panels show corresponding planes of section with colabeling of mitral cell bodies and lateral dendrites with an antibody directed against the mitral cell-expressed 5-HT2A receptor (purple) and ChR2-YFP (green). The arrowhead points to ChR2-YFP expression on the membrane of a lateral dendrite. Arrows point to ChR2-YFP expression on the membrane of mitral cell bodies. EPL, External plexiform layer; ML, mitral cell layer; GC, granule cell layer.
(H–J) Within the olfactory bulb, ChR2-YFP is selectively expressed in mitral cells.
(H) High-magnification view of ChR2-YFP expression in the mitral cell layer.
(I) Colocalization of membrane-bound ChR2-YFP (green) and 5-HT2A receptor (blue), a marker of mitral cells.
(J) ChR2-YFP is not expressed in GAD67-positive granule cells (red). Note the presence of membrane-localized ChR2-YFP on the mitral cell (long arrows) with no ChR2-YFP present on the smaller GAD67-positive granule cell (arrowheads).
MC, mitral cell; GC, granule cell. Scale bars, 2.5 mm (B); 1 mm (C and D); 50 μm (E and F); 10 μm (G); 10 μm (H–J).
Transgenically Expressed ChR2-YFP Conducts Cell Type-Specific Photocurrents in Acute Brain Slices
To evaluate the properties of photocurrents mediated by transgenic expression of ChR2 in neurons, we performed whole-cell recordings from mitral cells in acute slices of the MOB. Pharmacological blockade of fast synaptic transmission was used to isolate photocurrents in individual cells (10 μM CNQX, 50 μM APV, 10 μM bicuculline). In mitral cells, brief illumination with 488 nm light generated large, rapid, inward currents whose amplitude was graded with light intensity (Figure 2A). Photocurrents exhibited rapid and reproducible kinetics, with an average latency to onset of 5.0 ± 0.4 ms and an average time to peak of 17.2 ± 0.2 ms (mean ± SEM, n = 24). Light-induced currents had an initial transient component that subsequently decayed to steady state, as previously described (steady state current = 0.355 ± 0.093 of peak; tdecay = 28.1 ± 7.3 ms; n = 23) (Nagel et al., 2003; Boyden et al., 2005). At the end of illumination, light-induced currents decayed rapidly (toff = 13.0 ± 1.1 ms; n = 23). Currents reversed at 4.7 ± 7.8 mV (n = 3), consistent with previous findings that ChR2 carries a nonselective cation current (Nagel et al., 2003, 2005b; Ishizuka et al., 2006). Transgenically expressed ChR2 therefore generates rapid and sensitive light-evoked responses in mitral cells in vitro.
Figure 2. Transgenically Expressed ChR2 Produces Rapid, Light-Evoked, Cell Type-Specific Responses in Acute Brain Slices.
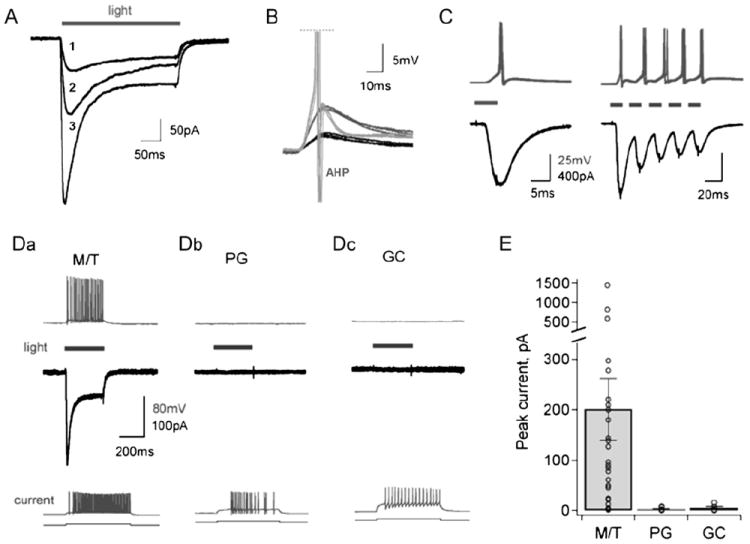
(A) Illumination with 488 nm light generates rapid photocurrents with both transient and sustained components in a voltage-clamped mitral cell from a main olfactory bulb slice. Currents are shown in response to graded illumination intensities of 2 (trace 1), 4 (trace 2), and 20 (trace 3) mW/mm2.
(B) Brief 5 ms illumination produces reproducible EPSP-like events in a mitral cell recorded in current clamp, and these subthreshold responses were graded with light intensity (black and dark gray traces). Higher light intensity produces short latency action potential firing (light gray traces, truncated). The prominent afterhyperpolarization (AHP) observed following the spike is typical of mitral cells. Black traces, low intensity light (2 mW/mm2); dark gray, medium intensity (4 mW/mm2); light gray, high intensity (20 mW/mm2). Three repeated responses to illumination at each intensity are overlaid.
(C) Rapid photocurrent kinetics (black, bottom traces) permit precise and reproducible control of action potential firing (gray, top traces). Left, overlay of six single spikes evoked by 5 ms light pulses. Right, overlay of three spike trains evoked by a train of pulses (5 ms, 40 Hz). Thick gray bars indicate illumination periods.
(D) (a) Mitral/tufted (M/T) cells in the main olfactory bulb consistently show ChR2-mediated photocurrents (black, middle panel) that drive robust neuronal firing (gray, top panel). (b and c) Light-evoked activity is absent from MOB periglomerular (PG) and granule cell (GC) interneurons (top, middle panels), although spiking is still readily driven by current injection (bottom panel).
(E) Peak light-evoked current amplitudes for different neuronal types in the MOB. ChR2 photocurrents are observed only in mitral/tufted (M/T) cells in the MOB. PG, periglomerular cells; GC, granule cells. Bars show mean ± SEM.
To determine whether ChR2 photocurrents were capable of generating action potentials, we recorded light-evoked mitral cell responses in current clamp mode while blocking all fast synaptic transmission. Short light pulses of 5–10 ms produced rapid and repeatable changes in membrane potential that ranged from EPSP-like events to single, short-latency action potentials, depending on illumination intensity (Figure 2B). The rapid kinetics of ChR2-mediated currents permitted highly reproducible spike generation across multiple trials (Figure 2C, left) and allowed neurons to follow trains of light flashes at high frequencies with stimulus-locked inward currents in voltage clamp mode, resulting in precisely timed, highly reliable action potential generation in current clamp mode (Figure 2C, right). Sustained illumination also produced repetitive firing in mitral neurons that was tightly locked to both light onset and offset (Figure 2D, left panel). Resting membrane potentials, spike shape, and evoked firing patterns of mitral cells were consistent with recordings from neurons in wild-type littermates and with previous measurements from these cell types (Balu et al., 2004; Urban and Sakmann, 2002), suggesting that exogenous ChR2 does not alter the intrinsic properties of expressing neurons. Furthermore, recordings from wild-type mice showed no light-evoked currents (data not shown), demonstrating that photocurrents did not result from nonspecific illumination effects. Thus, Thy1-ChR2-YFP transgenic mice provide a means for tightly controlled activation of mitral cells, with no apparent abnormal effects on cellular firing properties.
We then examined photocurrents across various cell types within the olfactory bulb. Most MOB mitral cells elicited photocurrents that were sufficient to generate action potentials (mean peak amplitude = 200.6 ± 61.7 pA; n = 26). The heterogeneity of light-induced current responses in different mitral cells was likely due to the variable expression levels of ChR2-YFP across the sample population. In contrast, ChR2-mediated responses were absent from all periglomerular and granule cells tested (peak current amplitudes of 2.3 ± 0.9 pA and 4.9 ± 2.9 pA; n = 9 periglomerular and 5 granule cells, respectively; mean ± SE; Figures 2D and 2E). The observed lack of photocurrents in MOB GABAergic interneurons was not an artifact of altered neuronal excitability in the transgenic animals, as periglomerular and granule cells readily fired action potentials in response to current injection (Figure 2D, bottom). Transgenic ChR2 expression therefore allows activation of MOB neurons with precise control over cell type, timing, and level of firing.
ChR2-YFP Conducts Photocurrents In Vivo
Although in vitro recordings from acute brain slices establish the precision and fidelity of light-evoked activation, a more desired approach for mapping and manipulating neural circuitry would be neural activation in the intact animal. To test the in vivo applicability of ChR2 transgenic mice, we designed a stimulus system for illuminating exposed brain by presenting light through a high-speed mechanical shutter and wide-area fiber optic (5 mm) while simultaneously monitoring in vivo neuronal firing responses. Gated broadband light from a mercury source was positioned by micromanipulators over the exposed brains of anesthetized mice, and extracellular electrodes were used to monitor spike output in response to illumination (Figure 3A). As a first in vivo test for light-evoked responses, we stimulated and recorded from the cells that make up layer 5 (L5) of the neocortex, targeting the primary motor cortex. We chose this area for initial experiments because of the accessibility of the tissue, the location of apical dendrites at the surface of the brain, the deep position of the cell bodies relative to dendritic arbors, and the high, uniform levels of ChR2-YFP transgene expression in L5 (Figure 1D). Upon exposing the dorsal cortex and isolating a single responsive unit, wide-area light spanning the cortical surface was delivered under various temporal profiles. Using this approach, we obtained strong and reliably time-locked light responses (Figure 3B and Movie S1). Moreover, cortical neurons exhibited high fidelity spiking and extremely fast recovery under several different stimulus patterns (Figures 3B–3D).
Figure 3. In Vivo Photoactivation of Layer 5 Cortical Neurons Expressing ChR2.
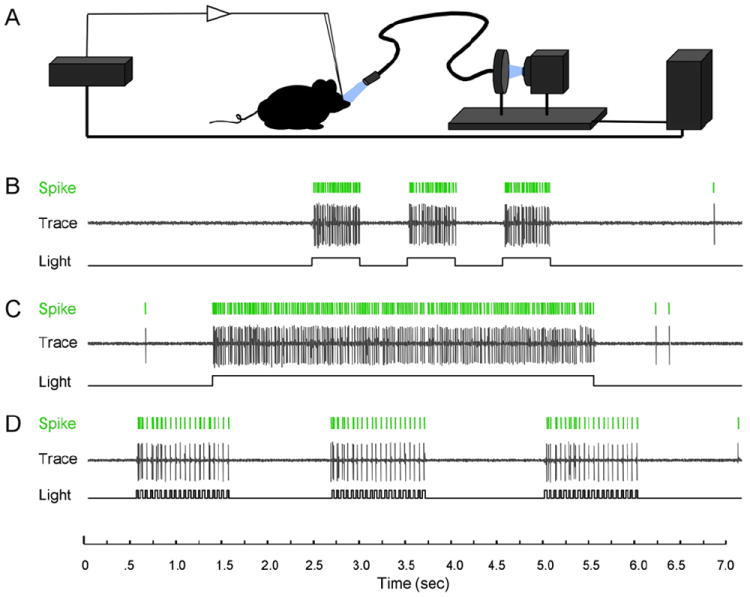
(A) Illustration of the in vivo light delivery and electrophysiological recording system.
(B–D) Example traces recording spike activity of a single unit in response to different light stimulus patterns.
(B) Spike responses to three 500 ms exposures spaced 500 ms apart.
(C) Spike responses to a single 4 s light exposure.
(D) Spike responses to three 20 Hz stimulations. Note the precise temporal correspondence between delivered illumination and recorded spikes.
To quantitatively establish the efficacy of using transgenically expressed ChR2-YFP to control neuronal firing in vivo, shuttered 488 nm illumination was delivered through a 200 μm diameter fiber optic positioned directly above the surface of the brain to allow restricted spatial activation of cortical neurons. All isolated units responded rapidly to brief 3.5 ms light flashes with one or a few spikes (Figure 4A). Responses of individual cells were highly stereotyped and reliable over many repeated trials, with initial spike latencies averaging 9.9 ± 0.64 ms (SEM, n = 11; Figures 4A and 4B), consistent with responses observed in vitro. Neurons followed spike trains with high fidelity at frequencies as high as 40 Hz, showing that ChR2 can be used to generate activity patterns across a wide range of timescales relevant for neuronal circuit function (Figure 4C). Continuous illumination over longer periods generated sustained, high-frequency firing in most neurons. Consistent with the kinetics of whole-cell currents, light exposures over a 500 ms period resulted in continuous rapid action potential firing (64.3 ± 17.4 Hz, n = 4; Figure 4D). Illumination ranging from 100 ms to 1 s caused an initial rapid burst activity but eventually assumed similar firing frequencies and decay rates as seen with 500 ms light stimulation (Figure 4E). Together, these results demonstrate the general utility of ChR2 for manipulating neural activity in vivo. To our knowledge, this model represents the first example of a genetically engineered mouse line for millisecond time scale neuronal stimulation achieved in vivo by simply illuminating cells with visible light.
Figure 4. ChR2 Generates Temporally Precise Light-Evoked Neuronal Activity In Vivo.
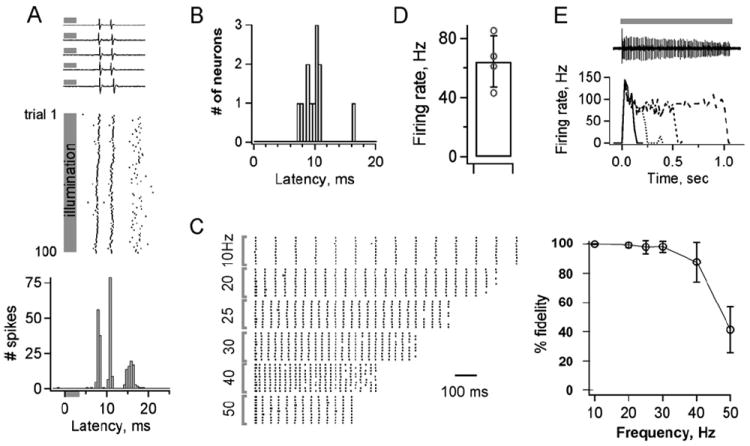
(A) Brief light pulses generate rapid and consistent firing of cortical pyramidal neurons. Top, extracellular spikes from five stimulus presentations. Middle, raster plot of the same neuron’s response to 100 repeated presentations. Bottom, histogram of spike times aligned to light onset shows reliability of timing across trials. Gray bars indicate time of illumination.
(B) Histogram of light-induced response latencies from 11 neurons. The mean time to first spike is 9.9 ± 2.2 ms (±SD).
(C) Individual neurons reliably follow stimulus trains across a wide range of frequencies. Left, raster plots of responses to trains of stimuli repeated at frequencies ranging from 10 to 50 Hz (10 trials each). Right, spike generation is very reliable for stimulation frequencies from 10 to 40 Hz (n = 8; n = 5 at 50 Hz).
(D and E) Continuous illumination generates sustained high-frequency firing over extended time periods.
(D) A 500 ms light presentation evoked a mean firing rate of 64 ± 17 Hz. n = 4 neurons.
(E) Top, spike train from a cell illuminated for 1 s. Bottom, firing rates plotted for different periods of illumination. Lines in the graph represent different durations of illumination. Solid line, 100 ms; dotted line, 200 ms; dashed line, 500 ms; wide-dashed line, 1 s.
Bars in (C) and (D) show ± SEM.
Light-Induced Activation of Mitral Cells in the Intact Olfactory Bulb
We next sought to determine whether light-induced activity could be monitored transsynaptically across a neural circuit in vivo. We focused on the circuit formed between the mitral cells of the olfactory bulb and their projections to the piriform cortex, taking advantage of the defined anatomy of the mouse olfactory system (Buck, 2004; Lledo et al., 2005; Mombaerts, 2006), and the restricted expression of ChR2-YFP in the mitral cells of the bulb (Figures 1 and S1). As a first step in this analysis, we examined the firing properties of individual mitral cells to spatially restricted photostimulation of the bulb. The dorsal surface of the olfactory bulb was exposed, a single unit isolated, and the mitral cell spike responses triggered by illuminating the entire bulb with a 5 mm fiber optic were recorded (Figure 5A). Mitral cell identity was confirmed by stereotaxic positioning of the electrode, coupled baseline firing to respiration, and response to odor stimulation (Figure S2). Under these conditions we observed a strong and rapid light response, with spike events often time locked to respiration (Figures 5B and S2).
Figure 5. Illuminating the Dorsal Surface of the Olfactory Bulb Drives Mitral Cell Spike Activity in ChR2-YFP Mice.
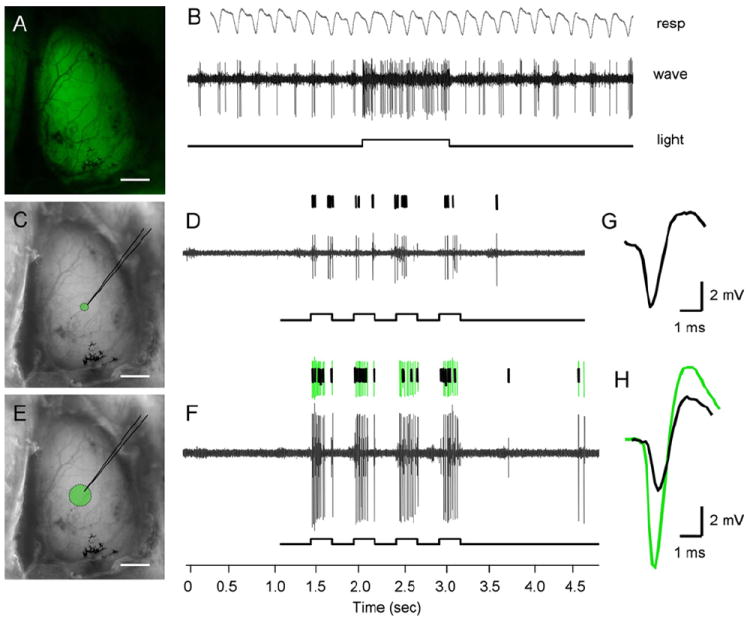
(A) Exposed dorsal olfactory bulb imaged for ChR2-YFP emission under broad illumination.
(B) Example electrophysiological trace from a mitral cell activated by light, highlighting the respiration-coupled spike activity that is significantly increased during illumination.
(C) Image of exposed dorsal olfactory bulb showing the area of light stimulation achieved using a 100 μm diameter fiber optic.
(D) Spike response of a single mitral unit following four 250 ms light pulses.
(E) Image of exposed dorsal olfactory bulb showing the area of light stimulation achieved using a 300 μm diameter fiber optic bundle. Scale bars, 1 mm (A, C, and E).
(F) Spike responses from two distinct units recorded from the same site as in (D). The recruitment of another cell’s activity (green spike trace) does not influence the original cell’s firing properties (black spike trace, seen also in [D]).
(G and H) Traces represent spike shape profiles used for sorting and unit identification. The black waveform represents the first unit initially isolated under narrow light, whereas the overlaid green waveform corresponds to the second unit recruited upon broad light stimulation.
We next evaluated mitral cell responses upon illuminating either small or large areas of the bulb and thereby activating different numbers of glomeruli. Using fiber optic assemblies, light was directed onto the surface of the bulb near the recording electrode with spots of illumination encompassing either a few or many glomeruli. The average size of a single glomerulus in mice is 50 μm in diameter (Allison, 1953; Shepherd, 2004). A narrow area of light stimulation was defined as the region illuminated by a single spot of illumination 100 μm in diameter (Figure 5C), whereas broad area light stimulation was defined as a spot 300 μm in diameter (Figure 5E). The narrow spot of illumination was chosen for the reliable illumination of single (or a few) glomeruli, whereas the broad spot of illumination was predicted to illuminate an area on the bulb encompassing many glomeruli. The average light intensity was constant per unit area under both narrow and broad illumination (100 mW/mm2). Upon increasing the area of stimulation, we often detected the recruitment of additional units (presumably mitral cells from surrounding glomeruli) overlaid upon the initially isolated single unit responses. An example of the activation and isolation of an additional unit by broad light stimulation is shown in Figures 5D, 5F, 5G, and 5H. Despite this area-dependent increase in neural activity, we rarely observed any significant change in the firing rate of the initially isolated unit (Figures 5D and 5F), suggesting little influence of surrounding coactivated glomeruli on single isolated mitral cell responses. These data show that mitral cells, like layer 5 cortical pyramidal neurons, can be photoactivated in vivo using ChR2.
Activation of Neighboring Glomeruli Does Not Influence Light-Induced Firing of Individual Mitral Cells
Whereas several studies indicate that lateral inhibition within and between glomeruli shapes activity in the olfactory bulb (Yokoi et al., 1995; Luo and Katz, 2001; Aungst et al., 2003; Urban, 2002; Tabor et al., 2004), others have not observed significant interactions between activated glomeruli (Belluscio and Katz, 2001; McGann et al., 2005; Lin et al., 2006). To quantify mitral cell responses under narrow and broad illumination (few and many activated glomeruli, respectively), we implemented a stimulation regime that delivered a reproducible series of timed light pulses to the dorsal surface of the bulb, allowing for accurate comparison of responses between narrow and broad light activation. Upon isolation of single mitral units, the overlying dorsal surface of the bulb was illuminated sequentially with 100 μm and 300 μm spots of light, and the electrophysiological responses were recorded from the same cell over multiple trials. Individual trials consisted of recording 4 s of baseline activity, followed by 20 light pulses of 2 s duration, spaced 20 s apart. For each unit, we generated peristimulus time histograms (PSTHs) encompassing all 20 trials. PSTH data were then used for statistical analysis to determine whether different areas of light differentially affected individual mitral cell spike output.
Examples of narrow and broad stimulation PSTHs are shown in Figures 6A and 6B, respectively. We analyzed the overall change in firing rates from a population of 27 cells by plotting the distribution of firing rate differences that were observed upon narrow versus broad light stimulation (Figure 6C). This analysis revealed that the majority of mitral cells (25 of 27 recorded) exhibited no difference in firing rates between trials acquired during narrow versus broad illumination. Comparison of firing activities prior to a stimulus response revealed no baseline increase in spike activity from repeated light exposures in either stimulus group.
Figure 6. Individual Mitral Cell Responses are Unaltered by Increasing the Area of Olfactory Bulb Photostimulation.
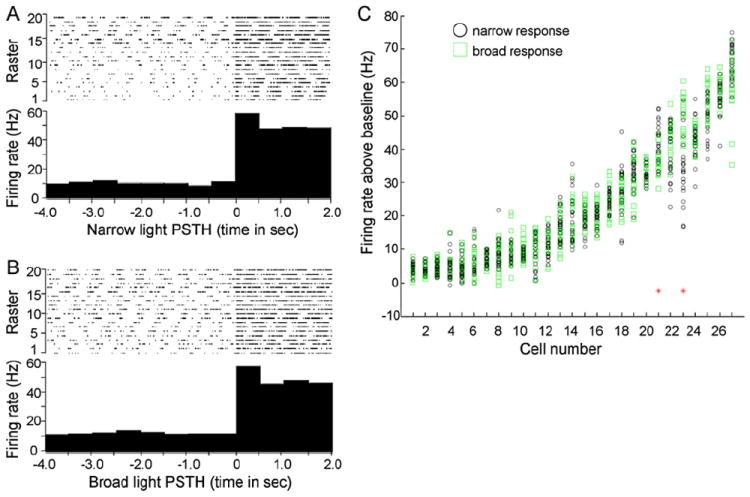
(A and B) Peristimulus time histograms (PSTHs) assembled from multitrial light stimulations of the same cell under narrow 100 μm diameter (A) or broad 300 μm diameter (B) illumination of the dorsal olfactory bulb. Raster sweeps used to generate the PSTHs are shown at the top of each panel.
(C) Distribution plot of cell responses under either narrow or broad light stimulation. Shown are 20 independent trials for both narrow and broad stimulations overlaid for each independent cell analyzed. The two red asterisks denote cells that were found to be significantly different in narrow versus broad illumination responses using the Kolmogorov-Smirnov nonparametric two-sample test constrained to a p value of less than 0.05.
We extended this investigation to determine if other more distant domains of the dorsal bulb, when illuminated, could influence the firing properties of individual mitral cells. Baseline, odor-evoked, and 100 μm diameter light-evoked responses from a widespread sample of single mitral cell units were recorded while systematically scanning the entire surface of the bulb with a 300 μm spot of light. When scanning focal light over the surface of the bulb, we only observed an increase in mitral cell firing rates when the spot of light was positioned directly over the glomerulus from which the mitral cell was being recorded. We observed no change in baseline or odor-evoked firing rates upon focal illumination at positions away from the recording site (n = 39; Figure S3). Moreover, the light-evoked increase in mitral cell firing rate elicited by direct stimulation with a 100 μm diameter spot of light was unaltered by simultaneous illumination at bulb positions away from the recording site with a 300 μm spot of light (Figure S3).
Taken together, these data show that the overall activity of single mitral units remains constant upon a nearly 10-fold change in the surrounding activated bulb surface or upon indirectly stimulating distant domains of the bulb with focal spots of light. Thus, upon switching from narrow to broad surface illumination, single mitral unit activity is not significantly altered by light-induced lateral interactions in the olfactory bulb prior to relay to cortical target cells. In other words, the light-evoked activation of additional neighboring glomeruli beyond a 50 μm radius does not significantly affect mitral cell spike output in our model system.
Multiple Distributed Mitral Inputs Are Required for Cortical Cell Firing
It has been challenging to accurately determine the level of mitral cell convergence onto cells in the piriform cortex, and the number of activated mitral cells required to initiate an action potential in cortical targets remains unclear (Ojima et al., 1984; Haberly, 2001; Zou et al., 2001, 2005; Illig and Haberly, 2003; Franks and Isaacson, 2006; Zou and Buck, 2006). A major hurdle has been the lack of an accurate means for stimulating a defined spatially restricted region of the bulb. Experiments using odor stimuli result in activation of several glomeruli throughout the bulb, making it difficult to determine the cohort of mitral cells that are stimulated by any given odorant molecule (Lin et al., 2006; Mori et al., 2006), whereas field stimulation activates broad populations of cells or projecting axons. The reproducible, controllable, and cell type-selective nature of light responses in ChR2 mice allowed us to overcome some of these challenges. We thus sought to explore higher-order mitral cell convergence and integration by stimulating defined regions of the olfactory bulb with light and recording postsynaptic responses in piriform cortex.
To determine the utility of ChR2 for in vivo transsynaptic circuit analysis and to investigate the nature of mitral cell connectivity to the olfactory cortex, we targeted extracellular recording electrodes to the anterior piriform cortex and monitored action potential responses while presenting light stimuli to the dorsal surface of the bulb. We performed a series of area-dependent, presynaptic stimulations by illuminating the bulb with 100 μm, 300 μm, or 600 μm diameter fiber optics (corresponding to 4, 40, and 140 glomeruli, respectively; Figures 7A–7C). Interestingly, the 600 μm diameter light stimulus consistently and reproducibly drove the firing of cortical cells (49.2 ± 5.5 Hz) to levels nearly 7-fold above baseline (Figures 7D–7F). In contrast, 300 μm and 100 μm light stimuli were much less able to drive cortical cell activity (16.8 ± 1.6 and 8.8 ± 1.0 Hz, respectively; Figures 7D, 7E, 7G, and 7H).
Figure 7. Broad Area Light Stimulation of the Olfactory Bulb Is Required to Drive Activity in the Piriform Cortex.
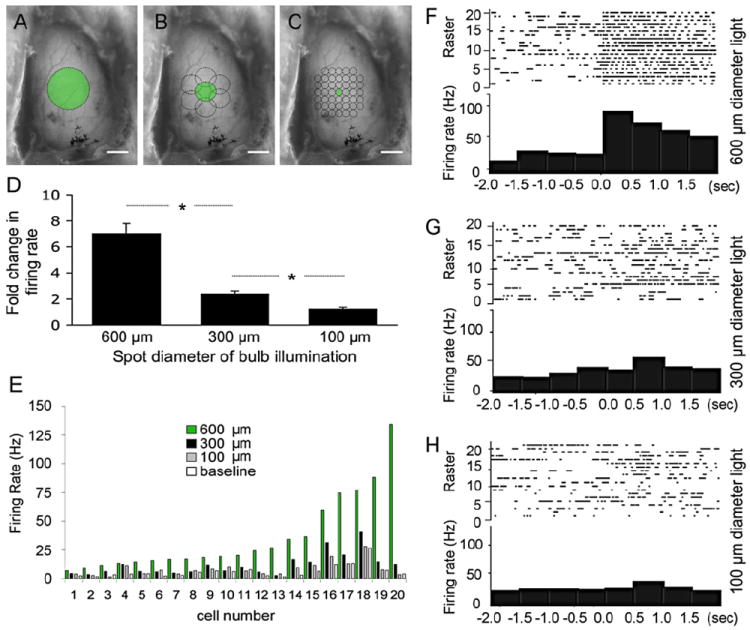
(A–C) Images of exposed dorsal olfactory bulb showing the relative areas of light stimulation using (A) 600 μm, (B) 300 μm, or (C) 100 μm spot sizes for illumination. Scale bars, 1 mm (A, B, and C).
(D) Data represent mean ± SEM of the fold change in piriform cortical cell firing rate above baseline induced by stimulating different areas of the bulb (600 μm diameter spot, 7.01-fold ± 0.78-fold; 300 μm, 2.40-fold ± 0.24-fold; 100 μm 1.26 ± 0.14; n = 20 for each). *p < 0.001, one-tailed t test.
(E) Individual cortical cell responses using 600 μm, 300 μm, or 100 μm diameter fiber optics. Baseline firing rates are indicated.
(F–H) Representative PSTHs (lower panels) and action potential raster plots (top panels) showing responses of piriform cortical neurons to different areas of bulb illumination at time zero using (F) 600 μm, (G) 300 μm, or (H) 100 μm diameter fiber optics.
These experiments were conducted by first isolating a broad-light responsive cell in the cortex, followed by systematically scanning the 300 μm and 100 μm inputs across the same region of the bulb originally illuminated by 600 μm light to try to identify a domain that was responsible for the observed cortical output (illustrated in Figures 7A–7C). Our analysis consisted of assembling PSTHs and comparing overall differences in firing rates upon light stimulations over different bulb areas. Examples of representative PSTHs for 600 μm, 300 μm, and 100 μm diameter light stimuli are shown in Figures 7F–7H. In no case were we able to recapitulate the 600 μm light-driven response by illumination of a smaller region. On the contrary, cortical cell activity increased with increasing area of bulb illumination (Figures 7D and 7E; n = 20). Moreover, we were unable to identify any restricted 100 μm region on the bulb surface whose illumination significantly increased cortical cell activity over baseline. These data support a model in which multiple distant mitral cells or glomerular inputs distributed over several hundred microns are required for action potential generation in cells of the piriform cortex.
DISCUSSION
This study provides the first example of a genetically engineered mouse model for spatial and temporal control of realistic neural activity in vivo through direct neural stimulation with light. We show that genetically encoded ChR2-YFP can control neuronal firing with millisecond precision and can be used for complex circuit analysis. This work complements and extends in vitro studies demonstrating light-evoked mapping of neural microcircuits in brain slices (Zhang and Oertner, 2007; Wang et al., 2007). With the exception of light-induced depolarization, cells expressing ChR2-YFP exhibit morphological and electrophysiological properties indistinguishable from their wild-type counterparts. By defining a restricted population of cells that express the ChR2-YFP transgene, we were able to identify and target distinct cell types for both presynaptic activation and postsynaptic recording. This demonstrates a level of control over neural activity that has been difficult to achieve by other methods. In addition, these experiments illustrate how the rapid response to, and subsequent recovery from, a light stimulus allows for numerous trials that can be carried out repeatedly and consecutively while continually monitoring the activity of an isolated target cell.
Using the bulbar-cortical circuit of the olfactory system as an example, we have illustrated how the precision of light-activated neural mapping may lend itself to solving circuit-level questions. Specifically, we have investigated the issue of odor processing via integration and convergence of excitatory inputs onto the piriform cortex. By photostimulating mitral cells, the principal excitatory neurons of the olfactory bulb, we were able to control the level of excitatory input to the cortex by changing the area of light stimulus exposed to the bulb. We found that activation of a single glomerulus or small numbers of adjacent glomeruli do not provide sufficient input to drive significant cortical cell firing. However, increasing the illuminated area, and thus the number of stimulated glomeruli, produces a graded increase in postsynaptic firing. Therefore, our data support a model where by multiple mitral cells from spatially dispersed glomeruli over several hundred microns of the bulb surface send convergent inputs to piriform cortex neurons.
Although our results are generally supportive of existing models describing a circuit by which multiple mitral cells act as an integrative input for action potential initiation and propagation in the piriform cortex, we acknowledge the limitations of this study in conclusively addressing this issue. First, the expression of ChR2-YFP is restricted to mitral cells and is absent from other neurons in the olfactory bulb (such as the inhibitory periglomerular and granule cells) that likely contribute to cortical integration. In addition, our model exhibits variable levels of ChR2-YFP expression in different neurons, making it difficult to obtain uniform light responses from all cells of a given subtype. This is likely due to the transgenic regulation fromthe Thy1 promoter and the resulting influences of position effect variegation. More controlled and predictable patterns of expression might be obtained using either BAC transgenics or gene targeting. Secondly, our method of light stimulation, utilizing small bundle assemblies mounted on individual micromanipulators, limits the spatial and combinational patterns of light delivery that would be afforded through larger assemblies in which output from individual optical fibers could be independently controlled through a computer interface or through rapidly steered spots of light (Shoham et al., 2005). Presenting combinatorial patterns of light to the bulb while recording in the cortex will likely reveal a more detailed picture of how cortical cells integrate and process mitral cell inputs.
The restricted light presentation used in current experiments may also contribute to our inability to detect any form of interglomerular inhibition, raising the possibility that multiple different regions or intricate spatiotemporal combinations of illumination may be required to drive network-induced lateral inhibition between separate mitral cells or their corresponding glomeruli. Moreover, detailed analysis of cortical responses awaits the incorporation of in vivo intracellular recordings, allowing for the identification of individual synaptic and subthreshold events elicited upon spatially restricted stimulation of the bulb. Nonetheless, our results clearly illustrate the practical applications for using the ChR2 channel for revealing diverse and elusive aspects of sensory processing and circuitry analysis in the olfactory system.
More broadly, this study demonstrates the power of using a genetically engineered mouse model for direct light-gated neural stimulation, facilitating in vivo mapping of neural circuits with extreme spatial and temporal precision. The temporal and genetic control afforded by ChR2 provides a powerful and simple means for delineating direct neural connections and potentially allows for elucidation of more complex patterns of neuronal connectivity extending beyond simple monosynaptic circuit mapping. By taking advantage of the rapid light-induced kinetics of ChR2, one can envision investigation of polysynaptic or relay circuits with high precision heretofore impossible. This technology will enable manipulation of a diverse range of neural outputs, from synaptic plasticity to behavior. Further, the use of other mouse lines with ChR2 restricted to specific cell subpopulations or targeted for neuron subtype-specific, promoter-driven expression will allow functional studies on many other circuits. For example, in the Thy1 mouse line described here, the high levels of ChR2-YFP expression in layer 5 pyramidal cells of neocortex present an ideal target population for investigating activity-dependent or developmental cortical plasticity or for behavior-linked circuit mapping (De Paola et al., 2006; Holtmaat et al., 2006). Further, the high expression of ChR2-YFP throughout expressing neurons provides the potential to locally photostimulate over micron dimensions for refined mapping of local microcircuits (Wang et al., 2007). In future studies, conditional expression of ChR2 in chosen defined cell populations using a genetic switch such as the Cre-LoxP system may afford cell type-specific, customized, light-dependent control of neuronal activity.
Although powerful, several technical limitations still constrain the current application of ChR2-YFP mouse models toward properly addressing many aspects of neural circuitry. For example, the requirement for delivery of blue light limits the ability to penetrate deeply into living tissues, inaccessible regions of the nervous system, or deep brain structures (Flusberg et al., 2005a, 2005b). In addition, we lack detailed knowledge regarding the levels of ChR2 expression and illumination regimes required to elicit various firing patterns or subthreshold responses in different cell types. Such detailed biophysical parameters await further empirical investigation. An additional limitation, which can be either advantageous or disadvantageous depending on the experimental system, is the fact that ChR2 acts in a dominant excitatory manner, thereby restricting investigation primarily to directly light-evoked (and potentially overriding) responses and only indirectly to downstream inhibitory effects. However, the use of ChR2 methodology alongside, or in conjunction with, two-photon laser scanning microscopy for light activation, in vivo fiber optics (Flusberg et al., 2005a; Piyawattanametha et al., 2006), other heterologous stimulation methods based on receptor-ligand binding (Lima and Miesenbock, 2005; Miesenbock, 2004; Zemelman et al., 2003), or chemical disruption of synaptic transmission (Karpova et al., 2005) promises to yield more detailed insight into the overall connectivity and function of the nervous system.
EXPERIMENTAL PROCEDURES
Generation of Transgenic ChR2-YFP Mouse Lines
The cDNA encoding the ChR2-YFP fusion protein from pBK-CMV-ChR2-EYFP (Boyden et al., 2005) was cloned into the XhoI site of the mouse Thy1 vector as described previously (Feng et al., 2000). Transgenic mice were generated using standard pronuclear injection techniques (Feng et al., 2004). From 19 offspring, 10 founder lines were identified as having transgene incorporation into the genome, and 7 of these lines showed expression of ChR2-YFP in the brain. One line, line 18, was used for this study and showed high levels of restricted ChR2-YFP expression in the brainstem, cerebellum, hippocampus, cortex, and mitral cells of the olfactory bulb. Other lines showed restricted expression in the dorsal root ganglion, retina, motor neurons, thalamic nuclei, midbrain, and lower brainstem. All lines were viable, with no changes in survival or gross brain structure.
Confocal Imaging and Immunohistochemistry
ChR2-YFP animals were sacrificed, perfused with 4% paraformaldehyde in phosphate buffered saline, and postfixed for 1 hr at 4 C. Brain tissue was then embedded in O.C.T. and either sectioned to 10 μm on an upright Leica cryostat or cut to 30 μm slices on a cooled stage microtome. Sliced tissues were mounted on slides and imaged using a Zeiss 510 scanning confocal microscope (Carl Zeiss Inc.) with 488 nm excitation. For immunohistochemistry, sections were incubated with blocking solution (10% normal goat serum, 2% BSA, 0.1% Triton X-100 in PBS [pH 7.4]) and incubated at 4 C for 2 hr. Rabbit polyclonal anti-GFP, 1:1000 (Molecular Probes Inc.), rabbit polyclonal anti-5HT-2A, 1:500 (Abcam), mouse monoclonal anti-Pax6, 1:1000 (Developmental Studies Hybridoma Bank, University of Iowa), mouse monoclonal anti-Calbindin, 1:1000 (Abcam), or mouse monoclonal anti-GAD67, 1:1000 (Chemicon) antibodies were diluted in blocking solution and applied overnight at 4 C. The next day, sections were washed three times, 15 min each, in PBS, 0.1% Triton, followed by two times 15 min in blocking solution. Secondary Alexa 488 goat, anti-rabbit IgG, Alexa 647 goat anti-rabbit, or Alexa 555 goat anti-mouse antibodies (Molecular Probes Inc.) were then added to a final dilution of 1:500 and incubated for 4 hr at 4 C. Slices were then washed four times, 15 min each, and mounted with DAPI-containing Vectashield mounting medium (Vector Laboratories). Immunoreacted slides were imaged the same as unprocessed tissues.
Slice Electrophysiology
Whole brains from three-week-old mice were dissected into ice cold ACSF. Slices (350 μm) were cut in ice-cold ASCF containing sucrose (87 mM NaCl, 2.5 mM KCl, 1.25 mM NaH2PO4, 25 mM NaHCO3, 75 mM sucrose, 10 mM glucose, 1.3 mM ascorbic acid, 0.5 mM CaCl2, 7 mM MgCl2) and incubated at 30 C for 15 min in CO2 buffered ACSF (124 mM NaCl, 3 mM KCl, 1.25 mM NaH2PO4, 26 mM NaHCO3, 20 mM glucose, 2 mM CaCl2, 1 mM MgCl2) followed by RT incubation for visually guided patch recordings. Patch pipettes were pulled on a Model P-97 micropipette puller (Sutter Instruments Inc.) to a tip resistance of 3.5–7 MΩ. The internal electrode solution contained 130 mM K gluconate, 10 mM HEPES (pH 7.4), 2 mM MgCl2, 2 mM MgATP, 0.5 mM NaGTP, 1 mM EGTA, 10 mM phosophocreatine.
In Vivo Light Stimulation and Electrophysiology
In vivo recordings were performed on animals anesthetized with injected ketamine and xylazine (150 μg ketamine and 6 μg xylazine per gram of body weight via i.p. injection), followed by sustained 0.5% isofluorane. All procedures were performed in accordance with guidelines and standards of the Duke University Institutional Animal Care and Use Committee. The dorsal surface of the brain was exposed to light stimuli by small-window craniotomy. A 100W mercury light source (Carl Zeiss Inc.) was gated using a UniBlitz mechanical shutter (Vincent Associates) and guided to the exposed surface of the brain by focusing light onto fused silica fiber optics (Polymicro Technologies Inc.). The average light intensity was measured to be approximately 100 mW/mm2 using a model 407A light detector (SpectraPhysics Lasers Inc.). Electrophysiological recordings were made using 1 MΩ extracellular recording electrodes (Microprobe Inc.) and band pass filtered at 300 Hz low/5 kHz high using a model 1800 AC differential amplifier (A-M Systems), or a MiniMatrix system (Thomas Recording). Postrecording lesions were used to confirm electrode targeting to the correct tissue domain. Data were collected and processed using Spike2 acquisition software (Cambridge Electronic Design). Odor stimulation was conducted by presenting forced air with volatilized, high-concentration isoamyl acetate (Sigma-Aldrich). In vivo light stimulus trials used for the generation of PSTHs were carried out by first recording 4 s of baseline activity, followed by repeating 20 light pulses of 2 s duration, each spaced 20 s apart. PSTHs were assembled for each unit recorded by compiling both baseline and poststimulus data from all 20 trials.
Data Analysis
PSTHs were generated using the data acquisition program Spike-2 (Cambridge Electronic Design). Response plots and statistical analysis comparing the differences in light-induced firing rates of individual mitral cells were done in MATLAB (The Mathworks Inc.). Statistical comparisons of broad versus narrow stimulus responses for individual cells were done with the Kolmogorov-Smirnov nonparametric two-sample test. A level of 0.05 was employed to designate a difference as significant.
Supplementary Material
supp matl
supp movie
Acknowledgments
We thank Marguerita Klein and Dongqing Wang for excellent technical assistance. We thank Jimmy Gross, Jun Liu, and Bernd Gloss of the Duke Neurotransgenic Facility for production of transgenic mice. We thank Yoram Ben-Shaul, Thomas Helton, Juliet Hernandez, Richard Mooney, Steve Shea, Fan Wang, and Jason Yi for critical review of the manuscript. This work was supported by grants from the NIH (to M.D.E., G.J.A., and G.F.), the Beckman Young Investigator Award from the Arnold and Mabel Beckman Foundation (to G.F.), and Fellowships from the Science and Technology Foundation of Portugal (to C.F. and J.P.). M.D.E. is an Investigator of the Howard Hughes Medical Institute. This paper was inspired by the memory and creativity of Lawrence Katz.
Footnotes
References
- Allison AC. The morphology of the olfactory system in vertebrates. Biol Rev. 1953;28:195–244. [Google Scholar]
- Aungst JL, Heyward PM, Puche AC, Karnup SV, Hayar A, Szabo G, Shipley MT. Centre-surround inhibition among olfactory bulb glomeruli. Nature. 2003;426:623–629. doi: 10.1038/nature02185. [DOI] [PubMed] [Google Scholar]
- Balu R, Larimer P, Strowbridge BW. Phasic stimuli evoke precisely timed spikes in intermittently discharging mitral cells. J Neurophysiol. 2004;92:743–753. doi: 10.1152/jn.00016.2004. [DOI] [PubMed] [Google Scholar]
- Belluscio L, Katz LC. Symmetry, stereotypy, and topography of odorant representations in mouse olfactory bulbs. J Neurosci. 2001;21:2113–2122. doi: 10.1523/JNEUROSCI.21-06-02113.2001. [DOI] [PMC free article] [PubMed] [Google Scholar]
- Bi A, Cui J, Ma Y, Olshevskaya E, Pu M, Dizhoor A, Pan Z. Ectopic expression of a microbial-type rhodopsin restores visual responses in mice with photoreceptor degeneration. Neuron. 2006;50:23–33. doi: 10.1016/j.neuron.2006.02.026. [DOI] [PMC free article] [PubMed] [Google Scholar]
- Boyden ES, Zhang F, Bamberg E, Nagel G, Deisseroth K. Millisecond-timescale, genetically targeted optical control of neural activity. Nat Neurosci. 2005;8:1263–1268. doi: 10.1038/nn1525. [DOI] [PubMed] [Google Scholar]
- Buck LB. Olfactory receptors and odor coding in mammals. Nutr Rev. 2004;62:S184–S188. doi: 10.1111/j.1753-4887.2004.tb00097.x. [DOI] [PubMed] [Google Scholar]
- Buonviso N, Revial MF, Jourdan F. The projections of mitral cells from small local regions of the olfactory bulb: an anterograde tracing study using PHA-L (Phaseolus vulgaris leucoagglutinin) Eur J Neurosci. 1991;3:493–500. doi: 10.1111/j.1460-9568.1991.tb00836.x. [DOI] [PubMed] [Google Scholar]
- Caroni P. Overexpression of growth-associated proteins in the neurons of adult transgenic mice. J Neurosci Methods. 1997;71:3–9. doi: 10.1016/s0165-0270(96)00121-5. [DOI] [PubMed] [Google Scholar]
- Chen BE, Lendvai B, Nimchinsky EA, Burbach B, Fox K, Svoboda K. Imaging high-resolution structure of GFP-expressing neurons in neocortex in vivo. Learn Mem. 2000;7:433–441. doi: 10.1101/lm.32700. [DOI] [PubMed] [Google Scholar]
- De Paola V, Holtmaat A, Knott G, Song S, Wilbrecht L, Caroni P, Svoboda K. Cell type-specific structural plasticity of axonal branches and boutons in the adult neocortex. Neuron. 2006;49:861–875. doi: 10.1016/j.neuron.2006.02.017. [DOI] [PubMed] [Google Scholar]
- Feng G, Mellor RH, Bernstein M, Keller-Peck C, Nguyen QT, Wallace M, Nerbonne JM, Lichtman JW, Sanes JR. Imaging neuronal subsets in transgenic mice expressing multiple spectral variants of GFP. Neuron. 2000;28:41–51. doi: 10.1016/s0896-6273(00)00084-2. [DOI] [PubMed] [Google Scholar]
- Feng G, Lu J, Gross J. Generation of transgenic mice. Methods Mol Med. 2004;9:255–267. doi: 10.1385/1-59259-770-X:255. [DOI] [PubMed] [Google Scholar]
- Flusberg BA, Cocker ED, Piyawattanametha W, Jung JC, Cheung EL, Schnitzer MJ. Fiber-optic fluorescence imaging. Nat Methods. 2005a;2:941–950. doi: 10.1038/nmeth820. [DOI] [PMC free article] [PubMed] [Google Scholar]
- Flusberg BA, Jung JC, Cocker ED, Anderson EP, Schnitzer MJ. In vivo brain imaging using a portable 3.9 gram two-photon fluorescence microendoscope. Opt Lett. 2005b;30:2272–2274. doi: 10.1364/ol.30.002272. [DOI] [PubMed] [Google Scholar]
- Franks KM, Isaacson JS. Strong single-fiber sensory inputs to olfactory cortex: implications for olfactory coding. Neuron. 2006;49:357–363. doi: 10.1016/j.neuron.2005.12.026. [DOI] [PubMed] [Google Scholar]
- Gan WB, Grutzendler J, Wong WT, Wong RO, Lichtman JW. Multicolor “DiOlistic” labeling of the nervous system using lipophilic dye combinations. Neuron. 2000;27:219–225. doi: 10.1016/s0896-6273(00)00031-3. [DOI] [PubMed] [Google Scholar]
- Haberly LB. Parallel-distributed processing in olfactory cortex: new insights from morphological and physiological analysis of neuronal circuitry. Chem Senses. 2001;26:551–576. doi: 10.1093/chemse/26.5.551. [DOI] [PubMed] [Google Scholar]
- Hamada S, Senzaki K, Hamaguchi-Hamada K, Tabuchi K, Yamamoto H, Yamamoto T, Yoshikawa S, Okano H, Okado N. Localization of 5-HT2A receptor in rat cerebral cortex and olfactory system revealed by immunohistochemistry using two antibodies raised in rabbit and chicken. Brain Res Mol Brain Res. 1998;54:199–211. doi: 10.1016/s0169-328x(97)00322-7. [DOI] [PubMed] [Google Scholar]
- Hardy A, Palouzier-Paulignan B, Duchamp A, Royet JP, Duchamp-Viret P. 5-Hydroxytryptamine action in the rat olfactory bulb: in vitro electrophysiological patch-clamp recordings of juxtaglomerular and mitral cells. Neuroscience. 2005;131:717–731. doi: 10.1016/j.neuroscience.2004.10.034. [DOI] [PubMed] [Google Scholar]
- Holtmaat A, Wilbrecht L, Knott GW, Welker E, Svoboda K. Experience-dependent and cell-type-specific spine growth in the neocortex. Nature. 2006;441:979–983. doi: 10.1038/nature04783. [DOI] [PubMed] [Google Scholar]
- Illig KR, Haberly LB. Odor-evoked activity is spatially distributed in piriform cortex. J Comp Neurol. 2003;457:361–373. doi: 10.1002/cne.10557. [DOI] [PubMed] [Google Scholar]
- Ishizuka T, Kakuda M, Araki R, Yawo H. Kinetic evaluation of photosensitivity in genetically engineered neurons expressing green algae light-gated channels. Neurosci Res. 2006;54:85–94. doi: 10.1016/j.neures.2005.10.009. [DOI] [PubMed] [Google Scholar]
- Johnson DM, Illig KR, Behan M, Haberly LB. New features of connectivity in piriform cortex visualized by intracellular injection of pyramidal cells suggest that “primary” olfactory cortex functions like “association” cortex in other sensory systems. J Neurosci. 2000;20:6974–6982. doi: 10.1523/JNEUROSCI.20-18-06974.2000. [DOI] [PMC free article] [PubMed] [Google Scholar]
- Kandel ER, Schwartz JH, Jessell TM. Principles of Neuroscience. Fourth Edition. Columbus, OH: The McGraw-Hill Companies; 2000. [Google Scholar]
- Karpova AY, Tervo DG, Gray NW, Svoboda K. Rapid and reversible inactivation of synaptic transmission in genetically targeted neurons. Neuron. 2005;48:727–735. doi: 10.1016/j.neuron.2005.11.015. [DOI] [PubMed] [Google Scholar]
- Kobbert C, Apps R, Bechmann I, Lanciego JL, Mey J, Thanos S. Current concepts in neuroanatomical tracing. Prog Neurobiol. 2000;62:327–351. doi: 10.1016/s0301-0082(00)00019-8. [DOI] [PubMed] [Google Scholar]
- Kohwi M, Osumi N, Rubenstein JL, Alvarez-Buylla A. Pax6 is required for making specific subpopulations of granule and periglomerular neurons in the olfactory bulb. J Neurosci. 2005;25:6997–7003. doi: 10.1523/JNEUROSCI.1435-05.2005. [DOI] [PMC free article] [PubMed] [Google Scholar]
- Lei H, Mooney R, Katz LC. Synaptic integration of olfactory information in mouse anterior olfactory nucleus. J Neurosci. 2006;26:12023–12032. doi: 10.1523/JNEUROSCI.2598-06.2006. [DOI] [PMC free article] [PubMed] [Google Scholar]
- Li X, Gutierrez M, Hansen G, Han J, Melanie MD, Chiel H, Hegemann P, Landmesser L, Herlitze S. Fast noninvasive activation and inhibition of neural and network activity by vertebrate rhodopsin and green algae channelrhodopsin. Proc Natl Acad Sci USA. 2005;102:17816–17821. doi: 10.1073/pnas.0509030102. [DOI] [PMC free article] [PubMed] [Google Scholar]
- Liedtke W, Tobin DM, Bargmann CI, Friedman JM. Mammalian TRPV4 (VR-OAC) directs behavioral responses to osmotic and mechanical stimuli in Caenorhabditis elegans. Proc Natl Acad Sci USA. 2003;100(Suppl 2):14531–14536. doi: 10.1073/pnas.2235619100. [DOI] [PMC free article] [PubMed] [Google Scholar]
- Lima SQ, Miesenbock G. Remote control of behavior through genetically targeted photostimulation of neurons. Cell. 2005;121:141–152. doi: 10.1016/j.cell.2005.02.004. [DOI] [PubMed] [Google Scholar]
- Lin DY, Shea SD, Katz LC. Representation of natural stimuli in the rodent main olfactory bulb. Neuron. 2006;50:937–949. doi: 10.1016/j.neuron.2006.03.021. [DOI] [PubMed] [Google Scholar]
- Lledo PM, Gheusi G, Vincent JD. Information processing in the mammalian olfactory system. Physiol Rev. 2005;85:281–317. doi: 10.1152/physrev.00008.2004. [DOI] [PubMed] [Google Scholar]
- Luo M, Katz LC. Response correlation maps of neurons in the mammalian olfactory bulb. Neuron. 2001;32:1165–1179. doi: 10.1016/s0896-6273(01)00537-2. [DOI] [PubMed] [Google Scholar]
- Maskos U, Kissa K, St Cloment C, Brulet P. Retrograde trans-synaptic transfer of green fluorescent protein allows the genetic mapping of neuronal circuits in transgenic mice. Proc Natl Acad Sci USA. 2002;99:10120–10125. doi: 10.1073/pnas.152266799. [DOI] [PMC free article] [PubMed] [Google Scholar]
- McGann JP, Pirez N, Gainey MA, Muratore C, Elias AS, Wachowiak M. Odorant representations are modulated by intra- but not interglomerular presynaptic inhibition of olfactory sensory neurons. Neuron. 2005;48:1039–1053. doi: 10.1016/j.neuron.2005.10.031. [DOI] [PubMed] [Google Scholar]
- McLean JH, Darby-King A, Paterno GD. Localization of 5-HT2A receptor mRNA by in situ hybridization in the olfactory bulb of the postnatal rat. J Comp Neurol. 1995;353:371–378. doi: 10.1002/cne.903530305. [DOI] [PubMed] [Google Scholar]
- Miesenbock G. Genetic methods for illuminating the function of neural circuits. Curr Opin Neurobiol. 2004;14:395–402. doi: 10.1016/j.conb.2004.05.004. [DOI] [PubMed] [Google Scholar]
- Mombaerts P. Seven-transmembrane proteins as odorant and chemosensory receptors. Science. 1999;286:707–711. doi: 10.1126/science.286.5440.707. [DOI] [PubMed] [Google Scholar]
- Mombaerts P. Axonal wiring in the mouse olfactory system. Annu Rev Cell Dev Biol. 2006;22:713–737. doi: 10.1146/annurev.cellbio.21.012804.093915. [DOI] [PubMed] [Google Scholar]
- Mombaerts P, Wang F, Dulac C, Chao SK, Nemes A, Mendelsohn M, Edmondson J, Axel R. Visualizing an olfactory sensory map. Cell. 1996;87:675–686. doi: 10.1016/s0092-8674(00)81387-2. [DOI] [PubMed] [Google Scholar]
- Mori K, Takahashi YK, Igarashi KM, Yamaguchi M. Maps of odorant molecular features in the Mammalian olfactory bulb. Physiol Rev. 2006;86:409–433. doi: 10.1152/physrev.00021.2005. [DOI] [PubMed] [Google Scholar]
- Nagel G, Szellas T, Huhn W, Kateriya S, Adeishvili N, Berthold P, Ollig D, Hegemann P, Bamberg E. Channelrhodopsin-2 a directly light-gated cation-selective membrane channel. Proc Natl Acad Sci USA. 2003;100:13940–13945. doi: 10.1073/pnas.1936192100. [DOI] [PMC free article] [PubMed] [Google Scholar]
- Nagel G, Brauner M, Liewald JF, Adeishvili N, Bamberg E, Gottschalk A. Light activation of channelrhodopsin-2 in excitable cells of Caenorhabditis elegans triggers rapid behavioral responses. Curr Biol. 2005a;15:2279–2284. doi: 10.1016/j.cub.2005.11.032. [DOI] [PubMed] [Google Scholar]
- Nagel G, Szellas T, Kateriya S, Adeishvili N, Hegemann P, Bamberg E. Channelrhodopsins: directly light-gated cation channels. Biochem Soc Trans. 2005b;33:863–866. doi: 10.1042/BST0330863. [DOI] [PubMed] [Google Scholar]
- Ojima H, Mori K, Kishi K. The trajectory of mitral cell axons in the rabbit olfactory cortex revealed by intracellular HRP injection. J Comp Neurol. 1984;230:77–87. doi: 10.1002/cne.902300107. [DOI] [PubMed] [Google Scholar]
- Parrish-Aungst S, Shipley MT, Erdelyi G, Szabo G, Puche AC. Quantitative analysis of neuronal diversity in the mouse olfactory bulb. J Comp Neurol. 2007;501:825–836. doi: 10.1002/cne.21205. [DOI] [PubMed] [Google Scholar]
- Piyawattanametha W, Barretto RP, Ko TH, Flusberg BA, Cocker ED, Ra H, Lee D, Solgaard O, Schnitzer MJ. Fast-scanning two-photon fluorescence imaging based on a microelectromechanical systems two- dimensional scanning mirror. Opt Lett. 2006;31:2018–2020. doi: 10.1364/ol.31.002018. [DOI] [PMC free article] [PubMed] [Google Scholar]
- Shepherd GM. Synaptic Organization of the Brain. Fifth Edition. New York: Oxford University Press; 2004. [Google Scholar]
- Shepherd GM, Chen WR, Greer CA. The Olfactory Bulb. In: Shepherd GM, editor. Synaptic Organization of the Brain. New York: Oxford University Press; 2004. pp. 165–216. [Google Scholar]
- Shoham S, O’Connor DH, Sarkisov DV, Wang SS. Rapid neurotransmitter uncaging in spatially defined patterns. Nat Methods. 2005;2:837–843. doi: 10.1038/nmeth793. [DOI] [PubMed] [Google Scholar]
- Song CK, Enquist LW, Bartness TJ. New developments in tracing neural circuits with herpesviruses. Virus Res. 2005;111:235–249. doi: 10.1016/j.virusres.2005.04.012. [DOI] [PubMed] [Google Scholar]
- Tabor R, Yaksi E, Weislogel JM, Friedrich RW. Processing of odor mixtures in the zebrafish olfactory bulb. J Neurosci. 2004;24:6611–6620. doi: 10.1523/JNEUROSCI.1834-04.2004. [DOI] [PMC free article] [PubMed] [Google Scholar]
- Urban NN. Lateral inhibition in the olfactory bulb and in olfaction. Physiol Behav. 2002;77:607–612. doi: 10.1016/s0031-9384(02)00895-8. [DOI] [PubMed] [Google Scholar]
- Urban NN, Sakmann B. Reciprocal intraglomerular excitation and intra- and interglomerular lateral inhibition between mouse olfactory bulb mitral cells. J Physiol. 2002;542:355–367. doi: 10.1113/jphysiol.2001.013491. [DOI] [PMC free article] [PubMed] [Google Scholar]
- Wang H, Peca J, Matsusaki M, Matsusaki K, Noguchi J, Qui L, Wang D, Zhang F, Boyden E, Deisseroth K, et al. Highspeed mapping of synaptic connectivity using photostimulation in channelrhodopsin-2 transgenic mice. Proc Natl Acad Sci USA. 2007 doi: 10.1073/pnas.0700384104. in press. [DOI] [PMC free article] [PubMed] [Google Scholar]
- Yokoi M, Mori K, Nakanishi S. Refinement of odor molecule tuning by dendrodendritic synaptic inhibition in the olfactory bulb. Proc Natl Acad Sci USA. 1995;92:3371–3375. doi: 10.1073/pnas.92.8.3371. [DOI] [PMC free article] [PubMed] [Google Scholar]
- Zemelman BV, Lee GA, Ng M, Miesenbock G. Selective photostimulation of genetically ChARGed neurons. Neuron. 2002;33:15–22. doi: 10.1016/s0896-6273(01)00574-8. [DOI] [PubMed] [Google Scholar]
- Zemelman BV, Nesnas N, Lee GA, Miesenbock G. Photochemical gating of heterologous ion channels: remote control over genetically designated populations of neurons. Proc Natl Acad Sci USA. 2003;100:1352–1357. doi: 10.1073/pnas.242738899. [DOI] [PMC free article] [PubMed] [Google Scholar]
- Zhang Y, Oertner TG. Optical induction of synaptic plasticity using a light-sensitive channel. Nat Methods. 2007;2:139–141. doi: 10.1038/nmeth988. [DOI] [PubMed] [Google Scholar]
- Zou Z, Buck LB. Combinatorial effects of odorant mixes in olfactory cortex. Science. 2006;311:1477–1481. doi: 10.1126/science.1124755. [DOI] [PubMed] [Google Scholar]
- Zou Z, Horowitz LF, Montmayeur JP, Snapper S, Buck LB. Genetic tracing reveals a stereotyped sensorymap in the olfactory cortex. Nature. 2001;414:173–179. doi: 10.1038/35102506. [DOI] [PubMed] [Google Scholar]
- Zou Z, Li F, Buck LB. Odormaps in the olfactory cortex. Proc Natl Acad Sci USA. 2005;102:7724–7729. doi: 10.1073/pnas.0503027102. [DOI] [PMC free article] [PubMed] [Google Scholar] [Retracted]
Associated Data
This section collects any data citations, data availability statements, or supplementary materials included in this article.
Supplementary Materials
supp matl
supp movie