NGEP, a gene encoding a membrane protein detected only in prostate cancer and normal prostate (original) (raw)
Abstract
We identified a gene (NGEP) that is expressed only in prostate cancer and normal prostate. The two NGEP transcripts are 0.9 kb and 3.5 kb in size and are generated by a differential splicing event. The short variant (NGEP-S) is derived from four exons and encodes a 20-kDa intracellular protein. The long form (NGEP-L) is derived from 18 exons and encodes a 95-kDa protein that is predicted to contain seven-membrane-spanning regions. In situ hybridization shows that NGEP mRNA is localized in epithelial cells of normal prostate and prostate cancers. Immunocytochemical analysis of cells transfected with NGEP cDNAs containing a Myc epitope tag at the carboxyl terminus shows that the protein encoded by the short transcript is localized in the cytoplasm, whereas the protein encoded by the long transcript is present on the plasma membrane. Because of its selective expression in prostate cancer and its presence on the cell surface, NGEP-L is a promising target for the antibody-based therapies of prostate cancer.
Identification of genes specifically expressed in prostate cancer is a key step toward the development of effective therapies for this disease. Even after significant advances in the medical sciences, prostate cancer is one of the leading causes of cancer death among males in the United States (1). For prostate cancers that have spread from their original site, there is no curative treatment available. In addition, very little is known about the causes of this disease largely because of the cellular heterogeneity of the prostate and the lack of systematic analysis of the genes that are specifically expressed in the prostate. Many laboratories are interested in developing an immuno-based targeted therapy for the treatment of cancer and other diseases. For this therapy to be effective, it is essential that the antigen is expressed in the target cells and not expressed in essential normal tissues like brain, liver, heart, kidney, and pancreas. Many different approaches are being used to identify tissue or cancer-specific genes (2-5), and several genes encoding membrane proteins have been identified that are expressed in prostate cancers (6-10). These include PMSA (7), which is also expressed in nervous tissue, and PSCA (6), which is also expressed in stomach, kidney, and bladder.
Our laboratory has developed a computer-based strategy to generate clusters of ESTs that are expressed in prostate cancer but not in essential tissues (11, 12). Several genes with specific or differential expression in prostate have been identified by this approach but none are membrane proteins (13-18). In this report, we describe an additional gene that is specifically expressed in prostate cancer and in normal prostate but not in any other tissues. This gene, NGEP, is expressed as two splice variants and encodes two different size proteins; the larger is localized to the plasma membrane and the smaller is detected in the cytoplasm of the cell.
Materials and Methods
Primers. The primers used in this study were synthesized by Lofstrand Lab (Gaithersburg, MD), and the nucleotide sequences of the primers are as follows: Ngepex25, ACAGCA CCG TCC TGA TCG ATG TGA GC; Ngep3-2, TGT CTA GCT TCA GGT CCT CCT CCC AAA CG; CW88, GCT TGC TGT CCA CCT GGC TCC GAG GC; T420, AAA GAT AGA TCC TGC TCC AGG AGC CGG; T421, GAC AGGTGA ATG GCA AAG GTG TCA GAG; T492, ATA TTC GAA GGT CAC CAG GTG TAA; T500, ACA GCA CCG TCC TGA TCG ATG TGA.
Identification of Orthologs and Analysis. To identify the mouse ortholog of NGEP, the mouse bacterial artificial chromosome (BAC) clone sequence database was searched by using blast programs at National Center for Biotechnology Information. A BAC clone (GenBank accession no. AC108412) was identified that harbors a putative mouse NGEP gene. A total of 24 exons were identified by comparing each human exon with the mouse genomic sequence. Some exons were refined by using mouse EST sequences. The rat NGEP gene sequence was predicted from the BAC clone AC119375. The genomic organization of human NGEP was determined by comparing cDNA with the human genome assembly of the Jul 2003 freeze. The human NGEP gene has a noncanonical splice donor sequence GC for the intron 24, which is frequently found in EST sequences and is not found in rodent orthologs.
Cell Lines and Culture Conditions. 293T cells were maintained in DMEM (Quality Biologicals, Gaithersburg, MD) at 37°C in 5% CO2. The medium is supplemented with 10% FBS (Quality Biologicals), 2 mM l-glutamine, 1 mM sodium pyruvate, and penicillin/streptomycin.
Dot-Blot and Northern Blot Hybridization. RNA hybridizations with multiple tissue RNA dot-blots and Northern blots were performed as follows: membranes were prehybridized for 2 h in hybridization solution (Hybrisol I, Intergen, Purchase, NY) at 45°C. The DNA probe labeled with 32P by random primer extension was added to the blot and hybridized for another 16 h. Washing and autoradiography of the blots were performed as described (18).
RT-PCR Analysis on Multitissue Gene Expression Panel. PCR was performed by using first-strand cDNA from prostate cancer cell lines and prostate cancer specimens as templates. Primers used for the PCR reaction are Ngepex25 and Ngep3-2. The conditions for PCR reaction are as follows: initial denaturation at 96°C for 3 min, 30 cycles of denaturation at 96°C for 30 sec, annealing at 56°C for 30 sec, and elongation at 72°C for 1 min.
RACE-PCR and Cloning of Full-Length NGEP. RACE-PCR was performed on Marathon Ready prostate cDNA to determine the 5′ end of the full-length NGEP transcript. The gene-specific primer CW88 was used for the RACE-PCR with adopter primer AP1 as recommended in the kit. The PCR product was gel purified and cloned into the TOPO TA cloning vector (Invitrogen). The positive clones were identified by restriction digestion and selected clones were sequenced. Finally, the full-length NGEP was cloned by PCR using the sequence information from the RACE clones. The PCR primers T420 and T421 were used for the cloning of the full-length cDNA of NGEP short transcript.
In Vitro Translation of NGEP Transcript. The in vitro translation of the NGEP cDNA was examined in an in vitro transcription-coupled translation system (TNT system, Promega) following the supplier's instruction. Analysis of the reaction mixture was performed as described (19).
In Situ Hybridization. Biotinylated probes used for the in situ hybridization were prepared by using the full-length NGEP cDNA cloned in TOPO TA cloning vector. Full-length U6 cDNA cloned in the same vector was used as a positive control. Probe labeling, pretreatment of the tissue section, hybridization, and washing conditions were similar to those described (19). Microscopic evaluation of the processed tissue sections was determined by using a Nikon Eclipse 800 microscope.
Transfection and Western Blot Analysis. A eukaryotic expression plasmid, pcDNA3.1-Myc-His expressing NGEP-S and NGEP-L form with a Myc epitope tag at the carboxyl terminus, were named pNGEP-S-Myc and pNGEP-l-Myc, respectively. The 293T cells were transiently transfected with these plasmids. After transfection, Western blot analysis was done as described (18). Filters were probed with 200 ng/ml anti-Myc-tag mAb (9E10; Santa Cruz Biotechnology).
Immunocytochemistry. Cotransfection of pNGEP-Myc with pEGFP-C1 (Clontech) as a transfection marker was done in 293T cells. After 24-h incubation after transfection in a slide chamber, cells were fixed for 10 min in 4% formaldehyde, treated for 5 min with 0.2% Triton X-100 in PBS, blocked for 30 min with 0.4% normal goat globulin in PBS, and then incubated at room temperature for 1 h with 5 μg/ml anti-Myc-tagMab for the long form, 0.2% Triton X-100 was omitted to prevent permeabilization. Subsequently, the cells were incubated at room temperature for 1 h with TRITC-conjugated secondary antibodies (The Jackson Laboratories) then mounted in anti-fade solution with DAPI (Vector Laboratories, Burlingame, CA). Labeled cells were analyzed by laser confocal microscopy.
Fluorescence-Activated Cell Sorter (FACS) Analysis. Analyses of normal and transfected 293Tcells was accomplished by using a FACS Calibur flow cytometer (Beckman Coulter) according to the manufacturer's protocol. In short, 2 × 10⁶ cells were incubated with 20 μg/ml anti-myc-mouse antibody in 100 μl of PBS containing 5% FBS and 0.1% sodium azide. After incubation for 1 h at 4°C, the cells were washed once and incubated with a 1:100 dilution of R-phycoerythrin-labeled goat anti-mouse IgG F(ab′)2 (BioSource, Camarillo, CA) for 1 h. After washing twice, the cells were suspended in 0.5 ml of the buffer, and the fluorescence associated with the live cells was measured. In these experiments, cells were initially gated in forward-scatter versus a side-scatter dot plot to exclude debris. Data for the events within this gate were then displayed in the single-parameter histogram plot. Statistical analysis of the histograms with the markers was performed by using winmdi2.8 software.
Results
Computer Analysis of the CW-1 Cluster. The cluster of ESTs designated CW-1 was identified by computer analysis of the human EST database as a prostate specific cluster as described (12). This cluster corresponds to the UniGene cluster Hs.163909. There are five ESTs in this cluster, of which three ESTs are from normal prostate and two ESTs are from prostate cancer. The assembled nucleotide sequence from these overlapping ESTs is 599 bp in length and contains a consensus polyadenalytion sequence (ATTAAA) followed by stretches of adenine at the 3′ end, indicating the end of the transcript. All ESTs are localized at chromosome 2q37.3.
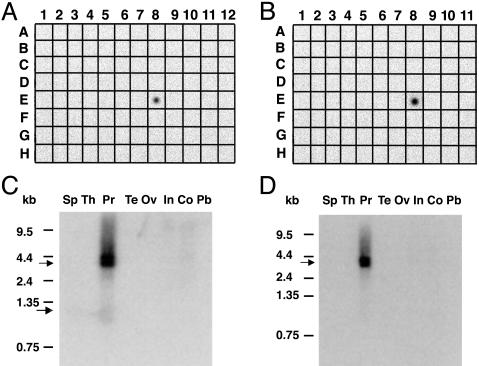
Expression Analysis of the CW-1 Cluster in Normal Tissues. To determine experimentally the expression of the CW-1 cluster in different normal tissues, we performed a multitissue dot-blot analysis using a 32P-labeled PCR-generated DNA fragment from the cluster as a probe. As shown in Fig. 1_A_, among the 76 different samples of normal and fetal tissue examined, CW-1 is detected strongly only in prostate sample (E8). The expression of the CW-1 cluster was not detected in any other tissues or essential organs including brain (A1), heart (A4), lung (A8), kidney (A7), and pancreas (B9). Because of its specific expression in prostate and because the nucleotide sequence does not match any known gene in the database, we named it NGEP (New Gene Expressed in Prostate).
Fig. 1.
Tissue-specific expression of NGEP mRNA. (A and B) RNA hybridization of a multiple tissue dot-blot containing mRNA from 61 normal human cell types or tissues using NGEP-S (A) and NGEP-L (B) cDNA as probe. NGEP expression is observed only in prostate (E8). There is no detectable expression in brain (A1), heart (A4), lung (A8), kidney (A7), and pancreas (B9). (C and D) Northern blot analysis of NGEP in different normal tissues using NGEP-S (C) and NGEP-L (D) cDNA as probe. The short transcript (shown by an arrow) is ≈1.0 kb in size and the long transcript (shown by an arrow) is 3.5 kb in size and is expressed only in prostate.
Cloning of the Full-Length NGEP cDNAs: NGEP-S and NGEP-L. To determine the transcript size of NGEP, we analyzed a Northern blot containing mRNAs from different tissues, including prostate. The PCR-generated probe that was used for the dot-blot analysis was also used in this experiment. As shown in Fig. 1_C_, several bands of different sizes are detected and these are only in the prostate lane. The smallest band is ≈1.0 kb in size (arrow). There are two additional high molecular mass bands in the 3.5-kb region.
Because there is a consensus poly(A) signal sequence at the 3′ end of the cluster sequence, we initially focused our efforts on identifying the missing 5′ end of the transcript. To do this, we used a 5′ RACE-PCR method, identified 318 bases of additional sequence at the 5′ end and obtained a cDNA clone of 917 bp in size, which corresponds to the NGEP short transcript (NGEP-S). Comparison of the nucleotide sequence with the human genome sequence reveals that NGEP-S has 4 exons and has an ORF of 179 aa. The calculated molecular weight of the protein encoded by NGEP-S is ≈19.6 kDa.
The Northern blot analysis shown in Fig. 1_C_ suggests that there is a high molecular mass splice variant of NGEP. To determine whether the NGEP transcript is extended at the 3′ end, we performed a 3′ RACE PCR using the T500 oligonucleotide as a gene specific primer. In addition to the expected 300-bp fragment derived from the short transcript, we were able to amplify a PCR fragment of ≈3.0 kb in size by using normal prostate cDNA as a template. The PCR product was TA cloned and sequenced. With this additional 3′ end sequence we assembled a cDNA of 3.5 kb in size, which corresponds in size to the high molecular weight transcript observed in the Northern blot analysis.
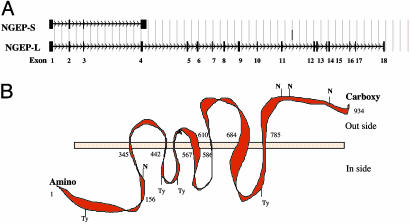
To determine the tissue specific expression of the long transcript of NGEP (NGEP-L), we performed a multitissue dot blot and Northern analysis using a long form specific probe. As shown in Fig. 1 B and D, NGEP-L, like NGEP-S, is expressed only in prostate tissue. The transcript size detected by this long form specific probe is 3.5 kb. Nucleotide sequence analysis of the NGEP-L transcript and comparison with the human genome sequence reveals that the gene has 18 exons (Fig. 2_A_) and a predicted ORF of 934 aa. As shown in Fig. 2 A, exon 4 of NGEP-L is spliced and extended at the 3′ end. For the short transcript the fourth exon is longer and ends with a polyA signal sequence. Because of this splicing, 156 aa residues at the amino terminus of both the NGEP-S and NGEP-L transcripts are identical, but 23 aa at the carboxyl terminus of NGEP as well as 778 residues of NGEP-L are unique. The amino acid sequence analysis of the predicted 934 aa ORF shows no significant sequence similarity with any known protein in the human database. There is a very weak (25%) sequence identity with Drosophila protein AXS. The transmembrane prediction program (tmhmm) predicts seven membrane-spanning regions for the protein encoded by the NGEP-L transcript, suggesting that the protein might be associated with a cell membrane. The predicted topology of the NGEP-L is shown in Fig. 2.
Fig. 2.
Schematics describing the NGEP gene and the proteins it encodes. (A) Genomic organization of NGEP gene. There are 18 exons for the long transcript and four exons for the short transcript (filled boxes). (B) Predicted topology of the protein encoded by the NGEP-L transcript. There are seven predicted membrane spanning regions; the amino terminus is predicted to be inside, and the carboxyl terminus is predicted to be outside of the cell. There are several predicted tyrosine phosphorylation sites (Ty) and _N_-glycosylation sites (N) in this protein.
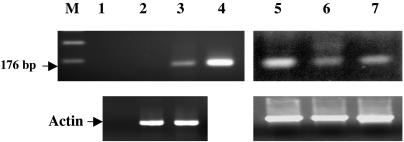
To determine the expression of NGEP in prostate cancer tissues as well as in prostate cancer cell lines, we performed an RT-PCR analysis using RNAs from two prostate cancer cell lines, LNCaP and PC-3, and three prostate cancer specimens. The long form of NGEP mRNA was detected in all three prostate cancer specimens and in the LNCaP cell line, but not in the PC-3 cell line (Fig. 3).
Fig. 3.
RT-PCR analysis of RNAs from prostate cancer specimens and prostate cancer cell lines. M, molecular mass standard; lane 1, negative control; lane 2, PC-3, lane 3, LNCaP; lane 4, pNGEP plasmid positive control; and lanes 5-7, prostate cancer samples. The quality of the cDNA was evaluated by performing PCR using primers specific for actin.
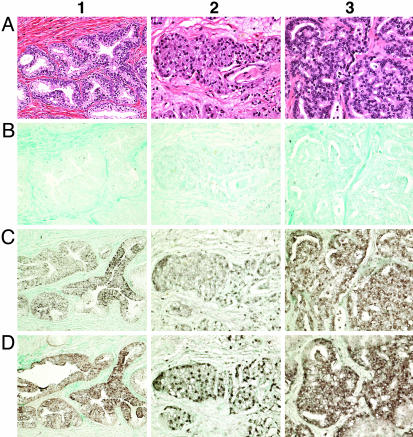
NGEP mRNA Is Expressed in Epithelial Cells of Normal Prostate and Prostate Cancer. To determine the specific cell type that expresses NGEP mRNA, and whether expression is homogenous we used in situ hybridization with biotin-labeled NGEP cDNA. As shown in Fig. 4, NGEP mRNA is expressed in prostatic epithelial cells in benign prostate tissue (Fig. 4_D_, column 1), and in prostate cancer samples (Fig. 4_D_, columns 2 and 3). The signal is present in both basal and terminal epithelial cells. There is no detectable signal in cells of the stromal compartment indicating that NGEP is specifically expressed in the epithelial cells of the normal prostate and prostate cancer. The signal intensity is strong compared with the signal intensity of the positive control U6 probe (Fig. 4 C, columns 1-3). CD22, which is specifically expressed in B-lymphocytes, was used as a negative control in the analysis and gave no signal (Fig. 4 B, columns 1-3).
Fig. 4.
In situ localization of NGEP mRNA in prostate tissue. (A) Normal prostate (column 1) and prostate cancer (columns 2 and 3) sections stained with hematoxylin/eosin to show the morphology. The epithelial cells are stained blue, whereas the connective tissue is stained pink. (B) B lymphocyte-specific gene CD22 used as a negative control probe for in situ hybridization. Note the absence of signal in the epithelial cells. (C) U6 is a small nuclear RNA used as a positive control probe. The epithelial cells show a strong signal. (D) NGEP shows positive signals in the epithelial cells of normal prostate tissue (column 1) as well as in two adenocarcinomas (columns 2 and 3).
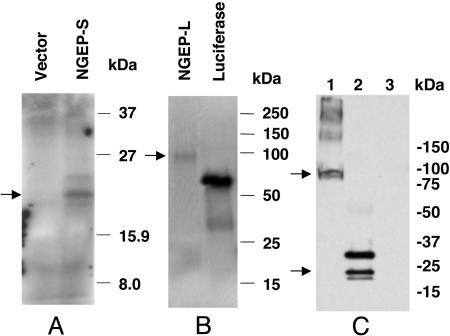
NGEP Long Transcript Encodes a Plasma Membrane Protein, and the Short Transcript Encodes a Cytoplasmic Protein. The short and long transcripts of NGEP have predicted ORFs of 179 and 934 aa, respectively. The calculated molecular masses of the predicted ORF are 19.6 kDa for the short form and 95 kDa for the long form. To determine the actual size of the protein encoded by the NGEP cDNA, in vitro transcription and translation was performed by using a rabbit reticulocyte lysate system. SDS/PAGE analysis and fluorography of the translated product showed that the NGEP short form encodes a protein product of ≈20 kDa in size (Fig. 5_A_; NGEP-S) and the protein product for the long form migrates around the 100-kDa region (Fig. 5_B_; NGEP-L).
Fig. 5.
Analysis of the protein products encoded by NGEP. (A and B) In vitro translation of the NGEP-S (A) and NGEP-L (B) cDNAs. The expected 20-kDa protein product is detected in lane NGEP-S, and a 100-kDa product is detected in lane NGEP-L by using short- and long-form cDNAs, respectively (shown by arrows). Lane with vector DNA alone showed no detectable bands, and the positive control luciferase shows the expected 62-kDa band. (C) Western blot analysis of NGEP-transfected cell extracts with an anti-Myc-tag antibody. The expected 100-kDa protein is detected (shown by an arrow) in extracts transfected with pNGEP-L-Myc (lane 1). Three specific bands (18, 20, and 28 kDa) are detected in cell extracts transfected with plasmid pNGEP-S-Myc (lane 2). A cell extract from vector only transfected cells and produced no signal.
To determine the size of the protein encoded by two splice variants of NGEP in cells, we transfected 293T cells with a eukaryotic expression plasmid pcDNA3.1-Myc-His expressing either the short or long variants of NGEP with a Myc epitope tag at the carboxyl terminus. Western blot analysis of cell extracts from these transfected cells, using anti-myc antibody, detects a band of 100 kDa in cells transfected with the long variant (Fig. 5_C_, lane 1). In cells transfected with NGEP-S, there is the expected band of 20 kDa (shown by an arrow) and a slightly smaller band that may be a degradation product. In addition, we detected a larger band of ≈28 kDa with NGEP-S (Fig. 5_C_, lane 2) and several high molecular mass bands with NGEP-L (Fig. 5_C_, lane 1). All of these bands are specific because they were not detected in cells transfected with empty vector (Fig. 5_C_, lane 3). The nature of the high molecular mass bands has not been determined, but they could be caused by covalent modification.
To determine the location of NGEP proteins in the cell, we carried out immunocytochemistry in 293T cells transfected with plasmid pcDNA3.1-Myc-His expressing either the short or long variant of NGEP with a Myc epitope tag at the carboxyl terminus. In cells transfected with NGEP-S with a Myc tag, the protein was detected in the cytoplasm and the nucleus when cells were permeabilized with Triton X-100 (Fig. 6_A_). To detect the presence of NGEP-L on the cell surface, we used nonpermeabilized cells and obtained the image shown in Fig. 6_B_. The plasma membrane is strongly labeled, and the labeling occurs in a punctate pattern.
Fig. 6.
Localization of NGEP protein in tranfected cells. (A and B) Immunocytochemical analysis of NGEP localization in transfected cells. Immunocytochemistry using anti-Myc antibody was done under confocal microscopy in 293T cells cotransfected with pEGFP and pNGEP-S-Myc. The red signals representing NGEP-S expression were detected in both the cytoplasm and the nucleus (A). In cells transfected with pNGEP-L-Myc, positive red signals were localized on the plasma membrane when nonpermeabilized conditions were used for immunostaining (B). (C) FACS analysis of NGEP-S and NGEP-L form. Single parameter histograms for the gated cells for nontransfected (red), NGEP-S (green), and NGEP-L (purple) are shown. Cells were incubated with the anti-myc mouse antibody (20 μg/ml), followed by phycoerythrin-labeled goat anti-mouse IgG. The marker M1, placed around the negative peak of the subclass control is determined by using nontransfected 293T cells. The marker M2 is placed to the right of M1 to designate the positive events. M2's are 20%, 22%, and 40% for nontransfected, 293T cells-NGEP-S, and 293T cells NGEP-L, respectively.
To confirm that the carboxyl terminus of the NGEP-L protein is on the exterior of the plasma membrane (Fig. 2_B_), we performed a FACS analysis with 293T cells that were transiently transfected with plasmids expressing either NGEP-L or NGEP-S with a myc epitope tag at the carboxyl end of each. Forty-eight hours after transfection, the cells were subjected to FACS analysis as described in the Materials and Methods in the absence of a permeabilizing agent. As shown in Fig. 6_C_, a substantial number of cells transfected with NGEP-L reacted with an antibody to myc, whereas the signal from cells transfected with NGEP-S was similar to the signal from untransfected cells. These results indicate that the NGEP-L protein is associated with the plasma membrane of the cell and that the carboxyl terminus of the protein is located on the exterior of the plasma membrane.
Identification of NGEP-L Orthologs in Mouse and in Rat. To identify NGEP-L orthologs in other species, we used genome and EST databases as well as bioinformatics programs described in Materials and Methods. As shown in Fig. 7 and Table 1, we have identified NGEP-L ortholgs in mouse and in rat and the NGEP-L amino acid sequence as well as the genomic structure is highly conserved among the three different species.
Fig. 7.
Analysis of the NGEP-L orthologs in mouse and rat. Schematics showing genomic organization of NGEP-L and its rodent orthologs. Exon numbers are given at the top. The size of each exon and intron is noted below the corresponding exon or intron. The exons with different sizes among the species are underlined. The figure is not drawn to scale.
Table 1. Pairwise alignment scores of NGEP-L and its rodent orthologs.
| Human | Mouse | Rat |
|---|---|---|
| Human | 85.1 | 84.8 |
| Mouse | 81.3 | 96.4 |
| Rat | 81.0 | 95.2 |
Discussion
We have identified a gene, NGEP, that appears to be a differentiation antigen that is expressed only in normal prostate and prostate cancer cells. NGEP is localized at chromosome 2q37.3 on the human genome and is expressed as two splice variants. The short transcript has an ORF of 179 aa; the long form encodes a membrane protein comprised of 934 aa that is predicted to have seven membrane-spanning regions. The deduced amino acid sequence of NGEP has no close sequence similarity with any known proteins in the human database. However, blastp (20) run against the National Center for Biotechnology Information's nonredundant database (www.ncbi.nlm.nih.gov/blast) using the NGEP-L protein sequence resulted in hit to a DUF590 motif. According to the sequence-based protein classification database Pfam (21), DUF590 is defined as domain of unknown function 590. DUF590 is found in 46 eukaryotic proteins. Most of these proteins do not have a signal sequence but possess multiple membrane-spanning region like NGEP. The functional relevance of this motif is not yet established.
NGEP-L Is Well Conserved in Mouse and Rat. Complete or nearly complete genome sequences of numerous species enables one to examine gene orthologs in different species. In this analysis, we have used genome sequences and EST databases to identify the orthologs of NGEP in mouse and rat. In addition to a very high sequence identity (81%) at the amino acid level, the genomic structures of human, rat, and mouse NGEP are very similar (Fig. 7). The sizes of most of the coding exons of NGEP are identical, suggesting that the NGEP gene is well conserved among these species. The high similarity of NGEP proteins among these orthologs may make the generation of monoclonal antibodies against NGEP difficult.
NGEP Is Frequently Expressed in Prostate Cancer. RT-PCR analysis of NGEP expression shows that NGEP-L is expressed in the androgen-dependent prostate cancer cell line, LNCaP, but not in androgen-independent PC-3 cells and DU145 cells (data not shown). It was also detected in three of three prostate cancer samples (Fig. 3) and in 20 other prostate cancers (data not shown). In situ hybridization confirmed expression in the epithelial cells of two prostate cancers (Fig. 4). We conclude that NGEP-L is frequently expressed in prostate cancer.
NGEP-L, an Attractive Candidate for Prostate Cancer Immunotherapy. For any immuno-based targeted therapy to be effective, it is important that the antigen is expressed in cancer cells but not expressed in any essential normal tissues. Expression of NGEP is restricted to prostate cancer and normal prostate with no detectable expression in any normal essential tissues we have tested. Our results from both RT-PCR analysis and in situ hybridization of prostate cancer samples indicates that NGEP is expressed in the large majority of cancer specimens tested (data not shown). The expression of NGEP-L in many cancer samples and its localization in the plasma membrane predicts that NGEP-L will be a useful target for prostate cancer immunotherapy.
Acknowledgments
We thank Verity Fogg for cell culture assistance, Susan Garfield for technical assistance in confocal microscopy, the members of the Gene Discovery Group for their valuable comments during this study, Maria Gallo for thoroughly reading our paper, and Anna Mazzuca for editorial assistance.
Abbreviations: FACS, fluorescence-activated cell sorter; NGEP-L, NGEP long form; NGEP-S, NGEP short form.
References
- 1.Bostwick, D. G., MacLennan, G. T. & Larson, T. R., eds. (1999) Prostate Cancer: What Every Man and His Family Needs to Know (Villard, New York), Revised Ed.
- 2.Hara, T., Harada, N., Mitsui, H., Miura, T., Ishizaka, T. & Miyajima, A. (1994) Blood 84**,** 189-199. [PubMed] [Google Scholar]
- 3.Liang, P. & Pardee, A. B. (1992) Science 257**,** 967-971. [DOI] [PubMed] [Google Scholar]
- 4.Velculescu, V. E., Zhang, L., Vogelstein, B. & Kinzler, K. W. (1995) Science 276**,** 1268-1272. [DOI] [PubMed] [Google Scholar]
- 5.Schena, M., Shalon, D., Davis, R. W. & Brown, P. O. (1995) Science 270**,** 467-470. [DOI] [PubMed] [Google Scholar]
- 6.Reiter, R. E., Gu, Z. N., Watabe, T., Thomas, G., Szigeti, K., Davis, E., Wahl, M., Nisitani, S., Yamashiro, J., Le Beau, M. M., et al. (1998) Proc. Natl. Acad. Sci. USA 95**,** 1735-1740. [DOI] [PMC free article] [PubMed] [Google Scholar]
- 7.Israeli, R. S., Powell, C. T., Fair, W. R. & Heston, W. D. W. (1993) Cancer Res. 53**,** 227-230. [PubMed] [Google Scholar]
- 8.Hubert, R. S., Vivanco, I., Chen, E., Rastegar, S., Leong, K., Mitchell, S. C., Madraswala, R., Zhou, Y. H., Kuo, J., Raitano, A. B., et al. (1999) Proc. Natl. Acad. Sci. USA 96**,** 14523-14528. [DOI] [PMC free article] [PubMed] [Google Scholar]
- 9.Tsavaler, L., Shapero, M. H., Morkowski, S. & Laus, R. (2001) Cancer Res. 61**,** 3760-3769. [PubMed] [Google Scholar]
- 10.Xu, L. L., Stackhouse, B. G., Florence, K., Zhang, W., Shanmugam, N., Sesterhenn, I. A., Zou, Z., Srikantan, V., Augustus, M., Roschke, V., et al. (2000) Cancer Res. 60**,** 6568-6572. [PubMed] [Google Scholar]
- 11.Okubo, K. & Matsubara, K. (1997) FEBS Lett. 40**,** 225-229. [DOI] [PubMed] [Google Scholar]
- 12.Vasmatzis, G., Essand, M., Brinkmann, U., Lee, B. & Pastan, I. (1998) Proc. Natl. Acad. Sci. USA 95**,** 300-304. [DOI] [PMC free article] [PubMed] [Google Scholar]
- 13.Wolfgang, C. D., Essand, M., Vincent, J. J., Lee, B. & Pastan, I. (2000) Proc. Natl. Acad. Sci. USA 97**,** 9437-9442. [DOI] [PMC free article] [PubMed] [Google Scholar]
- 14.Olsson, P., Bera, T. K., Essand, M., Kumar, V., Duray, P., Vincent, J., Lee, B. & Pastan, I. (2001) Prostate 48**,** 231-241. [DOI] [PubMed] [Google Scholar]
- 15.Essand, M., Vasmatzis, G., Brinkmann, U., Duray, P., Lee, B. & Pastan, I. (1999) Proc. Natl. Acad. Sci. USA 96**,** 9287-9292. [DOI] [PMC free article] [PubMed] [Google Scholar]
- 16.Brinkmann, U., Vasmatzis, G., Lee, B., Yerushalmi, N., Essand, M. & Pastan, I. (1998) Proc. Natl. Acad. Sci. USA 95**,** 10757-10762. [DOI] [PMC free article] [PubMed] [Google Scholar]
- 17.Brinkmann, U., Vasmatzis, G., Lee, B. & Pastan, I. (1999) Cancer Res. 59**,** 1445-1448. [PubMed] [Google Scholar]
- 18.Bera, T. K., Maitra, R., Iavarone, C., Salvatore, G., Kumar, V., Vincent, J. J., Sathyanarayana, B. K., Duray, P., Lee, B. K. & Pastan, I. (2002) Proc. Natl. Acad. Sci. USA 99**,** 3058-3063. [DOI] [PMC free article] [PubMed] [Google Scholar]
- 19.Bera, T. K., Iavarone, C., Kumar, V., Lee, S., Lee, B. K. & Pastan, I. (2002) Proc. Natl. Acad. Sci. USA 99**,** 6997-7002. [DOI] [PMC free article] [PubMed] [Google Scholar]
- 20.Altschul, S. F., Madden, T. L., Schaffer, A. A., Zhang, J., Zhang, Z., Miller, W. & Lipman, D. J. (1997) Nucleic Acids Res. 25**,** 3389-3402. [DOI] [PMC free article] [PubMed] [Google Scholar]
- 21.Bateman, A., Birney, E., Durbin, R., Eddy, S. R., Finn, R. D. & Sonnhammer, E. L. (1999) Nucleic Acids Res. 27**,** 260-262. [DOI] [PMC free article] [PubMed] [Google Scholar]
