Droplet microfluidics for amplification-free genetic detection of single cells (original) (raw)
. Author manuscript; available in PMC: 2013 Sep 21.
Published in final edited form as: Lab Chip. 2012 Jul 30;12(18):3341–3347. doi: 10.1039/c2lc40537g
Abstract
In this article we present a novel droplet microfluidic chip enabling amplification-free detection of single pathogenic cells. The device streamlines multiple functionalities to carry out sample digitization, cell lysis, probe-target hybridization for subsequent fluorescent detection. A peptide nucleic acid fluorescence resonance energy transfer probe (PNA beacon) is used to detect 16S rRNA present in pathogenic cells. Initially the sensitivity and quantification ability of the platform is tested using a synthetic target mimicking the actual expression level of 16S rRNA in single cells. The capability of the device to perform “sample-to-answer” pathogen detection of single cells is demonstrated using E. coli as a model pathogen.
Introduction
Droplet-based microfluidic systems have introduced otherwise ‘analog’ microfluidic systems (i.e. continuous flow microfluidics) to the benefits of the ‘digital’ operation format. Analogous to the benefits of digital technology in electronics, droplet microfluidics allows ‘digital operations’ like mixing precise reagent quantities, splitting a reagent into precise small volumes etc. possible in microfluidic systems. Such digital operations can be very beneficial in biological analyses. For instance, amplification of individual DNA molecules by separating them from each other using DNA sample splitting into small volumes, i.e. digital PCR, can be used for quantification of DNA and sensitive detection of rare mutant DNA present in the background of a large number of wild-type DNA1-4.
At a cellular level, droplets can also be used for confinement and manipulation of single cells into small droplets, making them ideal for conducting high throughput single cell studies. However, this application of droplets is in its infancy with only a select few reports having started harnessing this potential of droplet microfluidics. For instance, Huebner et al. demonstrated quantification of protein expression in single cells encapsulated within droplets, from a naturally fluorescent protein5. Joensson et al. demonstrated detection of cell-surface biomarkers using enzymatic amplification in droplets6. Boedicker et al. demonstrated analysis of single bacterial cells for their susceptibility to antibiotics in droplets, using a fluorescent cell viability indicator assay7. Brouzes et al. developed optically-coded droplet assay for high-throughput screening of a drug library for its cytotoxic effect against U937 cells8. Zeng et al. proposed a single cell PCR assay for genetic detection using a microfluidic droplet generator array9. This platform, although capable of high throughput screening, requires off-chip PCR reactions and a complex multicolor flow cytometer for amplicon detection.
In this article we report a droplet microfluidic device that facilitates amplification-free genetic detection of single cells. This device offers a simple and yet fully integrated approach to include all the assay steps, including cell isolation, lysis, probe-target binding and fluorescent detection, performed within microfluidic droplets. We exploit the relatively unexplored probe hybridization based assays for detection of an intracellular genetic marker of interest. Single cell sensitivity is achieved in our platform through a two pronged approach. Initially, stochastic confinement of single cells within small droplets (pL volume) is used to maintain a low abundance intracellular target of interest from single cells at high concentrations. Cell encapsulation in droplets is inherently a probabilistic process, presenting a unique challenge for ensuring encapsulation of a single cell in each droplet and hence, quantification of target cells present in a sample. However, cell encapsulation within droplets has been demonstrated to be a Poisson process in the droplet microfluidic literature 10-13. As a result, despite multiple cell encapsulation in a small fraction of droplets, the underlying Poisson distribution and hence the target cell count in the sample can be estimated. Secondly, the microfluidic platform is coupled with highly sensitive confocal fluorescence spectroscopy for sensitive detection of target biomolecules from individual droplets14, 15. Simple temperature incubation requirements for cellular lysis and hybridization allow us to streamline all the assay steps in a single droplet. Our platform utilizes 16S ribosomal RNA (rRNA) as the genetic biomarker for pathogen detection. The 16S rRNA gene is often used for phylogenetic studies as it is highly conserved between different species of bacteria and archaea16-18. In addition, 16S rRNA is typically present at 104-105 copies per cell19. Thus, using 16S rRNA as a surrogate biomarker offers the dual benefits of high specificity as well as a relatively large number per cell as compared to DNA. Confinement of these molecules within the small volume of a droplet, coupled with sensitive fluorescence detection readout like confocal fluorescence spectroscopy15, 20, 21 makes amplification-free detection at single cell levels possible. A simple target concentration calculation can illustrate the concentrating power of microfluidic droplets. Typical volumes handled by pipettors are in microliters. Assuming a single bacterial cell containing 20,000 16S rRNA molecules is lysed in a 1 μL volume, the target 16S rRNA molecule is present at the fM concentration, a concentration level that usually necessitates target amplification prior to detection. However, if the same cell is lysed while confined within a pL-sized droplet, the resulting nM target (Supp. Table 1) is readily detectable, eliminating the need for target amplification. The picoliter to nanoliter sized droplets indicated in Supp. Table 1 can be easily generated using flow focusing droplet generators22.
In situ detection of 16S rRNA encapsulated in a droplet requires fluorescent molecular probes capable of homogeneous detection in a solution phase without the need to remove (wash away) free probes. Molecular beacons are widely used fluorescence resonance energy transfer (FRET) probes that fluoresce upon hybridization with complimentary targets23. Since unhybridized beacons are minimally fluorescent, they form excellent probes for homogeneous detection of nucleic acid targets24, 25. However, standard oligonucleotide molecular beacons suffer from the complication of negative charge based repulsion as well as the requirement of high salt concentrations when used to detect a large target molecule with extensive secondary structure like 16S rRNA. Instead, we use a peptide nucleic acid (PNA) beacon to carry out intra-droplet 16S rRNA detection. PNA is a synthetic DNA analogue synthesized by attaching nucleic acid bases to a peptide backbone. The absence of negative charge on the PNA backbone prevents the problems of charge-based repulsion from the target nucleic acid as well as removes the requirement for higher salt concentration for effective target binding26. Lower salt concentrations promote denaturation of the 16S rRNA targets, providing easier access for the probe molecules to bind their complementary region on the rRNA26.
The operational procedure of the microfluidic single cell detection platform is illustrated in Fig. 1. Initially a pathogenic cell sample is mixed with PNA beacon. The mixture is diluted and compartmentalized into uniform picoliter sized droplets. These droplets then traverse through an incubation zone where exposure to a high temperature results in pathogenic cell lysis as well as PNA beacon hybridization with target 16S rRNA molecules. Thermal lysis of cells is a commonly used cell lysis technique, which has been shown to be efficient at cell lysis and post-lysis analysis of cellular contents using PCR for a variety of cell types including bacterial27, 28 and human cells29 as well as virii30. The beacon becomes fluorescent once hybridized with a complementary sequence on a conservative site of the 16S rRNA target, resulting in a substantial increase in fluorescence of the droplet containing a pathogenic cell. Consequently, the cell of interest is identified and quantitated by detecting the bright fluorescent droplets using confocal fluorescence spectroscopy.
Fig 1.
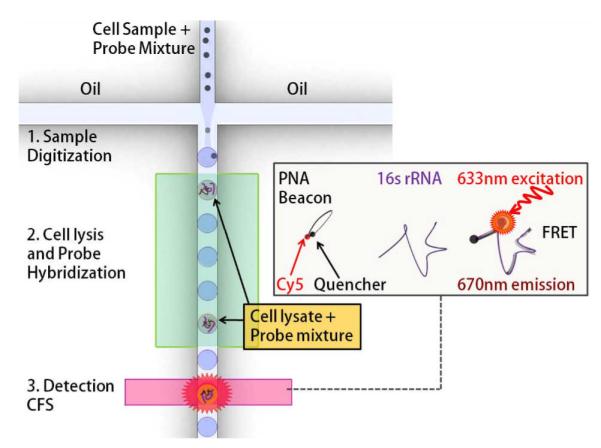
Schematic of the droplet assay platform for single cell detection. A statistically dilute mixture of pathogenic cells and PNA beacons is encapsulated into picoliter sized droplets, which are then incubated at elevated temperatures to facilitate cell lysis and beacon-target hybridization. PNA beacons encapsulated in a droplet containing a cell start fluorescing after hybridization with complementary 16S rRNA targets released from the cell. The specific cell of interest is detected and quantified by screening the fluorescent droplets using confocal fluorescence spectroscopy (CFS).
Experimental
PNA Beacon
The PNA beacon sequence used for our experiments is N-BHQ3-E-GCT-GCC-TCC-CGT-AGG-A-KK-Cy5-C. The probe sequence used in our experiments is complementary to the bacterial domain S-D-Bact-0338-a-A-1826. In its natural state the beacon folds on itself in solution, so that the quencher BHQ3 and the fluorophore Cy5 are in close vicinity with each other, leading to effective quenching of Cy5 fluorescence (Fig. 1, inset). However, when bound to a complementary target, the fluorophore moves away from quencher and starts fluorescing.
Control Targets and Pathogen Cells
The synthetic target used in the characterization experiments (referred to as ‘rRNA mimic’ hereafter) is a 200 bp oligonucleotide target mimicking a portion of the E. coli 16S rRNA sequence (5′-CTAGT AGGTG GGGTA ACGGC TCACC TAGGC GACGA TCCCT AGCTG GTCTG AGAGG ATGAC CAGCC ACACT GGAAC TGAGA CACGG TCCAG ACTCC TACGG GAGGC AGCAG TGGGG AATAT TGCAC AATGG GCGCA AGCCT GATGC AGCCA TGCCG CGTGT ATGAA GAAGG CCTTC GGGTT GTAAA GTACT TTCAG CGGGG-3′)31. The oligonucleotide was synthesized by Integrated DNA Technologies (Coralville, Iowa). Two types of control samples were prepared including 1) a ‘positive control’ containing synthetic targets hybridized with PNA beacon (100nM) in the presence of background human genomic DNA (1μg/100μL) and 2) a ‘ negative control’ containing PNA beacon (100nM) in the presence of background human genomic DNA (1ug/100ul). The synthetic target concentration was different for different experiments as indicated in the results section. These samples underwent incubation at 65°C for 1 hour followed by gradual cooling to room temperature in a thermocycler to promote hybridization of the PNA beacon with the synthetic target. These samples were then stored at −20°C until the experiments were conducted on the microfluidic chips. Prior to the experiments on chip, 10nM Alexa Fluor® 488 dye was added to these samples as an indicator to visualize the droplet boundary and detect the passage of a droplet through the detection region15. Alexa Fluor® 488 exhibits minimal spectral crosstalk with the Cy5 dye labeled to the PNA beacon and thus does not interfere with rRNA detection.
For the experiments with an actual pathogen sample, we used E. coli as a model pathogen. Prior to the experiments, E. coli cells (ER2566 strain, New England Biolabs, Inc) were grown overnight at 37°C on a shaker (MaxQ 2000, Thermo Fisher Scientific Inc.) in an incubator (Napco 8000WJ, Thermo Fisher Scientific Inc.). We used M9 minimal media (TEKnova, Inc.) for culturing the bacterial cells. E. coli cells from this overnight culture were spun down and resuspended in PBS at concentrations required for an experiment. For all of our experiments, we maintained the PNA beacon concentration constant at 100 nM. The hybridization buffer used for all the experiments including those with the synthetic target was maintained at a constant composition of 40% formamide, 100 mM NaCl and 25 mM Tris-HCl. 10 nM Alexa Fluor® 488 was added as an indicator dye to these cell samples before introducing them on the microfluidic chip .
Design and Fabrication of Microfluidic Device
Fig. 2 shows the layout of the microfluidic chip used for conducting the single cell pathogen detection assay. We used a flow focusing droplet generator to produce uniform picoliter volume droplets. As seen from Supp. Table 1, smaller droplet sizes lead to higher target concentrations from single cells. Hence, the signal to background ratio for this detection platform can be tuned by varying the droplet size. The sample droplets produced at the droplet generator region are channeled to a droplet ‘incubation zone’ on the chip. The chip is designed with two different heights of photoresist. All the areas on the chip other than the ‘incubation zone’ are made with 50 μm photoresist height. The incubation zone is fabricated with 350 μm tall layer of photoresist to allow droplets to spend sufficient time on chip for completion of cell lysis and probe hybridization with target 16S rRNA molecule.
Fig 2.
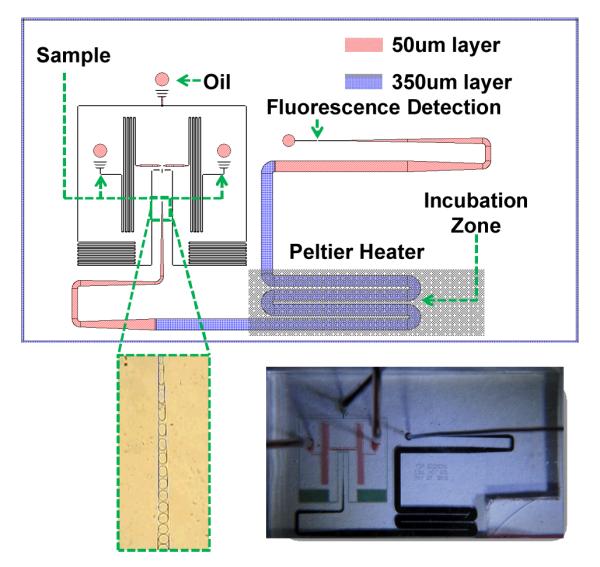
Microfluidic chip design. The top image is the actual mask design used for fabricating our microfluidic chip. The chip design consists of two different layers fabricated using two different heights of photoresist (50 μm and 350 μm). The chip features an oil inlet with two sample inlets. The chip is capable of generating droplets from a sample, droplet incubation at a high temperature (Peltier heater region) and fluorescence detection from the droplets using CFS. The bottom left image shows a stream of sample droplets generated on an actual chip, while the bottom right image is a photograph of an actual PDMS chip used for our experiments.
The chip was fabricated with polydimethylsiloxane (PDMS) using the standard soft lithography technique. Briefly, a silicon wafer was spin coated with a 50 μm thick layer of SU8-3025 Photoresist (PR) (MicroChem Corp.) and patterned through photolithography. This thin PR layer was hard baked onto the wafer. Another thick SU8-3050 layer was then spin coated on the same wafer and patterned using the second mask to fabricate the incubation zone of the chips. The second layer was also hard baked on the wafer and the patterned wafer was then used as a mold to fabricate PDMS chips.
To fabricate PDMS structures from the silicon wafer molds, Sylgard™ 184(Dow Corning) base and curing agent were mixed in a 10:1 ratio by weight. This mixture was degassed in vacuum and then poured on top on the silicon wafer molds. The mixture on the wafers was cured at 80°C for 30 mins. The cured PDMS was then peeled off the silicon wafer and individual devices were cut out. Access holes for fluid entry were punched into the chips and the chips were then bonded to No. 1 coverglass (Fisherfinest) using oxygen plasma bonding.
Optical Detection Setup
Confocal fluorescence spectroscopy (CFS) offers the sensitivity as well as high speed required for rapid screening of droplets. We used a custom built CFS setup for our experiments. The details of a similar setup construction were discussed previously15, 32. The setup is capable of dual laser excitation (488 nm and 633 nm) as well as simultaneous dual color detection, including the ‘green’ (centered at 520 nm) and ‘red’ (centered at 670 nm) wavelength bands. A custom metal plate was designed to act as an interface between the microfluidic chip and the CFS setup. This metal plate was mounted on a Piezo stage (Thorlabs) to allow precise positioning of the chip with respect to the objective on the CFS setup. The metal plate was also used to position a peltier heater below the ‘incubation zone’ on the microfluidic chip. The peltier heater was maintained at a fixed incubation temperature throughout an experiment on chip.
Operation of Microfluidic Device
The chips were treated with Aquapel (PPG Industries) to render the channels hydrophobic prior to each experiment33. Following this treatment, oil phase was introduced onto the chip through the oil inlet and allowed to flow on chip for a few minutes to wet the channels with oil phase. The oil phase used for our experiments consisted of FC-40 oil (3M) and 2% EA surfactant by weight (Raindance Technologies, Inc).
An E. coli and PNA beacon mixture was then introduced onto the chip through the sample inlet for each experiment. Before initiating droplet generation on chip, the chip was placed onto the custom metal plate attached to the CFS setup. The chip was held in place using vacuum lines on the metal plate. The chip was placed such that the peltier heater on the metal plate was located below the incubation zone on the chip. The peltier heater was maintained at a constant temperature of 65°C throughout the course of an experiment. The excitation laser beam from the CFS setup was focused on the fluorescence detection region on the chip. After the chip was ready for fluorescence data collection, droplet generation was initiated on chip by pressurizing both oil and sample inlets. The droplets took approximately one hour to traverse the incubation region on chip before reaching the fluorescence detection region. The droplets were imaged after passing through the incubation region for each experiment to estimate the droplet size and account for any variations in droplet size between experiments. Fluorescence data was then continuously collected from the droplets passing the fluorescence detection region on chip while droplets were still being generated upstream on the chip.
Results and Discussion
Prior to our experiments with live cell samples, we conducted some tests with the rRNA mimic. The objective of these tests was two-fold: First to establish the sensitivity of the assay and second to simulate different cell concentrations in a cell sample to test quantification ability of our platform. To conduct this assay, PNA beacon was mixed with different concentrations of the rRNA mimic in the background of human genomic DNA as described in the experimental section. These experiments were conducted on a separate microfluidic device discussed in Supplementary Information (Section S.2). Briefly, this microfluidic device is capable of using valves to generate arbitrary sequences of droplets generated using two independent samples (positive and negative control samples described in the ‘Experimental’ section above).
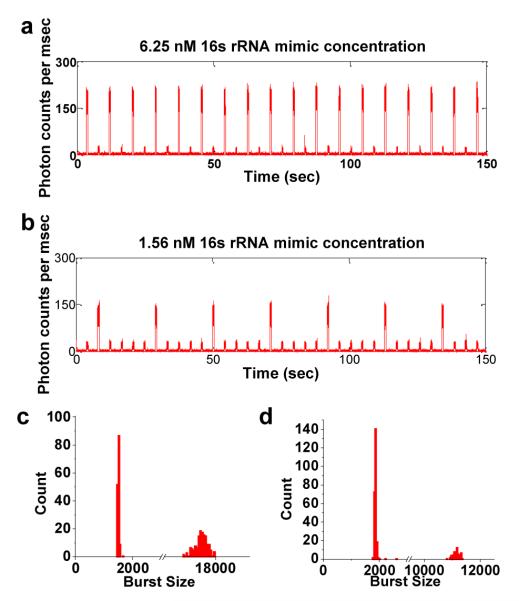
Fig. 3 illustrates sample fluorescence spectroscopy traces from two of these experiments. Fig. 3a indicates fluorescence data collected from an artificially generated sequence of one positive droplet per 2 droplets. The positive droplet is generated using a sample consisting of PNA beacon hybridized with 6.25 nM rRNA mimic in the background of human genomic DNA while the negative droplet is generated using a sample containing PNA beacon with human genomic DNA only. This experiment simulates a situation in which the cell concentration in a cell sample is such that approximately 50% of the droplets are empty while the other 50% have one or more cells encapsulated in them. Fig. 3b shows similar fluorescence data for rRNA mimic concentration of 1.56 nM. In this case, the sequence used was one positive droplet per 5 droplets. This experiment simulates a situation in which the cell concentration in a cell sample is such that approximately 80% of the droplets are empty while the other 20% have one or more cells encapsulated in them. The histograms in Fig. 3c and 3d correspond to the fluorescence data traces in Fig 3a and Fig 3b respectively. These histograms show the distribution of the burst size (sum of photons detected per droplet) for a total of 300 droplets for each corresponding condition in Fig. 3a and b. The histogram shows two distinct peaks indicating two populations of droplets i.e. positive droplets with rRNA mimic and negative droplets without rRNA mimic.
Fig 3.
Fluorescence data collected from the artificially generated sequences of positive control (PNA beacon + rRNA mimic + human genomic DNA) and negative control (PNA beacon + human genomic DNA only) droplets. The fluorescence observed is emitted by the Cy5 dye conjugated to the PNA beacon. a) The plot shows fluorescence data from a droplet sequence with one positive droplet per two droplets where the positive droplets contained 6.25 nM rRNA mimic concentration. The fluorescence data shows a clear difference between the positive droplets with strong fluorescent bursts and negative droplets with low background fluorescent bursts. b) The data shown is similar to subfigure ‘a’ but with the positive droplets containing rRNA mimic concentration of 1.56 nM and the droplet sequence being one positive droplet per 5 droplets. c and d) The histograms show the distribution of the burst size (sum of photons detected per droplet) for 300 droplets from each condition observed in the fluorescence data traces. Histograms in subfigures ‘c’ and ‘d’ correspond to the fluorescence data traces in ‘a’ and ‘b’ respectively. The bimodal nature of both histograms indicates clear demarcation between positive droplets with large burst size and negative droplets with small burst size. (The x axis has a breakpoint in both histograms for clear visualization of the bimodal histograms)
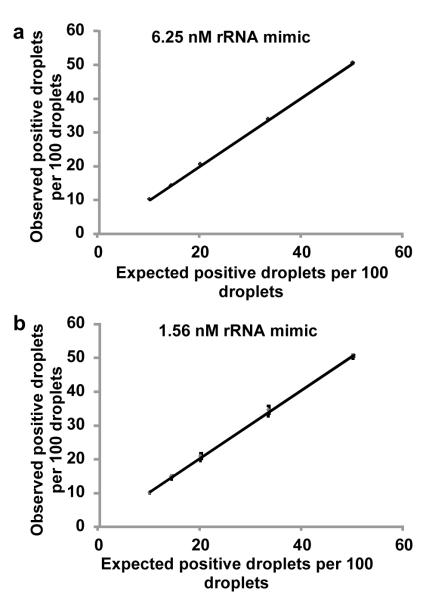
Sequences of droplets as shown in Fig. 3 with different ratio of the number of positive droplets to the negative droplets were run for extended periods of time and the fluorescence data collected was analyzed to differentiate between positive and negative droplets and test the reliability of the platform in differentiating between these two populations of droplets for long periods of time. This experiment was repeated for two different concentrations of rRNA mimic (6.25 nM and 1.56 nM) hybridized with the PNA beacon. The fluorescence data was analyzed to generate burst size for each droplet. A burst size threshold was determined to differentiate between ‘positive’ and ‘negative’ droplets as described in section S.3 in the Supplementary Information. Three different batches of 100 droplets each were analyzed to generate an ‘observed positive droplet count per 100 droplets’ for each condition (i.e. positive to negative droplet count ratio) for each rRNA mimic concentration. The results from this data analysis are plotted in Fig. 4. It shows that the expected and observed positive droplet count for each condition (i.e. positive to negative droplet count ratio) are in excellent agreement with each other for both rRNA mimic concentrations tested. These plots thus show that the platform can reliably differentiate different positive to negative droplet count ratios from each other at close to nanomolar target concentration in positive droplets. As seen from Supp. Table 1, these target concentrations in positive droplets correspond to the expected 16S rRNA concentrations obtained in picoliter sized droplets following a single pathogen cell lysis within the droplet. Thus, the results indicate the capability of our detection platform to quantify target cell count in a sample provided the cells are encapsulated in droplets with volumes in the picoliter regime.
Fig 4.
Quantification of positive droplet count in a droplet sequence for different artificially generated droplet sequences. For each rRNA mimic concentration, different droplet sequences with different ‘expected’ positive droplet counts were generated and fluorescence data was collected as shown in Fig. 3. This data was analysed to obtain the ‘observed’ positive droplet count for each sequence using burst size thresholding. Excellent linearity and close to 1 slope in the relationship between ‘expected’ positive droplet count and the ‘observed’ positive droplet count for both rRNA mimic concentrations tested indicate the quantification ability of our platform. (a: rRNA mimic concentration 6.25nM, linear fit y=1.0115×−0.1498, R2=0.9998, b: rRNA mimic concentration 1.56nM, linear fit y=1.0076×+0.2831, R2=0.9995)
We used E. coli as a model pathogen for single cell detection. Initially we tested the PNA beacon with E. coli cells in bulk under different temperature conditions to find the best conditions for optimal cell lysis and hybridization efficiency (see Supplementary Information S.4). Briefly, we tested E. coli cell incubation with PNA beacon at three temperature conditions viz. Room Temperature (RT), 65°C and 95°C. Fluorescence stemming from PNA beacons hybridized with complementary target rRNAs was obtained from each sample using the CFS setup. Our results indicate that incubation at RT barely led to cell lysis and probe hybridization. However, similar fluorescence signal for both 65°C and 95°C temperatures indicated similar assay efficiency at these temperatures (Supp. Fig. 2). We used 65°C incubation for on chip experiments to avoid any problems associated with droplet evaporation and instability at high temperature incubation.
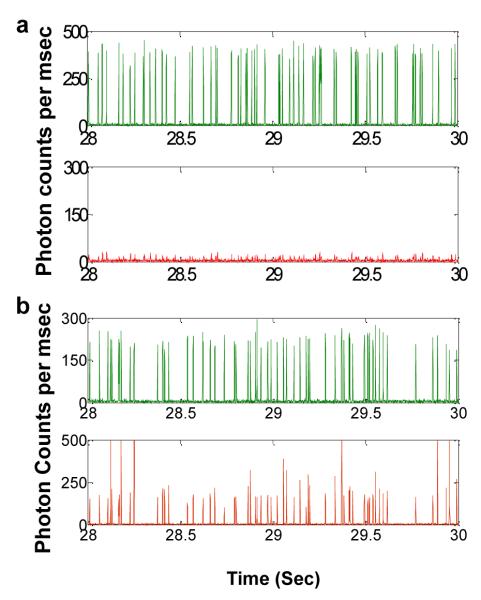
We then conducted tests with E. coli cell samples on our microfluidic chip (Fig. 2). As a first test to estimate the background fluorescence from the PNA beacon encapsulated within droplets, we generated droplets using a sample containing only PNA beacons without E. coli cells. Fig. 5a shows the fluorescence signal collected from a few representative droplets generated using this sample. As discussed in the experimental section, this sample contained an indicator dye (Alexa Fluor® 488) for easy visualization of droplets in the fluorescence data. The indicator dye is present in all the droplets regardless of presence or absence of PNA beacon or target cells. Hence, every droplet can be seen as a peak in the indicator dye fluorescence data (Green trace). The red trace in Fig. 5a shows fluorescence signal collected from the PNA beacon (i.e. Cy5 dye on the beacon). In Fig 5a, we observe a very small amount of PNA background fluorescence in the red trace that is associated with the intrinsic background of free PNA beacons resulting from stochastic opening of the beacons due to thermal fluctuations.
Fig 5.
Fluorescence data collected from droplets with and without E. coli cells. The green traces indicate the fluorescence signal collected from the indicator dye (Alexa 488) present in all droplets regardless of presence or absence of E. coli cells. Each peak in the green trace indicates a droplet passing through the detection region of the CFS setup. The corresponding time points in the red traces indicate the fluorescence signal collected from the PNA beacon present within the same droplet. a) The fluorescence data shown here corresponds to droplets generated using a control sample (PNA beacon only). b) The fluorescence data shown here corresponds to a high concentration E. coli sample. The estimated E. coli sample concentration for this sample was 15.7 CFU/droplet (CFU: Colony Forming Unit).
Fig. 5b indicates similar fluorescence data from a high concentration E. coli cell sample. A standard curve indicating the CFU/ml (CFU: Colony Forming Unit) concentration vs OD (Optical Density at 600nm) measurement was generated to estimate the CFU/ml concentration of an E. coli sample used for an experiment. In this case, the droplet size and the starting E. coli concentration lead to a concentration estimate of 15.7 CFU/droplet. Although the actual distribution of cells within the droplets is expected to be a Poisson distribution, on an average, we expect target 16S rRNA from at least one cell to be present in virtually all the droplets in this case. The fluorescence data collected from the droplets indeed indicates a strong rise in fluorescence from each droplet in the red trace i.e. PNA beacon trace, confirming our expectation.
Finally Fig. 6 illustrates the fluorescence data collected from the droplets generated using a sample containing low concentration of E. coli cells. The droplet size and initial E. coli concentration lead to a concentration estimate of 1 CFU per 20 droplets. In this case, we expect a large fraction of droplets to be empty with no target E. coli cells while a few droplets are expected to contain target E. coli cells. Thus, we expect digital fluorescence signal from these droplets i.e. a large number of droplets with weak background fluorescence from the PNA beacon with a few droplets showing strong fluorescence signal in the red trace. The trace in Fig. 6 indeed matches our expectation indicating the feasibility of using our approach to detect pathogens from a sample with intact pathogenic cells at single cell level.
Fig 6.
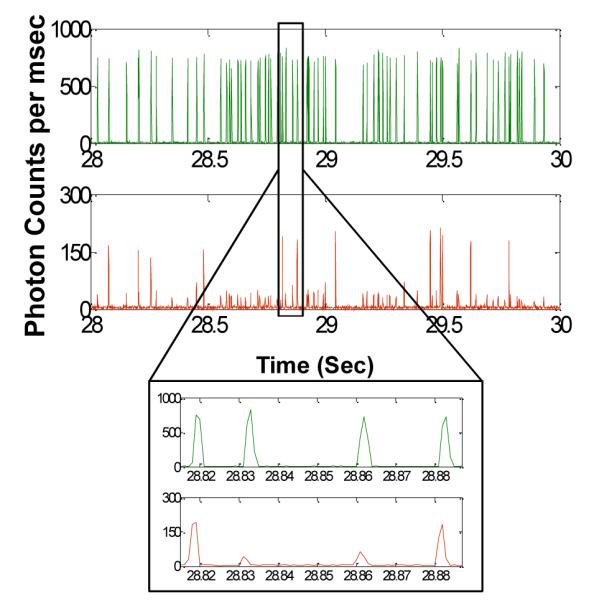
Fluorescence data collected from droplets generated using a low concentration E. coli sample. Similar to Fig. 5, the green trace shows fluorescence from the indicator dye while the red trace indicates the fluorescence from the PNA beacon encapsulated within the droplets. The E. coli concentration for this sample was estimated at 1 CFU per 20 droplets. In this case, we expect majority of droplets to have no E. coli cells with a few droplets having E. coli cells. The inset shows a zoom in of a small section of the fluorescence data trace
Conclusion
In conclusion, we proposed a novel scheme for sequence-specific detection of single cells using genetic biomarkers. We demonstrated the functioning of our platform with a 16S rRNA mimic target as well as intact E. coli cells as a model pathogen. The success of our experiments with a pathogen sample with intact pathogenic cells indicates the promise in utilization of our platform with clinical samples with appropriate testing and optimization of assay conditions. Although the functioning of the platform was demonstrated for pathogen detection, the platform is versatile enough to be applied towards other single cell studies.
Supplementary Material
ESI
Acknowledgements
The authors would like to thank DARPA (Micro/Nano Fluidics Fundamentals Focus Centre), NIH (R01CA155305, U54CA151838) and NSF (0967375, 0546012). The authors would also like to thank Raindance Technologies, Inc. for providing us with “EA” surfactant.
Footnotes
†
Electronic Supplementary Information (ESI) available: [details of any supplementary information available should be included here]. See DOI: 10.1039/b000000x/
Notes and references
- 1.Vogelstein B, Kinzler KW. Proc. Natl. Acad. Sci. U. S. A. 1999;96:9236–9241. doi: 10.1073/pnas.96.16.9236. [DOI] [PMC free article] [PubMed] [Google Scholar]
- 2.Ottesen EA, Hong JW, Quake SR, Leadbetter JR. Science. 2006;314:1464–1467. doi: 10.1126/science.1131370. DOI:10.1126/science.1131370. [DOI] [PubMed] [Google Scholar]
- 3.Lun FM, Chiu RW, Allen KC, Chan T, Leung Yeung, Lau T. Kin, Lo Y. M. Dennis. Clin. Chem. 2008;54:1664–1672. doi: 10.1373/clinchem.2008.111385. DOI:10.1373/clinchem.2008.111385. [DOI] [PubMed] [Google Scholar]
- 4.Hindson BJ, Ness KD, Masquelier DA, Belgrader P, Heredia NJ, Makarewicz AJ, Bright IJ, Lucero MY, Hiddessen AL, Legler TC, Kitano TK, Hodel MR, Petersen JF, Wyatt PW, Steenblock ER, Shah PH, Bousse LJ, Troup CB, Mellen JC, Wittmann DK, Erndt NG, Cauley TH, Koehler RT, So AP, Dube S, Rose KA, Montesclaros L, Wang S, Stumbo DP, Hodges SP, Romine S, Milanovich FP, White HE, Regan JF, Karlin-Neumann GA, Hindson CM, Saxonov S, Colston BW. Anal. Chem. 2011;83:8604–8610. doi: 10.1021/ac202028g. DOI:10.1021/ac202028g. [DOI] [PMC free article] [PubMed] [Google Scholar]
- 5.Huebner A, Srisa-Art M, Holt D, Abell C, Hollfelder F, deMello AJ, Edel JB. Chem. Commun. (Camb) 2007;(12):1218–1220. doi: 10.1039/b618570c. DOI:10.1039/b618570c. [DOI] [PubMed] [Google Scholar]
- 6.Joensson HN, Samuels ML, Brouzes ER, Medkova M, Uhlen M, Link DR, Andersson-Svahn H. Angew. Chem. Int. Ed Engl. 2009;48:2518–2521. doi: 10.1002/anie.200804326. DOI:10.1002/anie.200804326. [DOI] [PubMed] [Google Scholar]
- 7.Boedicker JQ, Li L, Kline TR, Ismagilov RF. Lab. Chip. 2008;8:1265–1272. doi: 10.1039/b804911d. DOI:10.1039/b804911d. [DOI] [PMC free article] [PubMed] [Google Scholar]
- 8.Brouzes E, Medkova M, Savenelli N, Marran D, Twardowski M, Hutchison JB, Rothberg JM, Link DR, Perrimon N, Samuels ML. Proc. Natl. Acad. Sci. U. S. A. 2009;106:14195–14200. doi: 10.1073/pnas.0903542106. DOI:10.1073/pnas.0903542106. [DOI] [PMC free article] [PubMed] [Google Scholar]
- 9.Zeng Y, Novak R, Shuga J, Smith MT, Mathies RA. Anal. Chem. 2010;82:3183–3190. doi: 10.1021/ac902683t. DOI:10.1021/ac902683t. [DOI] [PMC free article] [PubMed] [Google Scholar]
- 10.Baret JC, Miller OJ, Taly V, Ryckelynck M, El-Harrak A, Frenz L, Rick C, Samuels ML, Hutchison JB, Agresti JJ, Link DR, Weitz DA, Griffiths AD. Lab. Chip. 2009;9:1850–1858. doi: 10.1039/b902504a. DOI:10.1039/b902504a. [DOI] [PubMed] [Google Scholar]
- 11.Clausell-Tormos J, Lieber D, Baret JC, El-Harrak A, Miller OJ, Frenz L, Blouwolff J, Humphry KJ, Koster S, Duan H, Holtze C, Weitz DA, Griffiths AD, Merten CA. Chem. Biol. 2008;15:427–437. doi: 10.1016/j.chembiol.2008.04.004. DOI:10.1016/j.chembiol.2008.04.004. [DOI] [PubMed] [Google Scholar]
- 12.Koster S, Angile FE, Duan H, Agresti JJ, Wintner A, Schmitz C, Rowat AC, Merten CA, Pisignano D, Griffiths AD, Weitz DA. Lab. Chip. 2008;8:1110–1115. doi: 10.1039/b802941e. DOI:10.1039/b802941e. [DOI] [PubMed] [Google Scholar]
- 13.Shim JU, Olguin LF, Whyte G, Scott D, Babtie A, Abell C, Huck WT, Hollfelder F. J. Am. Chem. Soc. 2009;131:15251–15256. doi: 10.1021/ja904823z. DOI:10.1021/ja904823z. [DOI] [PubMed] [Google Scholar]
- 14.Puleo CM, Yeh HC, Liu KJ, Wang TH. Lab. Chip. 2008;8:822–825. doi: 10.1039/b717941c. DOI:10.1039/b717941c. [DOI] [PubMed] [Google Scholar]
- 15.Rane TD, Puleo CM, Liu KJ, Zhang Y, Lee AP, Wang TH. Lab. Chip. 2010;10:161–164. doi: 10.1039/b917503b. DOI:10.1039/b917503b. [DOI] [PMC free article] [PubMed] [Google Scholar]
- 16.Lane DJ, Pace B, Olsen GJ, Stahl DA, Sogin ML, Pace NR. Proc. Natl. Acad. Sci. U. S. A. 1985;82:6955–6959. doi: 10.1073/pnas.82.20.6955. [DOI] [PMC free article] [PubMed] [Google Scholar]
- 17.Fuhrman JA, Davis AA. Mar. Ecol. Prog. Ser. 1997;150:275–285. [Google Scholar]
- 18.Ludwig W, Schleifer KH. FEMS Microbiol. Rev. 1994;15:155–173. doi: 10.1111/j.1574-6976.1994.tb00132.x. [DOI] [PubMed] [Google Scholar]
- 19.Zwirglmaier K, Ludwig W, Schleifer KH. Mol. Microbiol. 2004;51:89–96. doi: 10.1046/j.1365-2958.2003.03834.x. [DOI] [PubMed] [Google Scholar]
- 20.Wang TH, Peng Y, Zhang C, Wong PK, Ho CM. J. Am. Chem. Soc. 2005;127:5354–5359. doi: 10.1021/ja042642i. DOI:10.1021/ja042642i. [DOI] [PubMed] [Google Scholar]
- 21.Liu KJ, Wang TH. Biophys. J. 2008;95:2964–2975. doi: 10.1529/biophysj.108.132472. DOI:10.1529/biophysj.108.132472. [DOI] [PMC free article] [PubMed] [Google Scholar]
- 22.Teh SY, Lin R, Hung LH, Lee AP. Lab. Chip. 2008;8:198–220. doi: 10.1039/b715524g. DOI:10.1039/b715524g. [DOI] [PubMed] [Google Scholar]
- 23.Tyagi S, Kramer FR. Nat. Biotechnol. 1996;14:303–308. doi: 10.1038/nbt0396-303. DOI:10.1038/nbt0396-303. [DOI] [PubMed] [Google Scholar]
- 24.Tyagi S, Kramer FR. Nat. Biotechnol. 1996;14:303–308. doi: 10.1038/nbt0396-303. DOI:10.1038/nbt0396-303. [DOI] [PubMed] [Google Scholar]
- 25.Zhang CY, Chao SY, Wang TH. Analyst. 2005;130:483–488. doi: 10.1039/b415758c. DOI:10.1039/b415758c. [DOI] [PubMed] [Google Scholar]
- 26.Xi C, Balberg M, Boppart SA, Raskin L. Appl. Environ. Microbiol. 2003;69:5673–5678. doi: 10.1128/AEM.69.9.5673-5678.2003. [DOI] [PMC free article] [PubMed] [Google Scholar]
- 27.Yang J, Liu Y, Rauch CB, Stevens RL, Liu RH, Lenigk R, Grodzinski P. Lab. Chip. 2002;2:179–187. doi: 10.1039/b208405h. DOI:10.1039/b208405h. [DOI] [PubMed] [Google Scholar]
- 28.Waters LC, Jacobson SC, Kroutchinina N, Khandurina J, Foote RS, Ramsey JM. Anal. Chem. 1998;70:158–162. doi: 10.1021/ac970642d. [DOI] [PubMed] [Google Scholar]
- 29.Wilding P, Kricka LJ, Cheng J, Hvichia G, Shoffner MA, Fortina P. Anal. Biochem. 1998;257:95–100. doi: 10.1006/abio.1997.2530. DOI:10.1006/abio.1997.2530. [DOI] [PubMed] [Google Scholar]
- 30.Lee WC, Lien KY, Lee GB, Lei HY. Diagn. Microbiol. Infect. Dis. 2008;60:51–58. doi: 10.1016/j.diagmicrobio.2007.07.010. DOI:10.1016/j.diagmicrobio.2007.07.010. [DOI] [PubMed] [Google Scholar]
- 31.Brosius J, Palmer ML, Kennedy PJ, Noller HF. Proc. Natl. Acad. Sci. U. S. A. 1978;75:4801–4805. doi: 10.1073/pnas.75.10.4801. [DOI] [PMC free article] [PubMed] [Google Scholar]
- 32.Liu KJ, Wang TH. Biophys. J. 2008;95:2964–2975. doi: 10.1529/biophysj.108.132472. DOI:10.1529/biophysj.108.132472. [DOI] [PMC free article] [PubMed] [Google Scholar]
- 33.Clausell-Tormos J, Lieber D, Baret JC, El-Harrak A, Miller OJ, Frenz L, Blouwolff J, Humphry KJ, Koster S, Duan H, Holtze C, Weitz DA, Griffiths AD, Merten CA. Chem. Biol. 2008;15:427–437. doi: 10.1016/j.chembiol.2008.04.004. DOI:10.1016/j.chembiol.2008.04.004. [DOI] [PubMed] [Google Scholar]
Associated Data
This section collects any data citations, data availability statements, or supplementary materials included in this article.
Supplementary Materials
ESI
