Autophagy Fails to Alter Withaferin A-Mediated Lethality in Human Breast Cancer Cells (original) (raw)
. Author manuscript; available in PMC: 2014 Jul 1.
Published in final edited form as: Curr Cancer Drug Targets. 2013 Jul;13(6):640–650. doi: 10.2174/15680096113139990039
Abstract
We have shown previously that withaferin A (WA), which is a highly promising anticancer constituent of Ayurvedic medicine plant Withania somnifera, inhibits viability of cultured breast cancer cells in association with reactive oxygen species (ROS)-dependent apoptosis induction. Because ROS production is implicated in induction of autophagy, which is an evolutionary conserved process for bulk degradation of cellular components including organelles (e.g., mitochondria) and considered a valid cancer chemotherapeutic target, we questioned whether WA treatment resulted in autophagy induction. Indeed exposure of MDA-MB-231 and MCF-7 human breast cancer cells as well as a spontaneously immortalized and non-tumorigenic normal human mammary epithelial cell line (MCF-10A) to pharmacologic concentration of WA resulted in autophagy as evidenced by transmission electron microscopy, cleavage of microtubule-associated protein 1 light chain 3 isoform B (LC3B-II), and/or acridine orange staining. Inhibition of MDA-MB-231 xenograft growth in vivo by WA administration was also associated with a significant increase in level of total LC3 protein in the tumor. However, WA-mediated inhibition of MDA-MB-231 and MCF-7 cell viability was not compromised either by pharmacological suppression of autophagy using 3-methyl adenine or genetic repression of autophagy by RNA interference of Atg5, a critical component of the autophagic machinery. Finally, Beclin1 was dispensable for WA-mediated autophagy as well as inhibition of MDA-MB-231 cell viability. Based on these observations we conclude that autophagy induction fails to have any meaningful impact on WA-mediated lethality in breast cancer cells, which may be a therapeutic advantage because autophagy serves to protect against apoptosis by several anticancer agents.
Keywords: Withaferin A, Breast Cancer, MDA-MB-231, MCF-7, Autophagy, Atg5, Beclin1
INTRODUCTION
Constituents of traditional Indian medicine (also known as Ayurvedic medicine), which has been practiced for centuries in India for the treatment of different ailments, continue to gain interest for discovery of novel cancer chemotherapeutic and chemopreventive agents [1–3]. Withania somnifera (commonly known as Ashwagandha or Indian winter cherry) is one such plant that exhibits a variety of pharmacological effects, including anticancer activity in experimental animals. For example, intraperitoneal administration of Ashwagandha not only inhibited growth of transplanted sarcoma-180 but also resulted in radiosensitization in mice [4]. Local injections of leaf extract of Ashwagandha every third day to the tumor sites resulted in growth retardation of HT1080 human fibrosarcoma subcutaneously implanted in athymic mice [5]. Dietary administration of Withania somnifera root caused inhibition of Phase I enzymes and induction of Phase II carcinogen-inactivating enzymes (e.g., glutathione transferase) in mice [6]. In a long-term tumorigenesis bioassay, Withania somnifera root administered in the diet inhibited benzo[a]pyrene-induced forestomach tumor incidence and multiplicity by about 60 and 92%, respectively [6]. Methanol extract of Withania somnifera root offered significant protection against metastasis by B16F-10 melanoma [7]. Fractions derived from chloroform extract of Withania somnifera inhibited vascular endothelial growth factor-induced angiogenesis in mice [8]. Other pharmacological effects of Withania somnifera in experimental rodents include cardioprotection from ischemia reperfusion injury [9], inhibition of 6-hydroxydopamine-induced Parkinsonism [10], suppression of hepatic lipid peroxidation concomitant with an increase in activity of antioxidant enzymes [11], and antibacterial and immunomodulatory effects [12, 13].
Anticancer effect of Withania somnifera is attributed to withanolides, including withaferin A (WA) [14–18]. For example, WA was shown to cause destruction of ehrlich ascites tumor cells in vivo by immune activation [14]. Treatment of B16F1 mouse melanoma bearing mice with 10–60 mg/kg WA intraperitoneally produced a dose dependent increase in growth delay and volume doubling time [15]. Oral administration of WA (20 mg/kg body weight) for 14 weeks completely prevented 7,12-dimethylbenz[a]anthracene-induced oral carcinogenesis in Syrian golden hamsters [16]. The WA-mediated growth inhibition of human cancer cells implanted in athymic mice has also been documented [17, 18]. For example, the growth of MDA-MB-231 human breast cancer cells implanted in female nude mice was retarded significantly by i.p. injections of 4 mg WA/kg body weight five times per week in association with reduced cell proliferation and increased apoptosis [17]. Intra-tumor injection of WA retarded growth of PC-3 human prostate cancer xenografts in athymic mice by causing apoptosis, which was associated with up-regulation of pro-apoptotic protein Par-4 [18]. WA inhibited breast cancer invasion and metastasis in vivo [19].
The mechanism by which WA treatment causes apoptosis in cancer cells is not fully understood, but reactive oxygen species (ROS) production is intimately linked to cell death by this agent in human breast, melanoma, and renal cancer cells [20–23]. Because ROS production is implicated in induction of autophagy [24], which is an evolutionary conserved process for bulk degradation of cellular components including organelles (e.g., mitochondria) and considered a valid cancer chemotherapeutic target [25], we questioned whether growth suppressive effect of WA was associated with autophagic cell death. The present study systematically addresses this question using cultured MDA-MB-231 (estrogen-independent, mutant p53) and MCF-7 cells (estrogen-responsive, wild-type p53) human breast cancer cells, a spontaneously immortalized and non-tumorigenic normal human mammary epithelial cell line (MCF-10A), and MDA-MB-231 xenografts from control and WA-treated female athymic mice.
MATERIALS AND METHODS
Reagents
WA (purity ≥ 99%) was purchased from Enzo Life Sciences (Farmingdale, NY), whereas 3-methyl adenine (3-MA), acridine orange, and anti-actin antibody were from Sigma-Aldrich (St. Louis, MO). Cell culture reagents and OligoFECTAMINE were purchased from Invitrogen-Life Technologies (Carlsbad, CA). An antibody specific form detection of cleaved microtubule-associated protein 1 light chain form B (LC3B-II) for immunoblotting, and anti-Atg5 (this antibody reacts with both Atg5–12 conjugate as well as free Atg5) and anti-Beclin1 antibodies were purchased from Cell Signaling Technology (Danvers, MA). An antibody against total LC3 (this antibody does not distinguish the three isoforms of LC3, i.e., LC3A, LC3B, and LC3C) for immunohistochemistry and an antibody against poly-(ADP-ribose)-polymerase (PARP) were purchased from Santa Cruz Biotechnology (Santa Cruz, CA). Antibody against total LC3 used for immunofluorescence microscopy was purchased from MBL International (Woburn, MA).
Cell Lines
MDA-MB-231 and MCF-7 human breast cancer cells as well as a spontaneously immortalized and non-tumorigenic normal human mammary epithelial cell line (MCF-10A) were purchased from the American Type Culture Collection (Manassas, VA) and cultured as described by us previously [26]. Authentication of these cells was contracted to Research Animal Diagnostic Laboratory (University of Missouri, Columbia, MO). Cells were last tested in February of 2011. Each cell line was found to be of human origin and genetic profiles for these cells were consistent with those in the American Type Culture Collection database. Cultures were maintained in an atmosphere of 5% CO2 and 95% air at 37°C.
Transmission Electron Microscopy
Ultrastructure of control and WA-treated cells to visualize autophagosome-like structures was determined by transmission electron microscopy as described by us previously [27, 28]. Stock solution of WA was prepared in dimethyl sulfoxide (DMSO) and diluted with complete medium. An equal volume of DMSO (final concentration 0.01%) was added to control. Cells were treated with dimethyl sulfoxide (DMSO) or 2 µM WA for 12 hours. Ultrathin (60 nm) sections were collected on 200 mesh copper grids, stained with 2% uranyl acetate in 50% methanol for 10 minutes, and then stained in 1% lead citrate for 7 minutes. Sections were imaged under a JEOL JEM 1011 transmission electron microscope (Peabody, MA) at 80 kV fitted with a side-mount AMT 2k digital camera (Advanced Microscopy Techniques, Danvers, MA).
Immunofluorescence Microscopy for LC3 Localization
Cells (1×10⁵) were seeded on coverslips in 12-well plates, allowed to attach by overnight incubation, and then exposed to DMSO or 2 µM WA for 6 or 12 hours. Cells were fixed with 2% paraformaldehyde for 1 hour at room temperature, and permeabilized with 0.1% Triton X-100 for 10 minutes. Cells were then incubated with a solution containing phosphate-buffered saline (PBS), 0.5% bovine serum albumin, and 0.15% glycine for 1 hour followed by overnight incubation with anti-LC3 antibody (this antibody does not differentiate LC3 isoforms) at 4°C. Cells were treated with 2 µg/mL Alexa Fluor 488-conjugated secondary antibody (Molecular Probes, Carlsbad, CA) for 1 hour at room temperature. After washing with PBS, cells were mounted and observed under a Leica DC300F fluorescence microscope at 100× objective lens magnification.
Western blotting
Cells were treated with DMSO or 2 µM WA and lysed as described by us previously [29]. After centrifugation of whole cell extract at 14,000 rpm for 30 minutes, supernatant proteins were resolved by sodium-dodecyl sulfate polyacrylamide gel electrophoresis and transferred onto polyvinylidene fluoride membrane. After blocking with 5% non-fat dry milk in Tris-buffered saline containing 0.05% Tween-20, the membrane was treated with the desired primary antibody for 2 hour at room temperature or overnight at 4°C. The antibody used recognizes both full-length and cleaved forms of LC3B (LC3B-I at 16 kDa and LC3B-II at 14 kDa, respectively). Immunoreactive bands were detected with the use of enhanced Chemiluminescence reagent. Each membrane was stripped and re-probed with anti-actin antibody to normalize for differences in protein loading.
Acridine Orange Staining
Cells (1×10⁵) were seeded on coverslips, allowed to attach by overnight incubation, and then exposed to DMSO (control) or 2 µM WA for 6 or 12 hours at 37°C. Subsequently, cells were stained with 1 µg/mL acridine orange for 15 minutes, washed with PBS, and examined under fluorescence microscope at 100× objective magnification.
Immunohistochemistry
MDA-MB-231 tumor xenografts from control and WA-treated mice [17] were immunostained with LC3 antibody as described by us previously [28]. Seven tumor specimens from mice of each group were used. Multiple non-overlapping representative images from each section were captured using Image ProPlus 5.0 software (Media Cybernetics, Inc., Bethesda, MD). Quantitation of LC3 expression was done using positive pixel v9.1 algorithm of Aperio Image Scope software (Aperio Technologies, Inc., Vista, CA). This software automatically counts blue-negative and brown-positive staining and categorizes them according to intensity (0, 1+, 2+ or 3+). Results are computed as H-score.
Determination of Cell Viability
Cell viability was determined by trypan blue dye exclusion assay as described by us previously [30]. Briefly, cells were seeded at a density of 1×10⁵ cells/well in 12-well plates, allowed to attach overnight, and then treated with DMSO or WA. In some experiments, cells were pretreated with 4 mM 3-MA for 2 hours and then exposed to DMSO or WA in the absence or presence of 3-MA for indicated times. In small interfering RNA (siRNA) experiments, 5×10⁴ cells were plated into 12-well plates, allowed to attach overnight, and transiently transfected with siRNAs for 24 hours using OligoFECTAMINE. After treatment with DMSO or WA, cells trypsinized and treated with trypan blue solution. Viable cells were counted using a hemocytometer.
RNA Interference
Cells were seeded in six-well plates and transfected at 50% confluency with a control (non-specific) siRNA (QIAGEN, Valencia, CA) or Atg5-targeted (Santa Cruz Biotechnology) or Beclin1-targeted siRNA (Santa Cruz Biotechnology). Twenty-four hours after transfection, the cells were treated with DMSO (control) or specified concentration of withaferin A for 24 h. The cells were then collected and processed for immunoblotting and cell viability.
RESULTS
WA Treatment Caused Autophagy in Breast Cancer Cells
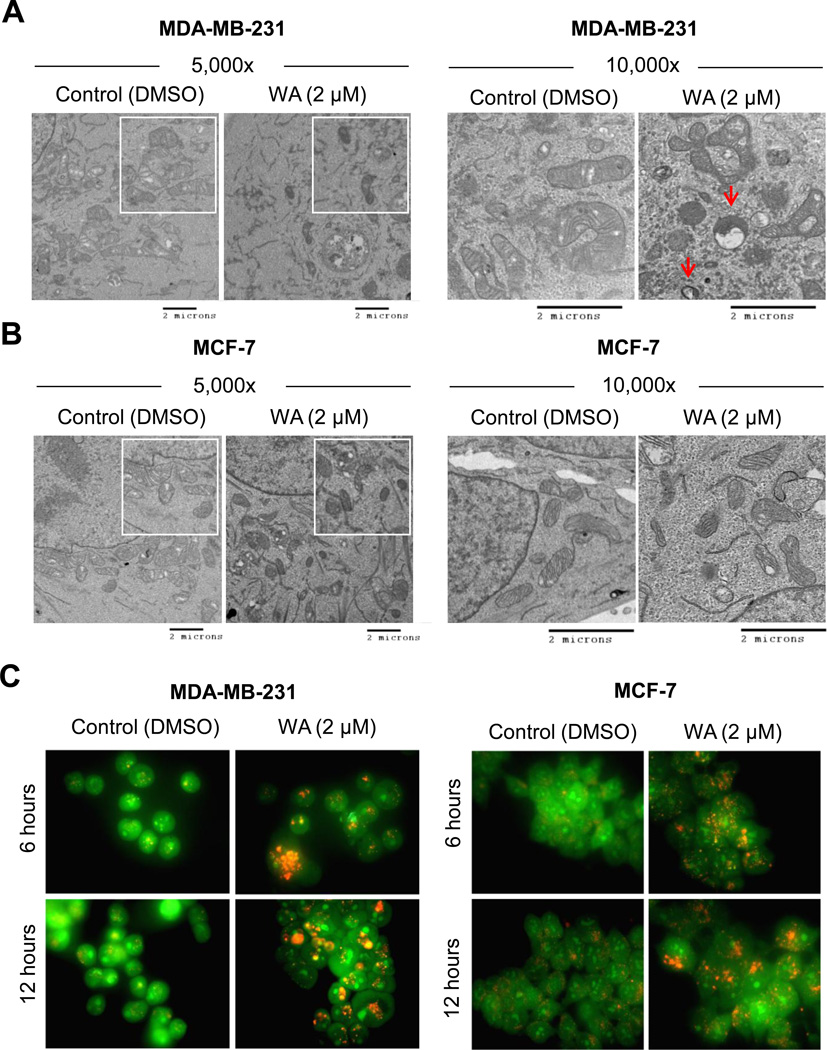
A recent pharmacokinetic study in mice indicated that peak plasma achievable concentration of WA is about 2 µM [19]. We used the same concentration of WA in the present study to determine its autophagic response. Fig. 1A depicts representative transmission electron microscopic images of MDA-MB-231 cells following 12-hour treatment with DMSO or 2 µM WA at two different magnifications. Mitochondria in DMSO-treated control MDA-MB-231cells mostly appeared normal with intact cristae structure. Exposure of MDA-MB-231 (Fig. 1A) and MCF-7 cells (Fig. 1B) to 2 µM WA resulted in appearance of vacuoles resembling autophagosome-like structures (identified by red arrows in Fig. 1A), which were much less frequent in DMSO-treated control cells. Autophagic response to WA was confirmed by analysis of acidic vesicular organelles (AVOs), and cleavage and recruitment to autophagosomes of LC3B, which are hallmarks of autophagy [31–33]. AVOs were visualized by fluorescence microscopy following staining with the lysosomotropic agent acridine orange. Acridine orange is a weak base that is able to move freely across biological membranes in an uncharged state, which is characterized by green fluorescence. The protonated form of acridine orange accumulates in acidic compartments and forms aggregates, which is characterized by yellow-orange fluorescence. As can be seen in Fig. 1C, DMSO-treated control MDA-MB-231 and MCF-7 cells primarily exhibited green fluorescence indicating lack of AVOs. Treatment of MDA-MB-231 and MCF-7 cells for 6 or 12 hours with WA resulted in formation of yellow-orange AVOs (Fig. 1C).
Fig. (1). Withaferin A treatment caused autophagy in human breast cancer cells.
Effect of WA treatment (12 hour) on ultrastructure (enlarged in inset) of MDA-MB-231 (A) and MCF-7 (B) cells at the indicated magnifications (scale bar, 2 microns). Autophagosome-like structures are identified by red arrows. C, Representative images depicting acridine orange staining in MDA-MB-231 and MCF-7 cells treated with DMSO or 2 µM of WA for the specified time periods. Consistent results were obtained from independent experiments.
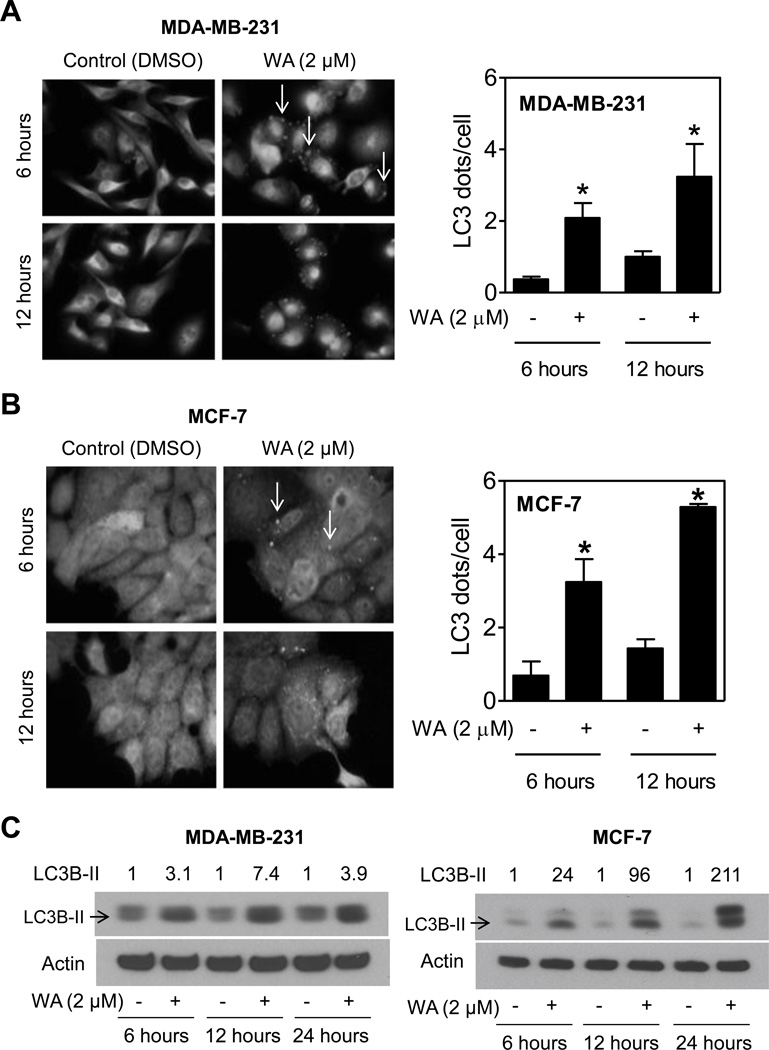
During autophagy LC3B (16 kDa) is cleaved to a 14 kDa intermediate (referred to as LC3B-II) that localizes to the autophagosomes [32, 33]. Cleavage and recruitment of LC3B to autophagosomes is characterized by punctate staining [33]. Staining for LC3 was diffuse in DMSO-treated control MDA-MB-231 (Fig. 2A) and MCF-7 cells (Fig. 2B). On the other hand, WA-treated MDA-MB-231 (Fig. 2A) and MCF-7 cells (Fig. 2B) displayed punctate pattern of LC3 staining (marked by arrows in Fig. 2A,B). Quantitation of LC3 dots/cell indicated significantly higher count in WA-treated MDA-MB-231 and MCF-7 cells compared with corresponding DMSO-treated control. For example, number of LC3 dots/cells was increased by about 4.7- and 3.7-fold upon treatment of MCF-7 cells with 2 µM WA for 6- and 12-hours, respectively (Fig. 2B). Consistent with these results, WA treatment caused a marked increase in levels of cleaved LC3B (LC3B-II) in a time-dependent manner in both MDA-MB-231 and MCF-7 cells (Fig. 2C). In addition, the level of full-length LC3B was also increased upon treatment with WA, but this response was relatively more pronounced in MCF-7 cells than in the MDA-MB-231 cell line. Collectively, these results provided evidence for WA-induced autophagy in breast cancer cells.
Fig. (2). Withaferin A treatment caused LC3 cleavage in human breast cancer cells.
Representative immunofluorescence images and quantitation for LC3 puncta (indicated by the white arrow) from MDA-MB-231 (A) and MCF-7 (B) cells treated with DMSO (control) or 2 µM of WA for specified time periods (100×objective magnification). Results shown are mean ± SD (n=3). *Statistical significance of difference (P<0.05) was analyzed by a two-sided student’s t-test. (C) Immunoblotting for LC3B-I and LC3B-II (cleaved form identified by an arrow) using lysates from MDA-MB-231 (left panel) and MCF-7 (right panel) cells treated with DMSO (control) or 2 µM of WA for specified time periods. Numbers on the top of bands represent the relative expression compared to corresponding DMSO-treated control. All the experiments were done at least twice, and consistent results were observed.
Induction of Autophagy by WA Treatment in MCF-10A Cells
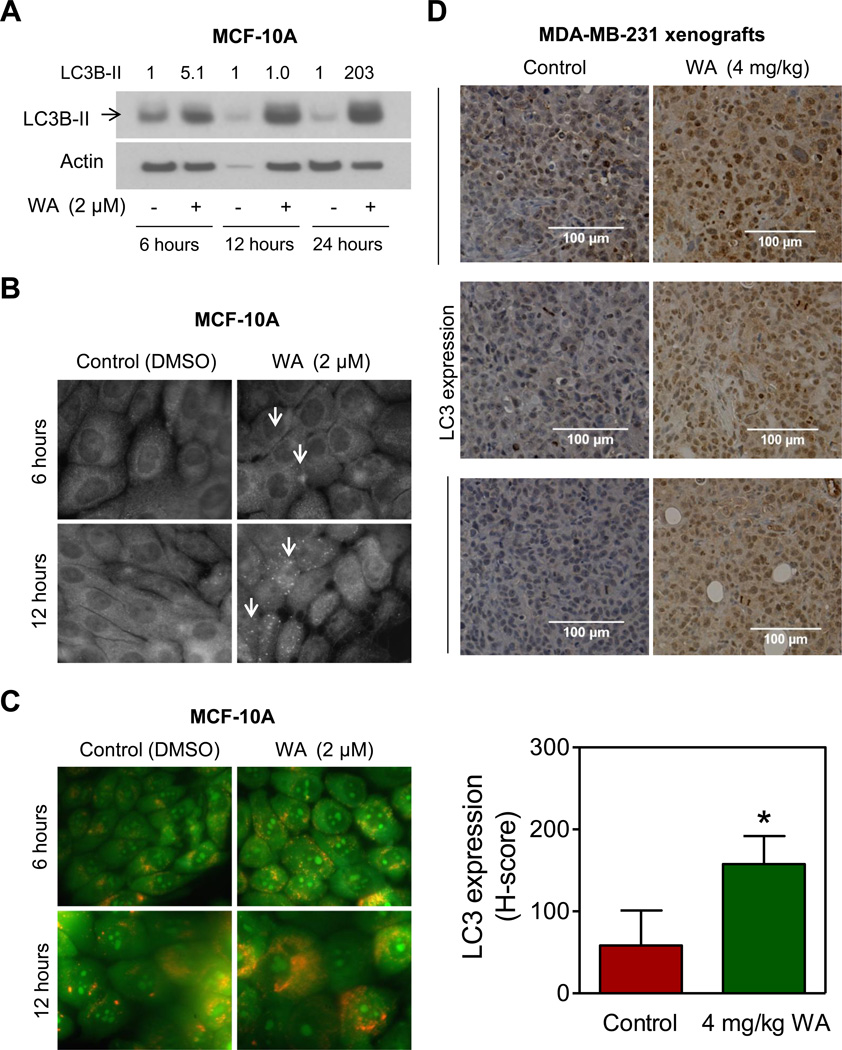
We used MCF-10A cell line, which was originally isolated from a fibrocystic breast disease and spontaneously immortalized, to determine if WA-induced autophagy was selective for cancerous breast cells. The MCF-10A cell line is non-tumorigenic in athymic mice and a widely used representative of normal human mammary epithelial cells. As can be seen in Fig. 3A, exposure of MCF-10A cells to 2 µM WA resulted in cleavage of LC3 as evidenced by western blotting. The level of LC3B was increased by 34–128-fold upon treatment of MCF-10A cells with WA compared with DMSO-treated controls. Consistent with these results, WA treatment resulted in punctate appearance of LC3 staining (identified by arrows in Fig. 3B) as well as formation of yellow-orange AVOs (Fig. 3C). These results indicated that WA-induced autophagy was not selective for cancer cells.
Fig. (3). Withaferin A treatment caused autophagy in MCF-10A normal human mammary cells.
A, Immunoblotting for LC3B-I and LC3B-II (cleaved form identified by an arrow) using lysates from MCF-10A cells treated with DMSO (control) or 2 µM of WA for specified time periods. Numbers on the top of bands represent the relative expression level compared to corresponding DMSO-treated control. B, Representative images for LC3 localization in MCF-10A cells treated for specified time periods with DMSO or 2 µM of WA. LC3 puncta are indicated by arrows (100×objective magnification). C, Representative images depicting acridine orange staining in MCF-10A cells treated with DMSO or 2 µM of WA for specified time periods. D, Representative immunohistochemical images and quantitative analysis for LC3 expression from MDA-MB-231 xenografts from control or 4 mg/kg WA-treated mice (magnification 200×, Scale bar 100 µm). Results are presented as mean H-score ± SD (n=7). *Statistical significance of difference between groups (P<0.05) was analyzed by a two-sided student’s t-test. All the experiments were repeated with similar results.
WA Administration Increased Expression of LC3 protein in MDA-MB-231 Xenografts
We have shown previously that WA administration retards growth of MDA-MB-231 xenografts in female athymic mice [17]. We used archived tumor tissues from the same study to determine the effect of WA treatment on expression of LC3, which was increased in WA-treated cells (Fig. 2C). Expression of LC3 was significantly higher in MDA-MB-231 xenografts from WA-treated mice in comparison with control. These results provided in vivo evidence for WA-mediated induction of LC3 in MDA-MB-231 xenografts.
Effect of 3-MA on WA-Mediated Inhibition of Breast Cancer Cell Viability
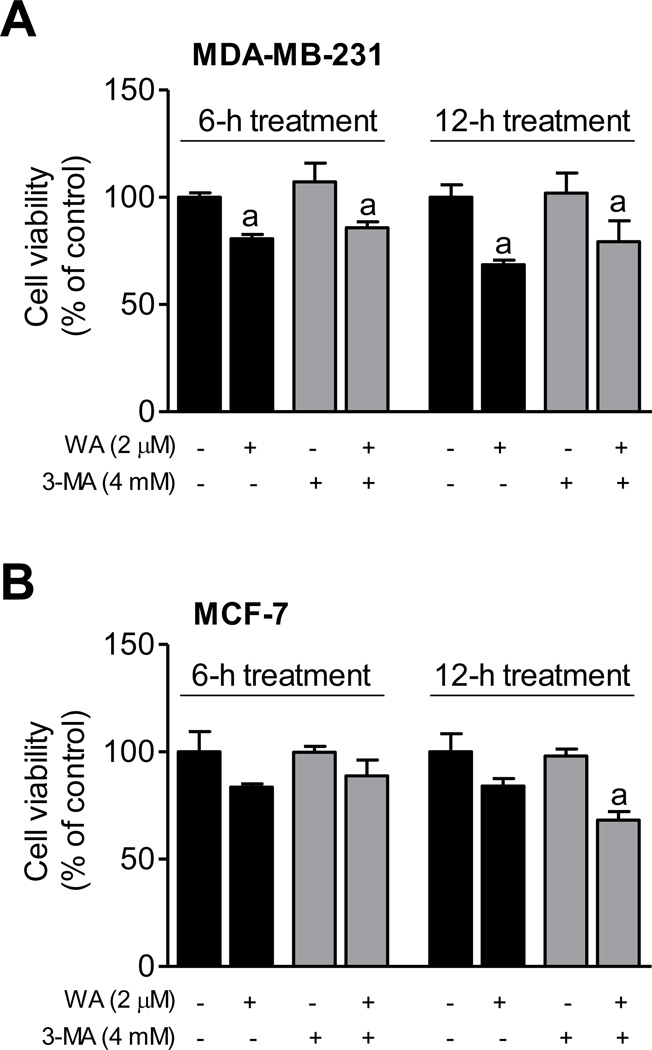
We proceeded to test whether autophagy induction by WA altered its growth inhibitory effect in breast cancer cells using 3-MA, which is an inhibitor of phosphatidylinositol 3 kinase. Cells were first pre-treated for 2 hours with 4 mM 3-MA and then exposed to 2 µM WA for 6 or 12 hours in the presence or absence of the inhibitor prior to trypan blue dye exclusion assay. Because of cell detachment consistent with apoptosis commitment at 24 hours, these experiments were carried at time points where apoptosis is much less prominent. The inhibitor concentration was optimized based on lack of cellular toxicity and inhibition of LC3 cleavage (data not shown). Viability of MDA-MB-231 cells was reduced by 19–32% upon 6- and 12-hour treatment with WA compared with DMSO-treated control (Fig. 4A). The 3-MA alone did not have any appreciable effect on MDA-MB-231 cell viability. Moreover, the WA-mediated inhibition of MDA-MB-231 (Fig. 4A) or MCF-7 cell viability (Fig. 4B) was not affected by 3-MA. These results suggested that autophagy induction may not alter growth inhibitory effect of WA.
Fig. (4). Autophagy inhibition by 3-methyl adenine (3-MA) did not influence WA-mediated inhibition of cell viability.
Effect of 3-MA treatment on WA-mediated growth inhibition of MDA-MB-231 (A) and MCF-7 (B) cells. Cells were pretreated with 4 mM 3-MA for 2 hours and then exposed to DMSO or 2 µM of WA for 6 or 12 hours. Cell viability was determined by trypan blue dye exclusion assay. Results are presented as mean ± SD (n=3). aSignificantly different (P<0.05) compared with DMSO-treated control by one way ANOVA followed by Bonferroni’s multiple comparison test. Similar results were obtained from replicate experiments.
Effect of Atg5 Knockdown on WA-Mediated Autophagy Induction and Growth Inhibition
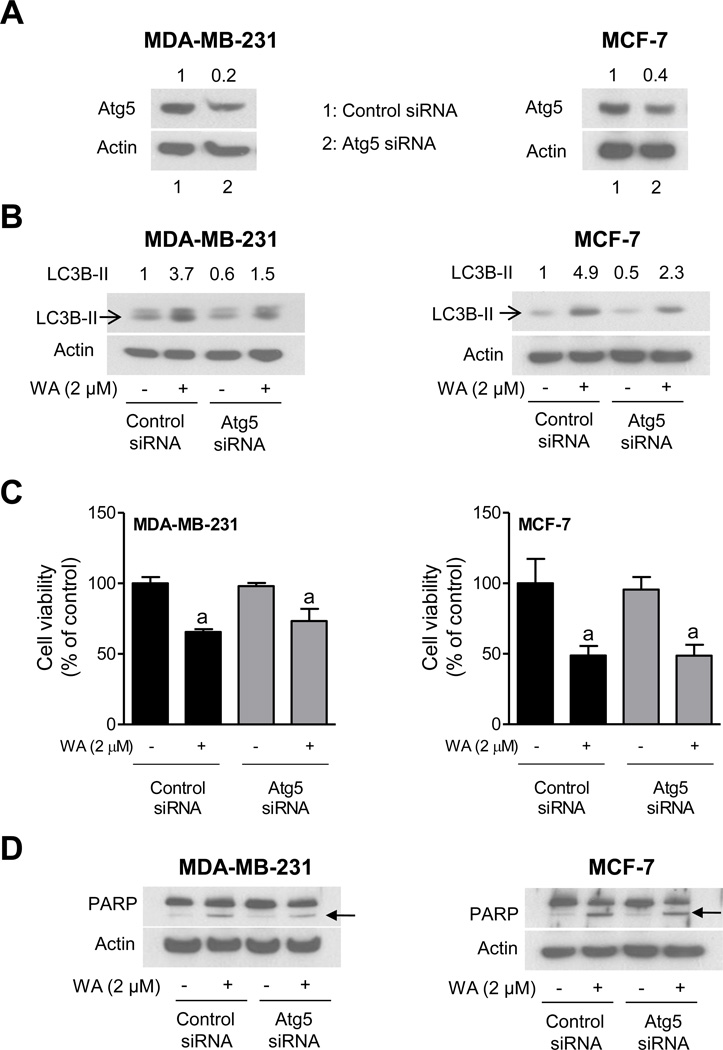
RNA interference of a critical autophagy-related protein (Atg5–12) was performed to confirm the results using 3-MA. As shown in Fig. 5A, the level of Atg5–12 protein was decreased by 60–80% upon transient transfection of MCF-7 and MDA-MB-231 cells with Atg5-targeted siRNA compared with control siRNA-transfected cells. The WA-mediated increase in level of LC3B protein (cleaved LC3) was much more pronounced in the control siRNA-transfected cells than in cells transfected with the Atg5-targeted siRNA (Fig. 5B). In agreement with results using 3-MA, inhibition of cell viability resulting from WA exposure was more or less similar in cells transfected with the control siRNA and Atg5-targeted siRNA (Fig. 5C). In addition, WA-mediated cleavage of PARP (an indicator of apoptosis) was observed in both control siRNA transfected and Atg5 knockdown cells (Fig. 5D). These results indicated that the knockdown of Atg5–12 protein did not have any meaningful impact on WA-mediated decrease in cell viability or PARP cleavage.
Fig. (5). RNA interference of ATG5 did not affect WA-mediated inhibition of cell viability.
A, Immunoblot for Atg5–12 using lysates from MDA-MB-231 and MCF-7 cells transiently transfected with a control siRNA- or Atg5-specific siRNA. B, Immunoblot for LC3B using lysates from MDA-MB-231 and MCF-7 cells transiently transfected with a control siRNA or Atg5-targeted siRNA and treated for 12 hours with DMSO or 2 µM of WA. C, Viability of MDA-MB-231 and MCF-7 cells transiently transfected with a control siRNA or Atg5-targeted siRNA and treated for 12 hours with DMSO or 2 µM of WA. Cell viability was determined by trypan blue dye exclusion assay. Results are shown as mean ± SD (n=3). aSignificantly different (P<0.05) compared with DMSO-treated control by one way ANOVA followed by Bonferroni’s multiple comparison test. D, Immunoblot for PARP using lysates from MDA-MB-231 and MCF-7 cells transiently transfected with a control siRNA or Atg5-targeted siRNA and treated for 12 hours with DMSO or 2 µM of WA. Similar results were obtained from replicate experiments.
Beclin1 is Dispensable for WA-Mediated Autophagy
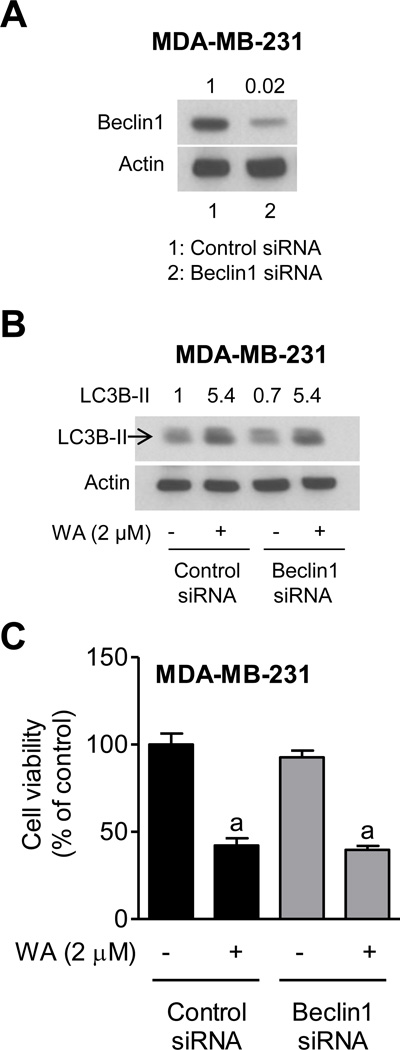
Beclin1 is involved in regulation of autophagy [34]. As can be seen in Fig. 6A, the level of Beclin1 protein was decreased by >90% in MDA-MB-231 cells after transfection with a Beclin1-targeted siRNA. Surprisingly, knockdown of Beclin1 protein had no influence on WA-mediated cleavage of LC3 (Fig. 6B) or inhibition of cell viability resulting from WA exposure (Fig. 6C). Because Beclin1 was dispensable for WA-mediated autophagy in MDA-MB-231 cells, these seemingly negative experiments were not carried out in MCF-7 cells.
Fig. (6). Beclin1 was dispensable for WA-mediated cleavage of LC3 and growth inhibition in MDA-MB-231 cells.
A, Immunoblot for Beclin1 using lysates from MDA-MB-231 cells transiently transfected with a control siRNA- or a Beclin1-specific siRNA. B, Immunoblot for LC3B using lysates from MDA-MB-231 cells transiently transfected with a control siRNA or a Beclin1-targeted siRNA and treated for 12 hours with DMSO or 2 µM of WA. C, Viability of MDA-MB-231 cells transiently transfected with a control siRNA or a Beclin1-targeted siRNA and treated for 12 hours with DMSO or 2 µM of WA. Cell viability was determined by trypan blue dye exclusion assay. Results are shown as mean ± SD (n=3). aSignificantly different (P<0.05) compared with DMSO-treated control by one way ANOVA followed by Bonferroni’s multiple comparison test. Similar results were obtained from replicate experiments.
DISCUSSION
Results shown herein indicate that WA treatment causes autophagy in human breast cancer cells and this response is not influenced by the estrogen receptor status. A role for p53 tumor suppressor in regulation of autophagy has also been suggested [35]. The p53 status has no obvious impact on WA-induced autophagy because this response is observed in both MCF-7 (wild-type p53) and MDA-MB-231 cells (mutant p53). Autophagy induction by some agents contributes to resistance against apoptosis in cancer cells [27, 36]. For example we have shown previously that D,L-sulforaphane (a synthetic racemic analogue of broccoli constituent L-sulforaphane) causes autophagy in prostate cancer cells, which serves to prevent release of cytochrome c as well as apoptosis [27]. Similarly, inhibition of autophagy by chloroquine augments activity of the alkylating agent cyclophosphamide in a _Myc_-driven model of lymphoma [36]. At the same, examples also exist to illustrate autophagy as a mode of cell death for some agents. Phenethyl isothiocyanate is one such agent that causes both apoptotic and autophagic cell death at least in human prostate cancer cells [37]. Metformin is another example where both autophagy and apoptosis are implicated in its anticancer response [38]. The results of the present study indicate that autophagy induction by WA has no influence on its ability to inhibit viability of breast cancer cells. For instance, knockdown of Atg5 markedly inhibits WA-mediated cleavage of LC3 but has no effect on suppression of cell viability resulting from WA exposure.
We have shown previously that MCF-10A cell line is significantly more resistant to WA-induced apoptosis compared with MCF-7 cells [17]. Interestingly, the WA-induced autophagy is clearly discernible in both MCF-10A and MCF-7 cells. Because normal human mammary epithelial cells are also resistant to WA-induced ROS production, which is observed in MCF-7 and MDA-MB-231 cells [20], it is reasonable to postulate that autophagy induction by WA is probably not dependent on ROS production. Because autophagy induction by WA has no effect on its ability to inhibit viability of breast cancer cells, we chose not to look into the possibility whether ROS play any role in WA-induced autophagy.
Beclin1 is the mammalian ortholog of yeast autophagy related gene product Atg6/Vps30 [39]. Beclin1 plays an important role during the formation of autophagosome [40]. Furthermore Beclin1 has been shown to complement autophagy defects in yeast and provoke autophagy upon overexpression in mammalian cells [41]. Studies have revealed that Beclin1 interacts with Bcl-2 family members, including Bcl-2, Bcl-xL, and Mcl-1 [42], and this interaction coordinates the cytoprotective function of autophagy [43]. To our surprise, Beclin1 appears dispensable not only for WA-mediated cleavage of LC3 but also growth inhibition resulting from WA exposure. For some agents (e.g., mTOR kinase inhibitor AZD8055), Beclin1 knockdown is clearly protective against autophagy [44]. It is possible that Beclin1 does not universally regulate autophagy.
In conclusion, the present study indicates that WA treatment causes autophagy in normal as well as cancerous breast cells, WA-mediated breast cancer cells growth inhibition is not affected by autophagy.
ACKNOWLEDGMENTS
The authors thank Marcus Johnson and Payal Pandey for technical assistance
ABBREVIATIONS
WA
withaferin A
ROS
reactive oxygen species
LC3
microtubule-associated protein 1 light chain 3
AVOs
acidic vesicular organelles
3-MA
3-methyl adenine
DMSO
dimethyl sulfoxide
PBS
phosphate-buffered saline
PARP
poly-(ADP-ribose)-polymerase
ANOVA
analysis of variance
Footnotes
CONFLICT OF INTEREST
No competing financial interests exist.
REFERENCES
- 1.Garodia P, Ichikawa H, Malani N, Sethi G, Aggarwal BB. From ancient medicine to modern medicine: Ayurvedic concepts of health and their role in inflammation and cancer. J. Soc. Integr. Oncol. 2007;5:25–37. doi: 10.2310/7200.2006.029. [DOI] [PubMed] [Google Scholar]
- 2.Baliga MS. Triphala, Ayurvedic formulation for treating and preventing cancer: A review. J. Altern. Complement. Med. 2010;16:1301–1308. doi: 10.1089/acm.2009.0633. [DOI] [PubMed] [Google Scholar]
- 3.Baliga MS, Dsouza JJ. Amla (Emblica officinalis Gaertn), a wonder berry in the treatment and prevention of cancer. Eur. J. Cancer Prev. 2011;20:225–239. doi: 10.1097/CEJ.0b013e32834473f4. [DOI] [PubMed] [Google Scholar]
- 4.Devi PU, Sharada AC, Solomon FE. Antitumor and radiosensitizing effects of Withania somnifera (Ashwagandha) on a transplantable mouse tumor, Sarcoma-180. Indian J. Exp. Biol. 1993;31:607–611. [PubMed] [Google Scholar]
- 5.Widodo N, Kaur K, Shrestha BG, Takagi Y, Ishii T, Wadhwa R, Kaul SC. Selective killing of cancer cells by leaf extract of Ashwagandha: Identification of a tumor-inhibitory factor and the first molecular insights to its effect. Clin. Cancer Res. 2007;13:2298–2306. doi: 10.1158/1078-0432.CCR-06-0948. [DOI] [PubMed] [Google Scholar]
- 6.Padmavathi B, Rath PC, Rao AR, Singh RP. Roots of Withania somnifera inhibit forestomach and skin carcinogenesis in mice. Evid. Based Complement. Alternat. Med. 2005;2:99–105. doi: 10.1093/ecam/neh064. [DOI] [PMC free article] [PubMed] [Google Scholar]
- 7.Leyon PV, Kuttan G. Effect of Withania somnifera on B16F-10 melanoma induced metastasis in mice. Phytother. Res. 2004;18:118–122. doi: 10.1002/ptr.1378. [DOI] [PubMed] [Google Scholar]
- 8.Mathur R, Gupta SK, Singh N, Mathur S, Kochupillai V, Velpandian T. Evaluation of the effect of Withania somnifera root extracts on cell cycle and angiogenesis. J. Ethnopharmacol. 2006;105:336–341. doi: 10.1016/j.jep.2005.11.020. [DOI] [PubMed] [Google Scholar]
- 9.Gupta SK, Mohanty I, Talwar KK, Dinda A, Joshi S, Bansal P, Saxena A, Arya DS. Cardioprotection from ischemia and reperfusion injury by Withania somnifera: a hemodynamic, biochemical and histopathological assessment. Mol. Cell. Biochem. 2004;260:39–47. doi: 10.1023/b:mcbi.0000026051.16803.03. [DOI] [PubMed] [Google Scholar]
- 10.Ahmad M, Saleem S, Ahmad AS, Ansari MA, Yousuf S, Hoda MN, Islam F. Neuroprotective effects of Withania somnifera on 6-hydroxydopamine induced Parkinsonism in rats. Hum. Exp. Toxicol. 2005;24:137–147. doi: 10.1191/0960327105ht509oa. [DOI] [PubMed] [Google Scholar]
- 11.Panda S, Kar A. Changes in thyroid hormone concentrations after administration of ashwagandha root extract to adult male mice. J. Pharm. Pharmacol. 1998;50:1065–1068. doi: 10.1111/j.2042-7158.1998.tb06923.x. [DOI] [PubMed] [Google Scholar]
- 12.Owais M, Sharad KS, Shehbaz A, Saleemuddin M. Antibacterial efficacy of Withania somnifera (Ashwagandha) an indigenous medicinal plant against experimental murine salmonellosis. Phytomedicine. 2005;12:229–235. doi: 10.1016/j.phymed.2003.07.012. [DOI] [PubMed] [Google Scholar]
- 13.Rasool M, Varalakshmi P. Immunomodulatory role of Withania somnifera root powder on experimental induced inflammation: An in vivo and in vitro study. Vascul. Pharmacol. 2006;44:406–410. doi: 10.1016/j.vph.2006.01.015. [DOI] [PubMed] [Google Scholar]
- 14.Shohat B, Joshua H. Effect of withaferin A on ehrlich ascites tumor cells. II. Target tumor cell destruction in vivo by immune activation. Int. J. Cancer. 1971;8:487–496. doi: 10.1002/ijc.2910080317. [DOI] [PubMed] [Google Scholar]
- 15.Devi PU, Kamath R, Rao BS. Radiosensitization of a mouse melanoma by withaferin A: in vivo studies. Indian J. Exp. Biol. 2000;38:432–437. [PubMed] [Google Scholar]
- 16.Manoharan S, Panjamurthy K, Menon VP, Balakrishnan S, Alias LM. Protective effect of Withaferin-A on tumour formation in 7,12-dimethylbenz[a]anthracene induced oral carcinogenesis in hamsters. Indian J. Exp. Biol. 2009;47:16–23. [PubMed] [Google Scholar]
- 17.Stan SD, Hahm ER, Warin R, Singh SV. Withaferin A causes FOXO3a- and Bim-dependent apoptosis and inhibits growth of human breast cancer cells in vivo. Cancer Res. 2008;68:7661–7669. doi: 10.1158/0008-5472.CAN-08-1510. [DOI] [PMC free article] [PubMed] [Google Scholar]
- 18.Srinivasan S, Ranga RS, Burikhanov R, Han SS, Chendil D. Par-4-dependent apoptosis by the dietary compound withaferin A in prostate cancer cells. Cancer Res. 2007;67:246–253. doi: 10.1158/0008-5472.CAN-06-2430. [DOI] [PubMed] [Google Scholar]
- 19.Thaiparambil JT, Bender L, Ganesh T, Kline E, Patel P, Liu Y, Tighiouart M, Vertino PM, Harvey RD, Garcia A, Marcus AI. Withaferin A inhibits breast cancer invasion and metastasis at sub-cytotoxic doses by inducing vimentin disassembly and serine 56 phosphorylation. Int. J. Cancer. 2011;129:2744–2755. doi: 10.1002/ijc.25938. [DOI] [PubMed] [Google Scholar]
- 20.Hahm ER, Moura MB, Kelley EE, Van Houten B, Shiva S, Singh SV. Withaferin A-induced apoptosis in human breast cancer cells is mediated by reactive oxygen species. PLoS One. 2011;6:e23354. doi: 10.1371/journal.pone.0023354. [DOI] [PMC free article] [PubMed] [Google Scholar]
- 21.Mayola E, Gallerne C, Esposti DD, Martel C, Pervaiz S, Larue L, Debuire B, Lemoine A, Brenner C, Lemaire C. Withaferin A induces apoptosis in human melanoma cells through generation of reactive oxygen species and down-regulation of Bcl-2. Apoptosis. 2011;16:1014–1027. doi: 10.1007/s10495-011-0625-x. [DOI] [PubMed] [Google Scholar]
- 22.Yang ES, Choi MJ, Kim JH, Choi KS, Kwon TK. Withaferin A enhances radiation-induced apoptosis in Caki cells through induction of reactive oxygen species, Bcl-2 downregulation and Akt inhibition. Chem. Biol. Interact. 2011;190:9–15. doi: 10.1016/j.cbi.2011.01.015. [DOI] [PubMed] [Google Scholar]
- 23.Lee TJ, Um HJ, Min do S, Park JW, Choi KS, Kwon TK. Withaferin A sensitizes TRAIL-induced apoptosis through reactive oxygen species-mediated up-regulation of death receptor 5 and down-regulation of c-FLIP. Free Radic. Biol. Med. 2009;46:1639–1649. doi: 10.1016/j.freeradbiomed.2009.03.022. [DOI] [PubMed] [Google Scholar]
- 24.Gibson SB. A matter of balance between life and death: targeting reactive oxygen species (ROS)-induced autophagy for cancer therapy. Autophagy. 2010;6:835–837. doi: 10.4161/auto.6.7.13335. [DOI] [PubMed] [Google Scholar]
- 25.Chen N, Karantza V. Autophagy as a therapeutic target in cancer. Cancer Biol. Ther. 2011;11:157–168. doi: 10.4161/cbt.11.2.14622. [DOI] [PMC free article] [PubMed] [Google Scholar]
- 26.Xiao D, Vogel V, Singh SV. Benzyl isothiocyanate-induced apoptosis in human breast cancer cells is initiated by reactive oxygen species and regulated by Bax and Bak. Mol. Cancer Ther. 2006;5:2931–2945. doi: 10.1158/1535-7163.MCT-06-0396. [DOI] [PubMed] [Google Scholar]
- 27.Herman-Antosiewicz A, Johnson DE, Singh SV. Sulforaphane causes autophagy to inhibit release of cytochrome. c and apoptosis in human prostate cancer cells. Cancer Res. 2006;66:5828–5835. doi: 10.1158/0008-5472.CAN-06-0139. [DOI] [PubMed] [Google Scholar]
- 28.Powolny AA, Bommareddy A, Hahm ER, Normolle DP, Beumer JH, Nelson JB, Singh SV. Chemopreventative potential of the cruciferous vegetable constituent phenethyl isothiocyanate in a mouse model of prostate cancer. J. Natl. Cancer Inst. 2011;103:571–584. doi: 10.1093/jnci/djr029. [DOI] [PMC free article] [PubMed] [Google Scholar]
- 29.Xiao D, Srivastava SK, Lew KL, Zeng Y, Hershberger P, Johnson CS, Trump DL, Singh SV. Allyl isothiocyanate, a constituent of cruciferous vegetables, inhibits proliferation of human prostate cancer cells by causing G2/M arrest and inducing apoptosis. Carcinogenesis. 2003;24:891–897. doi: 10.1093/carcin/bgg023. [DOI] [PubMed] [Google Scholar]
- 30.Xiao D, Choi S, Johnson DE, Vogel VG, Johnson CS, Trump DL, Lee YJ, Singh SV. Diallyl trisulfide-induced apoptosis in human prostate cancer cells involves c-Jun N-terminal kinase and extracellular-signal regulated kinase-mediated phosphorylation of Bcl-2. Oncogene. 2004;23:5594–5606. doi: 10.1038/sj.onc.1207747. [DOI] [PubMed] [Google Scholar]
- 31.Klionsky DJ, Abeliovich H, Agostinis P, Agrawal DK, Aliev G, Askew DS, Baba M, Baehrecke EH, Bahr BA, Ballabio A, Bamber BA, Bassham DC, Bergamini E, Bi X, Biard-Piechaczyk M, Blum JS, Bredesen DE, Brodsky JL, Brumell JH, Brunk UT, et al. Autophagy. 2008;4:151–175. doi: 10.4161/auto.5338. [DOI] [PMC free article] [PubMed] [Google Scholar]
- 32.Kabeya Y, Mizushima N, Ueno T, Yamamoto A, Kirisako T, Noda T, Kominami E, Ohsumi Y, Yoshimori T. LC3, a mammalian homologue of yeast Apg8p, is localized in autophagosome membranes after processing. EMBO J. 2000;19:5720–5728. doi: 10.1093/emboj/19.21.5720. [DOI] [PMC free article] [PubMed] [Google Scholar]
- 33.Bjørkøy G, Lamark T, Brech A, Outzen H, Perander M, Overvatn A, Stenmark H, Johansen T. p62/SQSTM1 forms protein aggregates degraded by autophagy and has a protective effect on huntingtin-induced cell death. J. Cell Biol. 2005;171:603–614. doi: 10.1083/jcb.200507002. [DOI] [PMC free article] [PubMed] [Google Scholar]
- 34.White EJ, Martin V, Liu JL, Klein SR, Piya S, Gomez-Manzano C, Fueyo J, Jiang H. Autophagy regulation in cancer development and therapy. Am. J. Cancer Res. 2011;1:362–372. [PMC free article] [PubMed] [Google Scholar]
- 35.Tasdemir E, Maiuri MC, Galluzzi L, Vitale I, Djavaheri-Mergny M, D'Amelio M, Criollo A, Morselli E, Zhu C, Harper F, Nannmark U, Samara C, Pinton P, Vicencio JM, Carnuccio R, Moll UM, Madeo F, Paterlini-Brechot P, Rizzuto R, Szabadkai G, Pierron G, Blomgren K, Tavernarakis N, Codogno P, Cecconi F, Kroemer G. Regulation of autophagy by cytoplasmic p53. Nat. Cell Biol. 2008;10:676–687. doi: 10.1038/ncb1730. [DOI] [PMC free article] [PubMed] [Google Scholar]
- 36.Amaravadi RK, Yu D, Lum JJ, Bui T, Christophorou MA, Evan GI, Thomas-Tikhonenko A, Thompson CB. Autophagy inhibition enhances therapy-induced apoptosis in a Myc-induced model of lymphoma. J. Clin. Invest. 2007;117:326–336. doi: 10.1172/JCI28833. [DOI] [PMC free article] [PubMed] [Google Scholar]
- 37.Bommareddy A, Hahm ER, Xiao D, Powolny AA, Fisher AL, Jiang Y, Singh SV. Atg5 regulates phenethyl isothiocyanate-induced autophagic and apoptotic cell death in human prostate cancer cells. Cancer Res. 2009;69:3704–3712. doi: 10.1158/0008-5472.CAN-08-4344. [DOI] [PMC free article] [PubMed] [Google Scholar]
- 38.Tomic T, Botton T, Cerezo M, Robert G, Luciano F, Puissant A, Gounon P, Allegra M, Bertolotto C, Bereder JM, Tartare-Deckert S, Bahadoran P, Auberger P, Ballotti R, Rocchi S. Metformin inhibits melanoma development through autophagy and apoptosis mechanisms. Cell Death Dis. 2011;2:e199. doi: 10.1038/cddis.2011.86. [DOI] [PMC free article] [PubMed] [Google Scholar]
- 39.Yue Z, Jin S, Yang C, Levine AJ, Heintz N. Beclin 1, an autophagy gene essential for early embryonic development, is a haploinsufficient tumor suppressor. Proc. Natl. Acad. Sci. USA. 2003;100:15077–15082. doi: 10.1073/pnas.2436255100. [DOI] [PMC free article] [PubMed] [Google Scholar]
- 40.Kihara A, Kabeya Y, Ohsumi Y, Yoshimori T. Beclin-phosphatidylinositol 3-kinase complex functions at the trans-Golgi network. EMBO Rep. 2001;2:330–335. doi: 10.1093/embo-reports/kve061. [DOI] [PMC free article] [PubMed] [Google Scholar]
- 41.Pattingre S, Tassa A, Qu X, Garuti R, Liang XH, Mizushima N, Packer M, Schneider MD, Levine B. Bcl-2 antiapoptotic proteins inhibit Beclin 1-dependent autophagy. Cell. 2005;122:927–939. doi: 10.1016/j.cell.2005.07.002. [DOI] [PubMed] [Google Scholar]
- 42.Levine B, Yuan J. Autophagy in cell death: an innocent convict? J. Clin. Invest. 2005;115:2679–2688. doi: 10.1172/JCI26390. [DOI] [PMC free article] [PubMed] [Google Scholar]
- 43.Cao Y, Klionsky DJ. Physiological functions of Atg6/Beclin 1: a unique autophagy-related protein. Cell Res. 2007;17:839–849. doi: 10.1038/cr.2007.78. [DOI] [PubMed] [Google Scholar]
- 44.Huang S, Yang ZJ, Yu C, Sinicrope FA. Inhibition of mTOR Kinase by AZD8055 Can Antagonize Chemotherapy-induced Cell Death through Autophagy Induction and Down-regulation of p62/Sequestosome 1. J. Biol. Chem. 2011;286:40002–40012. doi: 10.1074/jbc.M111.297432. [DOI] [PMC free article] [PubMed] [Google Scholar]
