Stimulation of de novo pyrimidine synthesis by growth signaling through mTOR and S6K1 (original) (raw)
. Author manuscript; available in PMC: 2013 Sep 15.
Published in final edited form as: Science. 2013 Feb 21;339(6125):1323–1328. doi: 10.1126/science.1228792
Abstract
Cellular growth signals stimulate anabolic processes. The mechanistic target of rapamycin complex 1 (mTORC1) is a protein kinase that senses growth signals to regulate anabolic growth and proliferation. Activation of mTORC1 led to the acute stimulation of metabolic flux through the de novo pyrimidine synthesis pathway. mTORC1 signaling post-translationally regulated this metabolic pathway via its downstream target ribosomal protein S6 kinase 1 (S6K1), which directly phosphorylates S1859 on CAD (carbamoyl-phosphate synthetase 2, aspartate transcarbamoylase, dihydroorotatase), the enzyme that catalyzes the first three steps of de novo pyrimidine synthesis. Growth signaling through mTORC1 thus stimulates the production of new nucleotides to accommodate an increase in RNA and DNA synthesis needed for ribosome biogenesis and anabolic growth.
Cells closely monitor the availability of growth factors, nutrients, and energy and respond accordingly by differentially regulating catabolic and anabolic metabolism. The mTORC1 signaling pathway senses and integrates cellular growth signals and may act as a conduit between these signals and the control of specific energy- and nutrient-consuming processes (1). mTORC1 stimulates protein synthesis through effects on mRNA translation and ribosome biogenesis (1, 2). mTORC1 signaling also promotes de novo lipid and sterol synthesis through the activation of the sterol-response element-binding protein (SREBP) transcription factors, which stimulate the expression of the enzymes driving this biosynthetic process (3, 4). Through such effects on macromolecular synthesis, mTORC1 is a major driver of anabolic cell growth and proliferation conserved throughout eukaryotes.
To reveal additional inputs from the mTORC1 pathway into the control of cellular metabolism, we used unbiased metabolomic profiling in cells lacking the tuberous sclerosis complex 2 (TSC2) tumor suppressor, a key negative regulator of mTORC1 (5). TSC2-deficient cells exhibit growth factor-independent activation of mTORC1 signaling. Of 224 small metabolites identified by liquid-chromatography (LC) tandem mass spectrometry (MS/MS), the steady state levels of 20 metabolites were significantly increased (p<0.01) in Tsc2-/- mouse embryo fibroblasts (MEFs) relative to those in their littermate-derived wild-type counterparts (Fig. 1A and Table S1). The Tsc2-/- cells were treated with the mTORC1 inhibitor rapamycin (15 hours) to identify changes dependent on mTORC1. We identified 5 metabolites whose abundance significantly decreased (p<0.01) in response to rapamycin (Fig. 1B). Amongst those that were both increased in abundance in the Tsc2-/- cells and sensitive to rapamycin were metabolites of the pentose phosphate pathway. mTORC1 signaling induces global transcription of pentose phosphate pathway genes, and thus increases metabolic flux through this pathway (4). To identify metabolites that are more acutely affected by changes in mTORC1 signaling, we also conducted metabolite profiling 1-hour after treatment of Tsc2-/- cells with rapamycin. Of the 5 metabolites whose abundance significantly decreased (p<0.01) after short-term rapamycin (Fig. 1C), only N-carbamoyl-aspartate was also both increased in abundance in the Tsc2-/- cells relative to wild-type (Fig. 1A) and sensitive to longer-term rapamycin (Fig. 1B), indicating that mTORC1 signaling positively influences the abundance of this metabolite. These changes are not due to differences in cell proliferation or cell cycle progression, which were similar between the Tsc2+/+ and Tsc2-/- cells and unchanged following 1-hour rapamycin treatment (Fig. S1A,B). N-carbamoyl-aspartate is generated in the first committed step of de novo pyrimidine biosynthesis, a pathway that combines nitrogen and carbon from glutamine, bicarbonate (HCO3-), and aspartate with ribose, derived from the pentose phosphate pathway, to form pyrimidine nucleotides (Fig. 1D). To confirm the sensitivity of this metabolite to short-term rapamycin, as detected in Tsc2-/- MEFs (Fig. 1E), we compared its abundance in other genetic settings with activated mTORC1 signaling after treatment with either vehicle or rapamycin. In a normal human breast epithelial cell line, MCF10A, stably expressing either K-RasG12V or PI3KH1047R, oncogenes that activate mTORC1 signaling (6), N-carbamoyl-aspartate levels were also decreased after 1-hour rapamycin treatment (Fig. 1F). In a PTEN null human glioblastoma cell line expressing doxycycline-inducible PTEN (U87MG-iPTEN) (7), PTEN re-expression or rapamycin treatment, both of which inhibit mTORC1 signaling in these cells, greatly reduced the abundance of N-carbamoyl-aspartate (Fig. 1G). Therefore, mTORC1 signaling affects the abundance of this metabolite in multiple cell settings.
Fig 1. Influence of mTORC1 on the abundance of N-carbamoyl-aspartate.
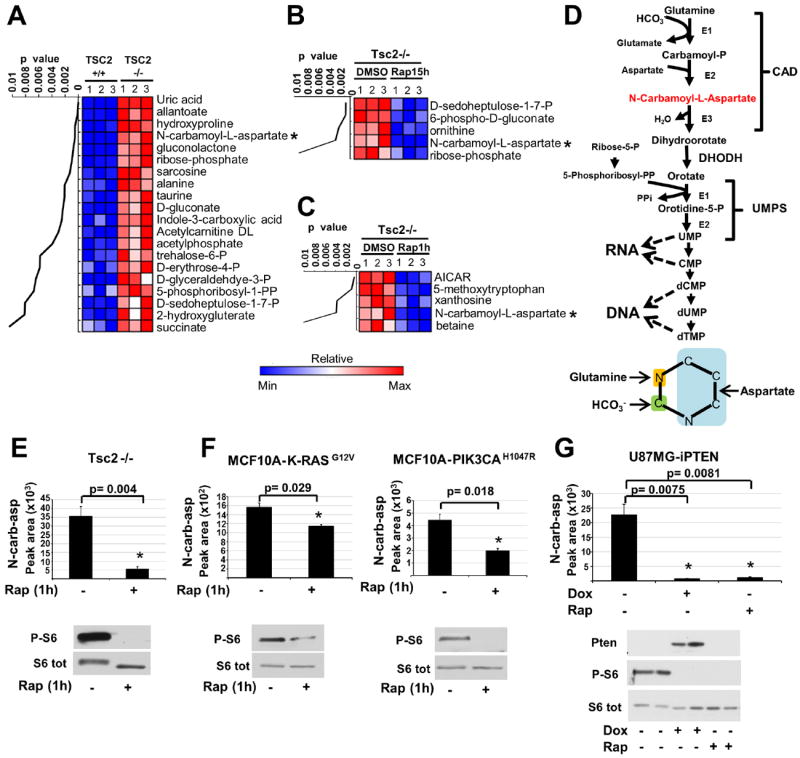
(A-C) Steady-state metabolite profiles from Tsc2+/+ and Tsc2-/- MEFs grown in the absence of serum for 15 h and treated with either vehicle (DMSO) or rapamycin (20 nM). Intracellular metabolites from three independent samples per condition were profiled by LC/MS/MS, and those significantly increased in Tsc2-/- relative to Tsc2+/+ cells (A) or decreased in Tsc2-/- cells by either 15 h (B) or 1 h (C) rapamycin treatment are shown as row-normalized heat maps ranked according to p value. See table S1 for the complete metabolite profiles from these samples.
(D) Schematic of the de novo pyrimidine synthesis pathway and the source of carbon and nitrogen incorporated into the pyrimidine ring (below).
(E,F) The effects of mTORC1 inhibition on the steady state levels of N-carbamoyl-aspartate, measured via LC/MS/MS, in _Tsc2_-/- MEFs (E) or MCF10A cells stably expressing K-RasG12V or PI3KCAH1047R (F) following 15 h serum starvation and 1 h treatment with rapamycin (20 nM) or DMSO.
(G) N-carbamoyl-aspartate levels were measured, as above, in U87MG cells stably expressing a doxycycline-inducible PTEN following 15 h serum starvation and treatment with doxycycline (1μg/mL) or rapamycin (20 nM) for the final 8 h.
(E-G) Data are shown as the mean±SEM from triplicate samples, with immunoblots below. MetaboAnalyst and GENE-E software were used to assist metabolite data analyses. All _P_-values for pairwise comparisons were calculated using a two-tailed Student’s t test (_N_=3).
To determine whether the effects of mTORC1 signaling on the steady state abundance of N-carbamoyl-aspartate reflect regulation of metabolic flux through the de novo pyrimidine synthesis pathway, we measured relative flux with a 15-minute pulse of stable-isotope labeled 15N-glutamine, labeled on the amide nitrogen that is incorporated into the pyrimidine ring. Enhanced incorporation of label into multiple intermediates of pyrimidine synthesis was detected in Tsc2-/- MEFs, and this was inhibited by short-term rapamycin treatment (Fig. 2A). Although Tsc2-/- cells exhibited increased glutamine uptake, this uptake was not sensitive to rapamycin at one hour (Fig. S2A), demonstrating that the mTORC1-regulated flux is not a result of increased glutamine availability. Flux through pyrimidine synthesis was stimulated by insulin in wild-type MEFs (Fig. 2B and Fig. S2B) or HeLa cells (Fig. S2C) and was blocked by mTORC1 inhibition with rapamycin, or in response to amino acid starvation (Fig. S2D, E). mTORC1 signaling thus induces this metabolic pathway in response to both genetic and physiological stimuli. A 15-minute pulse labeling with 13C-aspartate, which labels at the second step in the pathway (Fig. 1D), further confirmed the mTORC1-regulated flux (Fig. 2C). Because the pentose phosphate pathway converges with pyrimidine synthesis through ribose-5-phosphate and 5-phosphoribosyl-1-pyrophosphate (PRPP; Fig. 1D), which can influence upstream steps in pyrimidine synthesis (8), and mTORC1 signaling promotes flux through the oxidative branch of this pathway through transcriptional effects (4), we analyzed de novo synthesis of pentose phosphate pathway products after exposure of cells to a pulse of [1,2-13C]-glucose. Tsc2-/- cells exhibited increased flux through the oxidative pentose phosphate pathway leading to increased synthesis of ribose-5-phosphate and PRPP, and this was significantly sensitive to 15-hour (4), but not 1-hour, treatment with rapamycin (Fig. 2D). Therefore, the acute effects of mTORC1 signaling on pyrimidine synthesis are not through parallel effects on the pentose phosphate pathway.
Fig 2. Effects of genetic or insulin-stimulated activation of mTORC1 on metabolic flux through the de novo pyrimidine synthesis pathway.
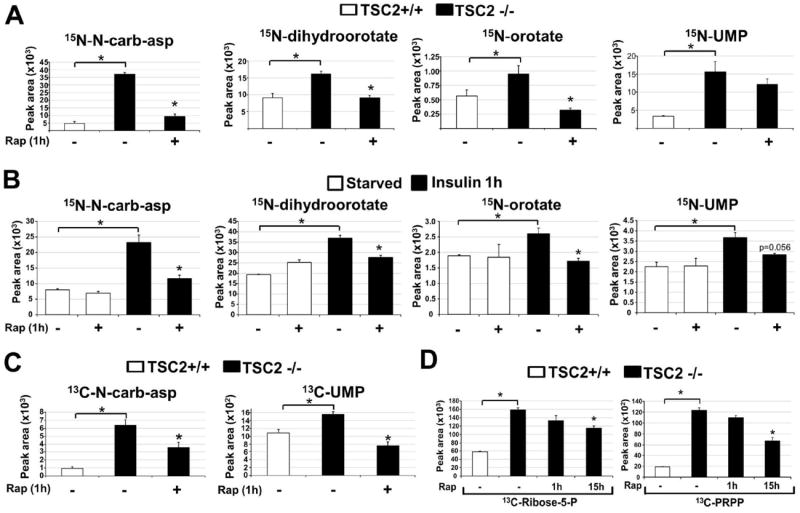
(A) Normalized peak areas of 15N-labeled metabolites, measured by LC/MS/MS, extracted from Tsc2+/+ and Tsc2-/- MEFs grown in the absence of serum for 15 h, with vehicle (DMSO) or rapamycin (20 nM) treatment over the last 1 h and a 15 min pulse label of 15N-glutamine.
(B) Normalized peak areas of 15N-labeled metabolites from wild-type MEFs treated as above, but stimulated with insulin (100 nM) for 1 h, where indicated.
(C) Normalized peak areas of 13C-labeled metabolites from cells treated as in (A), but with a 15 min pulse label of [4-13C]-aspartate prior to metabolite extraction.
(D) Normalized peak areas of singly 13C-labeled metabolites from cells treated as in (A) but with rapamycin treatment for either 1 h or 15 h and 15-min pulse label with [1,2-13C]-glucose prior to metabolite extraction.
(A-D) All data are presented as mean±SEM over three independent samples per condition. *P<0.05 for pairwise comparisons calculated using a two-tailed Student’s t test (_N_=3), with all _P_-values provided in table S3.
To identify the mechanism by which mTORC1 signaling stimulates pyrimidine synthesis, we focused on the enzymes comprising this pathway. We found that neither the transcript nor protein levels of CAD and dihydroorotate dehydrogenase (DHODH), the first two enzymes of the pathway, were altered in settings where mTORC1-dependent increases in flux through pyrimidine synthesis were detected (Fig. S3A-F). Rapamycin and a DHODH inhibitor (A771726 (9)) had opposing effects on both the steady-state (Fig. S3G) and de novo synthesized (Fig. S3H) amounts of N-carbamoyl-aspartate, with the DHODH inhibitor greatly increasing the abundance of this metabolite in Tsc2-/- cells, suggesting that mTORC1 signaling does not influence DHODH activity but rather steps upstream. Because CAD catalyzes the first three steps of the pathway (Fig. 1D), we performed MS/MS analyses on CAD immunopurified from insulin-stimulated cells in the presence or absence of rapamycin to identify potential mTORC1-regulated phosphorylation sites. Despite 85% coverage of the protein, we only identified two high stoichiometry phosphorylation sites in this analysis, S1859 and S1900 (Fig. S4A). Whereas the ratio of peptides containing S1900 that were phosphorylated remained unchanged with insulin and rapamycin treatment, peptides phosphorylated on S1859 were only detected in samples from insulin-stimulated cells and were absent from those also treated with rapamycin (Fig. 3A). S1859 lies within a conserved linker region between the dihydroorotase (DHO; E3) and aspartate transcarbamoylase (ATC; E2) domains, and the phosphorylation site is conserved amongst vertebrate CAD orthologs (Fig. S4B). This site can be phosphorylated in vitro by PKA (10) and was identified in two recent phospho-proteomic screens for mTORC1-regulated phosphorylation sites (11, 12). However, the cellular regulation and function of S1859 phosphorylation on CAD has not been described. To characterize the mechanism of S1859 phosphorylation, we took advantage of its sequence context, which is recognized by an available phospho-Ser-motif antibody. The phospho-Ser-motif antibody recognizes CAD from cells stimulated with insulin, whereas a phosphorylation site mutant of CAD affecting S1859 was not detected by this antibody, establishing the specificity of the antibody for phospho-S1859 on CAD (Fig. 3B). The insulin-stimulated phosphorylation of CAD on this site was sensitive to rapamycin, confirming the dependence on mTORC1 activation (Fig. 3C). Because the S1859 motif resembles that recognized by basophilic kinases, such as Akt and S6K (13, 14), rather than the motif reported for mTOR (11), we determined whether this site was phosphorylated by S6K1 or S6K2 downstream of mTORC1. Like rapamycin, an S6K1-specific inhibitor (PF-4708671 (15)) blocked the insulin-stimulated phosphorylation of CAD-S1859, along with that of an established S6K1 target site on Rictor (Fig. 3C) (16). Likewise, siRNA-mediated knockdown of S6K1, but not S6K2, attenuated CAD phosphorylation on S1859 (Fig. 3D). CAD and endogenous S6K1 coimmunoprecipitated (Fig. S4C), and S6K1, but not catalytically inactive S6K1, directly phosphorylated CAD on S1859 in vitro (Fig. 3E). A phospho-specific antibody to CAD-S1859 (Fig. S4D) confirmed that endogenous CAD is phosphorylated on this residue in multiple cell lines in response to insulin or EGF in an mTORC1- and S6K1-dependent, but ERK- and RSK-independent, manner (Fig. 3F and Fig. S4E, F). S6K1 did not influence the phosphorylation of CAD on T456, which is phosphorylated by ERK in response to EGF (Fig. 3F)(17).
Fig 3. CAD as a direct substrate of S6K1.
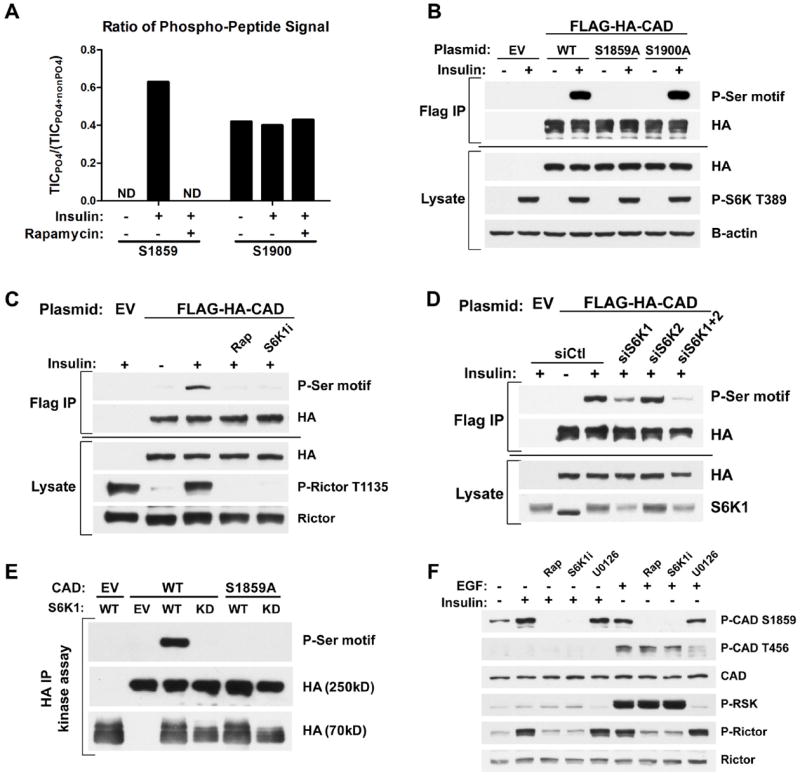
(A) Effects of insulin and rapamycin on CAD phosphorylation sites. FLAG-HA-CAD was immunopurified from serum-starved (16 h) HEK-293E cells, treated for 1h with DMSO or rapamycin (20 nM), prior to stimulation with insulin (3 h, 50 nM). The ratios of phosphorylated to total peptide levels, measured as total ion current (TIC) by LC/MS/MS, of the indicated sites on CAD under the different conditions are graphed. ND=phospho-peptide not detected.
(B) HEK-293E cells expressing empty vector (EV) or wild-type (WT), S1859A, or S1900A versions of FLAG-HA-CAD were serum-starved (16 h) and stimulated with insulin (1 h, 100 nM). FLAG-immunoprecipitates were immunoblotted with a phospho-14-3-3-binding motif antibody (P-Ser motif).
(C) Cells were treated as in (B), but pretreated for 1 h with rapamycin (20 nM) or the S6K1 inhibitor PF-4708671 (10 μM, S6K1i) prior to insulin stimulation.
(D) Cells were treated as in (C), but were also transfected with siRNAs targeting S6K1, S6K2, or both, or non-targeting controls (siCtl).
(E) In vitro kinase assays were performed with FLAG-HA-CAD substrate (WT or S1859A) immunoprecipitated from serum-starved, rapamycin-treated HEK-293E cells and HA-S6K1 (WT or kinase dead, KD) immunoprecipitated from insulin-stimulated HEK-293E cells.
(F) Hela cells were serum-starved (16 h) and pretreated for 1 h with rapamycin, S6K1i, or the MEK inhibitor U0126 (10 μM) prior to 1-h stimulation with insulin (100 nM) or EGF (20 ng/mL).
We sought to determine whether S6K1 activity influences flux through the pyrimidine synthesis pathway. While long-term treatment with rapamycin can decrease glucose uptake and its flux through the oxidative pentose phosphate pathway (4), the S6K1-specific inhibitor did not affect glucose uptake in Tsc2-/- cells (Fig. S5A) and siRNA-mediated depletion of S6K1 did not influence pentose phosphate pathway flux in insulin-stimulated cells (Fig. S5B). In contrast, the S6K1 inhibitor, like rapamycin, significantly decreased the insulin-stimulated flux from 15N-glutamine into metabolites of the pyrimidine synthesis pathway (Fig. 4A and Fig. S5C), and this was also seen with siRNA-mediated depletion of S6K1, but not S6K2 (Fig. 4B and Fig. S5D). Similar effects of S6K1 depletion on pyrimidine flux were observed in Tsc2-/- cells with constitutive mTORC1 signaling (Fig. S5E). Thus, S6K1 is required for induction of de novo pyrimidine synthesis downstream of mTORC1.
Fig 4. Requirement of S6K1 and S1859 on CAD for the mTORC1-dependent stimulation of the de novo pyrimidine synthesis pathway.
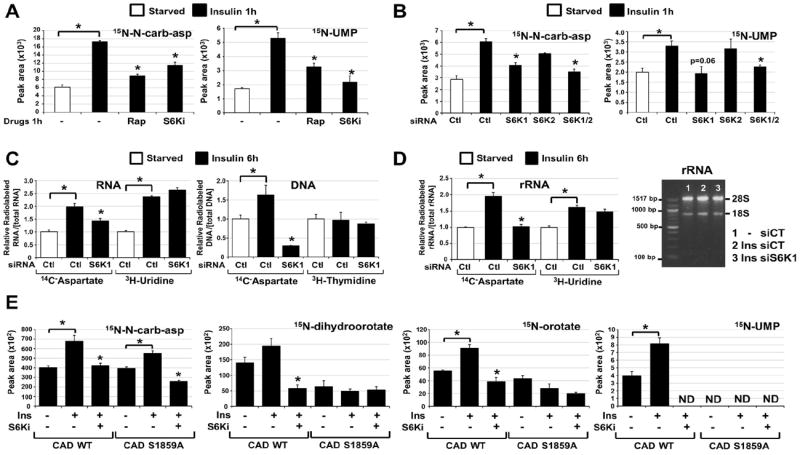
(A) Normalized peak areas of 15N-labeled metabolites, measured by LC/MS/MS, extracted from WT MEFs serum starved (15 h) and insulin stimulated (1h, 100 nM) in presence of DMSO, rapamycin (20 nM) or PF-4708671 (10 μM, S6Ki), with a 15-min pulse label of 15N-glutamine.
(B) Normalized peak areas of 15N-labeled metabolites from WT MEFs transfected with siRNAs targeting S6K1, S6K2, or both, or non-targeting controls (siCtl), were treated 48 h post-transfection as in (A).
(C) The relative incorporation of radiolabel from 14C-aspartate, 3H-uridine or 3H-thymidine into RNA and DNA from WT MEFs transfected with siRNAs as in (B), serum starved (15 h), and stimulated with insulin (6 h, 100 nM), during which cells were radiolabeled.
(D) The relative incorporation of radiolabel from 14C-aspartate or 3H-uridine into rRNA from WT MEFs treated as in (C). The purified rRNA was also assessed on an agarose gel (right).
(E) Normalized peak areas of 15N-labeled metabolites in G9C cells expressing CAD WT or a S1859A mutant treated as in (A). ND=metabolite not detected.
(A-E) All data are presented as mean±SEM over three independent samples per condition. *P<0.05 for pairwise comparisons calculated using a two-tailed Student’s t test (_N_=3), with all _P_-values provided in table S4.
To determine whether mTORC1 signaling influences the production of nucleic acids through its stimulation of de novo pyrimidine synthesis, we measured the incorporation of carbon from 14C-aspartate into RNA and DNA. To control for global effects on RNA and DNA synthesis, we also labeled cells with either 3H-uridine for RNA or 3H-thymidine for DNA, exogenous pyrimidines that bypass the de novo synthesis pathway. The DHODH inhibitor blocked the insulin-induced integration of 14C, but not 3H, into both RNA and DNA, validating the specificity of this assay for de novo pyrimidine synthesis (Fig. S6A). The insulin-stimulated incorporation of both 14C-aspartate and 3H-uridine into RNA was inhibited by rapamycin (Fig. S6A, B), indicating that mTORC1 signaling influences both de novo pyrimidine synthesis and global RNA synthesis downstream of insulin. As the majority of cellular RNA is ribosomal, this finding is consistent with the multiple inputs from mTORC1 signaling into rRNA synthesis (2). However, the effects of rapamycin on the incorporation of pyrimidines into DNA was specific to those synthesized de novo (Fig. S6A, B). SiRNA-mediated depletion of S6K1 also blocked the insulin-induced incorporation of 14C-aspartate into both RNA and DNA but, unlike rapamycin, did not affect the incorporation of exogenous pyrimidines (Fig. 4C). Ribosome purification from labeled cells depleted of S6K1 demonstrated that S6K1 was required for insulin to stimulate the incorporation of de novo synthesized pyrimidines, but not exogenous pyrimidines, into rRNA (Fig. 4D). The role of S6K1 in the mTORC1-stimulated flux through pyrimidine synthesis into RNA and DNA was further confirmed in Tsc2-/- cells depleted of S6K1 (Fig. S6C).
To determine whether S6K1 regulates flux through the pyrimidine synthesis pathway through its direct phosphorylation of CAD-S1859, we used a chinese hamster ovary (CHO-K1)-derived cell line called G9C, which is auxotrophic for uridine due to a CAD deficiency (18). As in other cell settings, insulin acutely stimulated an increase in labeling of intermediates in pyrimidine synthesis in G9C cells expressing wild-type CAD, and this was blocked by the S6K1 inhibitor (Fig. 4E and Fig. S7A, B). Although the synthesis of N-carbamoyl-aspartate increased in response to insulin in CAD-S1859A mutant-expressing G9C cells, the labeling of pyrimidine intermediates downstream of CAD was not stimulated by insulin, with these metabolites detected at amounts similar to that in wild-type cells treated with the S6K1 inhibitor (Fig. 4E). These data suggest that the S6K1-mediated phosphorylation of S1859 enhances the in vivo dihydroorotase (E3) activity of CAD, with additional points of regulation from insulin and S6K1 possibly affecting upstream steps in the pathway (Fig. S7C). The cells expressing CAD-S1859A were no longer acutely sensitive to insulin for the stimulated incorporation of de novo synthesized pyrimidines into RNA and DNA (Fig. S7D).
This study demonstrates that mTORC1 serves as a molecular link between growth signals and acute control over pyrimidine synthesis. It is worth emphasizing that mTORC1 and S6K1 are not essential for de novo pyrimidine synthesis per se, but are required to increase flux through this pathway in response to growth-promoting signals, such as insulin and nutrients. The direct regulation of CAD by S6K1 serves as a mechanism to increase the pool of nucleotides available for the RNA and DNA synthesis that accompanies cell growth. In addition to protein and lipid synthesis, pyrimidine synthesis represents another major anabolic process that is responsive to changes in cellular growth conditions through mTORC1 signaling.
Supplementary Material
01
Supporting Online Material
Materials and Methods
References (19-23)
Figs. S1 to S7
Tables S1 to S4
Acknowledgments
We thank Min Yuan and Susanne Breitkopf for technical assistance with MS/MS, and David Patterson, David Kwiatkowski and Marie Zbinden for cell lines. This work was supported in part by a grant from the LAM Foundation (I.B.S.), NIH grants F32-DK095508 (J.J.H.), P01-CA120964 (B.D.M. and J.M.A.), R01-CA122617 (B.D.M.), and Dana Farber/Harvard Cancer Center Grant P30-CA006516 (J.M.A.), and a Sanofi Innovation Award (B.D.M.). I.B.S. and J.J.H. conceived and performed all experiments, analyzed all experimental data, and prepared the manuscript. J.M.A. performed and analyzed the MS/MS experiments. B.D.M. directed the research, reviewed all experimental data, and prepared the manuscript.
Footnotes
All authors have reviewed the manuscript and declare no competing financial interests.
References and Notes
- 1.Laplante M, Sabatini DM. mTOR signaling in growth control and disease. Cell. 2012 Apr 13;149:274. doi: 10.1016/j.cell.2012.03.017. [DOI] [PMC free article] [PubMed] [Google Scholar]
- 2.Iadevaia V, Huo Y, Zhang Z, Foster LJ, Proud CG. Roles of the mammalian target of rapamycin, mTOR, in controlling ribosome biogenesis and protein synthesis. Biochem Soc Trans. 2012 Feb;40:168. doi: 10.1042/BST20110682. [DOI] [PubMed] [Google Scholar]
- 3.Porstmann T, et al. SREBP activity is regulated by mTORC1 and contributes to Akt-dependent cell growth. Cell Metab. 2008 Sep;8:224. doi: 10.1016/j.cmet.2008.07.007. [DOI] [PMC free article] [PubMed] [Google Scholar]
- 4.Duvel K, et al. Activation of a metabolic gene regulatory network downstream of mTOR complex 1. Mol Cell. 2010 Jul 30;39:171. doi: 10.1016/j.molcel.2010.06.022. [DOI] [PMC free article] [PubMed] [Google Scholar]
- 5.Huang J, Manning BD. The TSC1-TSC2 complex: a molecular switchboard controlling cell growth. Biochem J. 2008;412 doi: 10.1042/BJ20080281. [DOI] [PMC free article] [PubMed] [Google Scholar]
- 6.Menon S, Manning BD. Common corruption of the mTOR signaling network in human tumors. Oncogene. 2009;27:S43–S51. doi: 10.1038/onc.2009.352. [DOI] [PMC free article] [PubMed] [Google Scholar]
- 7.Radu A, Neubauer V, Akagi T, Hanafusa H, Georgescu MM. PTEN induces cell cycle arrest by decreasing the level and nuclear localization of cyclin D1. Mol Cell Biol. 2003 Sep;23:6139. doi: 10.1128/MCB.23.17.6139-6149.2003. [DOI] [PMC free article] [PubMed] [Google Scholar]
- 8.Mori M, Tatibana M. A multienzyme complex of carbamoyl-phosphate synthase (glutamine): aspartate carbamoyltransferase: dihydoorotase (rat ascites hepatoma cells and rat liver) Methods Enzymol. 1978;51:111. doi: 10.1016/s0076-6879(78)51019-7. [DOI] [PubMed] [Google Scholar]
- 9.Williamson RA, et al. Dihydroorotate dehydrogenase is a target for the biological effects of leflunomide. Transplant Proc. 1996 Dec;28:3088. [PubMed] [Google Scholar]
- 10.Carrey EA, Campbell DG, Hardie DG. Phosphorylation and activation of hamster carbamyl phosphate synthetase II by cAMP-dependent protein kinase. A novel mechanism for regulation of pyrimidine nucleotide biosynthesis. EMBO J. 1985 Dec 30;4:3735. doi: 10.1002/j.1460-2075.1985.tb04142.x. [DOI] [PMC free article] [PubMed] [Google Scholar]
- 11.Hsu PP, et al. The mTOR-regulated phosphoproteome reveals a mechanism of mTORC1-mediated inhibition of growth factor signaling. Science. 2011 Jun 10;332:1317. doi: 10.1126/science.1199498. [DOI] [PMC free article] [PubMed] [Google Scholar]
- 12.Yu Y, et al. Phosphoproteomic analysis identifies Grb10 as an mTORC1 substrate that negatively regulates insulin signaling. Science. 2011 Jun 10;332:1322. doi: 10.1126/science.1199484. [DOI] [PMC free article] [PubMed] [Google Scholar]
- 13.Flotow H, Thomas G. Substrate recognition determinants of the mitogen-activated 70K S6 kinase from rat liver. J Biol Chem. 1992;267:3074. [PubMed] [Google Scholar]
- 14.Alessi DR, Caudwell FB, Andejelkovic M, Hemmings BA, Cohen P. Molecular basis for the substrate specificity of protein kinase B; comparison with MAPKAP kinase-1 and p70 S6 kinase. FEBS Lett. 1996;399:333. doi: 10.1016/s0014-5793(96)01370-1. [DOI] [PubMed] [Google Scholar]
- 15.Pearce LR, et al. Characterization of PF-4708671, a novel and highly specific inhibitor of p70 ribosomal S6 kinase (S6K1) Biochem J. 2010 Oct 15;431:245. doi: 10.1042/BJ20101024. [DOI] [PubMed] [Google Scholar]
- 16.Dibble CC, Asara JM, Manning BD. Characterization of Rictor phosphorylation sites reveals direct regulation of mTOR complex 2 by S6K1. Mol Cell Biol. 2009 Nov;29:5657. doi: 10.1128/MCB.00735-09. [DOI] [PMC free article] [PubMed] [Google Scholar]
- 17.Graves LM, et al. Regulation of carbamoyl phosphate synthetase by MAP kinase. Nature. 2000 Jan 20;403:328. doi: 10.1038/35002111. [DOI] [PubMed] [Google Scholar]
- 18.Musmanno LA, Jamison RS, Barnett RS, Buford E, Davidson JN. Complete hamster CAD protein and the carbamylphosphate synthetase domain of CAD complement mammalian cell mutants defective in de novo pyrimidine biosynthesis. Somat Cell Mol Genet. 1992 Jul;18:309. doi: 10.1007/BF01235754. [DOI] [PubMed] [Google Scholar]
- 19.Tanti JF, Cormont M, Gremeaux T, Le Marchand-Brustel Y. Assays of glucose entry, glucose transporter amount, and translocation. Methods Mol Biol. 2001;155:157. doi: 10.1385/1-59259-231-7:157. [DOI] [PubMed] [Google Scholar]
- 20.Yuan M, Breitkopf SB, Yang X, Asara JM. A positive/negative ion-switching, targeted mass spectrometry-based metabolomics platform for bodily fluids, cells, and fresh and fixed tissue. Nature protocols. 2012 May;7:872. doi: 10.1038/nprot.2012.024. [DOI] [PMC free article] [PubMed] [Google Scholar]
- 21.Ying H, et al. Oncogenic Kras maintains pancreatic tumors through regulation of anabolic glucose metabolism. Cell. 2012 Apr 27;149:656. doi: 10.1016/j.cell.2012.01.058. [DOI] [PMC free article] [PubMed] [Google Scholar]
- 22.Locasale JW, et al. Phosphoglycerate dehydrogenase diverts glycolytic flux and contributes to oncogenesis. Nat Genet. 2011 Sep;43:869. doi: 10.1038/ng.890. [DOI] [PMC free article] [PubMed] [Google Scholar]
- 23.Belin S, et al. Purification of ribosomes from human cell lines. Curr Protoc Cell Biol. 2010 Dec;Chapter 3(Unit 3):40. doi: 10.1002/0471143030.cb0340s49. [DOI] [PubMed] [Google Scholar]
Associated Data
This section collects any data citations, data availability statements, or supplementary materials included in this article.
Supplementary Materials
01
Supporting Online Material
Materials and Methods
References (19-23)
Figs. S1 to S7
Tables S1 to S4