Genomic and Epigenomic Landscapes of Adult De Novo Acute Myeloid Leukemia (original) (raw)
. Author manuscript; available in PMC: 2013 Nov 30.
Published in final edited form as: N Engl J Med. 2013 May 1;368(22):2059–2074. doi: 10.1056/NEJMoa1301689
Abstract
BACKGROUND
Many mutations that contribute to the pathogenesis of acute myeloid leukemia (AML) are undefined. The relationships between patterns of mutations and epigenetic phenotypes are not yet clear.
METHODS
We analyzed the genomes of 200 clinically annotated adult cases of de novo AML, using either whole-genome sequencing (50 cases) or whole-exome sequencing (150 cases), along with RNA and microRNA sequencing and DNA-methylation analysis.
RESULTS
AML genomes have fewer mutations than most other adult cancers, with an average of only 13 mutations found in genes. Of these, an average of 5 are in genes that are recurrently mutated in AML. A total of 23 genes were significantly mutated, and another 237 were mutated in two or more samples. Nearly all samples had at least 1 nonsynonymous mutation in one of nine categories of genes that are almost certainly relevant for pathogenesis, including transcription-factor fusions (18% of cases), the gene encoding nucleophosmin (NPM1) (27%), tumor-suppressor genes (16%), DNA-methylation–related genes (44%), signaling genes (59%), chromatin-modifying genes (30%), myeloid transcription-factor genes (22%), cohesin-complex genes (13%), and spliceosome-complex genes (14%). Patterns of cooperation and mutual exclusivity suggested strong biologic relationships among several of the genes and categories.
CONCLUSIONS
We identified at least one potential driver mutation in nearly all AML samples and found that a complex interplay of genetic events contributes to AML pathogenesis in individual patients. The databases from this study are widely available to serve as a foundation for further investigations of AML pathogenesis, classification, and risk stratification. (Funded by the National Institutes of Health.)
The molecular pathogenesis of acute myeloid leukemia (AML) has been studied with the use of cytogenetic analysis for more than three decades. Recurrent chromosomal structural variations are well established as diagnostic and prognostic markers, suggesting that acquired genetic abnormalities (i.e., somatic mutations) have an essential role in pathogenesis.1,2 However, nearly 50% of AML samples have a normal karyotype, and many of these genomes lack structural abnormalities, even when assessed with high-density comparative genomic hybridization or single-nucleotide polymorphism (SNP) arrays3-5 (see Glossary). Targeted sequencing has identified recurrent mutations in FLT3, NPM1, KIT, CEBPA, and TET2.6-8 Massively parallel sequencing enabled the discovery of recurrent mutations in DNMT3A9,10 and IDH1.11 Recent studies have shown that many patients with AML carry no mutations in any of the currently recognized driver genes associated with the pathogenesis of AML.8,12
Patients with a cytogenetic profile that is associated with a favorable risk (i.e., those with PML-RARA, RUNX1-RUNX1T1, or MYH11-CBFB fusions) have relatively good outcomes with chemotherapy-based consolidation regimens, whereas patients with an unfavorable-risk profile (monosomy karyotype or complex alterations) require allogeneic transplantation during the first remission to improve their prognosis.13,14 However, the majority of patients with AML have an intermediate cytogenetic risk (most commonly, a normal karyotype); some of these patients do well with chemotherapeutic consolidation, but others have a very poor outcome. For this reason, recent studies have focused on establishing new biomarkers for better classification of intermediate risk.8,15,16 Newer classification algorithms incorporate FLT3, NPM1, CEBPA, and KIT into standard-of-care testing. Even more recently, testing has revealed that mutations in newly discovered AML genes (e.g., DNMT3A, IDH1/2, and TET2) may also provide prognostic information for some patients with an intermediate-risk profile.8,12,16 None of the current classification schemes are entirely accurate, which suggests that a more complete understanding of the genetic and epigenetic changes that are relevant to the pathogenesis of AML will be required for better classification of risk and, ultimately, better approaches to therapy.
METHODS
PATIENTS
We selected samples from 200 adults with de novo AML to represent the major morphologic and cytogenetic subtypes of AML.8,15,16 The characteristics of these patients are fully described in Table 1, and in Tables S1 and S2, Figure S1, and the Materials section in the Supplementary Appendix, available with the full text of this article at NEJM.org. A video describing AML and this study is also available at NEJM.org.
Table 1.
Characteristics of the 200 Patients.*
| Characteristic | Value |
|---|---|
| Age at study entry — yr | 55.0±16.1 |
| Race or ethnic group — no. (%)† | |
| White | 178 (89) |
| Black | 15 (8) |
| Other | 7 (4) |
| Male sex — no. (%) | 108 (54) |
| Bone marrow blasts at diagnosis — % | 69.3±19.1 |
| Normal cytogenetic profile — no./total no. (%) | 92/195 (47) |
| White-cell count at diagnosis — per mm3 | |
| Mean | 36,300±48,500 |
| Median | 16,200 |
| Cytogenetic risk group — no. (%) | |
| Favorable | 37 (18) |
| Intermediate | 115 (58) |
| Unfavorable | 43 (22) |
| Missing data | 5 (2) |
| AML FAB subtype — no. (%) | |
| AML with minimal maturation: M0 | 19 (10) |
| AML without maturation: M1 | 46 (23) |
| AML with maturation: M2 | 44 (22) |
| Acute promyelocytic leukemia: M3 | 20 (10) |
| Acute myelomonocytic leukemia: M4 | 41 (20) |
| Acute monoblastic or monocytic leukemia: M5 | 22 (11) |
| Acute erythroid leukemia: M6 | 3 (2) |
| Acute megakaryoblastic leukemia: M7 | 3 (2) |
| Other subtype | 2 (1) |
| Immunophenotype — no./total no. (%) | |
| CD13+ | 140/185 (76) |
| CD33+ | 160/198 (81) |
| CD34+ | 123/199 (62) |
| CD117+ | 174/185 (94) |
| Mutation — no./total no. (%) | |
| NPM1 | 54/200 (27) |
| FLT3 | 56/200 (28) |
| DNMT3A | 51/200 (26) |
| IDH1 or IDH2 | 39/200 (20) |
| NRAS or KRAS | 23/200 (12) |
| RUNX1 | 19/200 (10) |
| TET2 | 17/200 (8) |
| TP53 | 16/200 (8) |
| CEBPA | 13/200 (6) |
| WT1 | 12/200 (6) |
| PTPN11 | 9/200 (4) |
| KIT | 8/200 (4) |
| Loss of 5 or del(5q) | 16/195 (8) |
| Loss of 7 or del(7q) | 20/195 (10) |
| 11q23 | 7/195 (4) |
| t(15;17) | 18/195 (9) |
| t(8;21) | 7/195 (4) |
| inv(16) | 12/195 (6) |
ANALYTIC PLATFORMS
We performed whole-genome sequencing of the primary tumor and matched normal skin samples from 50 patients (with data from 24 of these patients reported previously17) and exome capture and sequencing for another 150 paired samples of AML tumor and skin (see Table S3 in the Supplementary Appendix for coverage data for the 200 samples).
All 200 patients who were selected for this study were enrolled in a single-institution tissue-banking protocol approved by the human studies committee at Washington University. Written informed consent for whole-genome sequencing was obtained from all study participants.
The samples, which were banked between November 2001 and March 2010, were selected from a set of more than 400 samples to reflect a real-world distribution of subtypes. Sample inventory and quality issues also had to be considered in the selection process, since the samples were analyzed on several different platforms. We identified candidate somatic variants using several algorithms (see the Methods section in the Supplementary Appendix), and all the variants for the 200 samples were verified with the use of hybridization capture–based methods and deep digital sequencing.18 We performed RNA-expression profiling on the Affymetrix U133 Plus 2 platform for 197 samples, RNA sequencing for 179 samples, microRNA (miRNA) sequencing for 194 samples, Illumina Infinium Human Methylation 450 BeadChip profiling for 192 samples, and Affymetrix SNP Array 6.0 for both tumor and normal skin samples from all 200 patients. Data sets were not completed for all samples on all platforms because of assay failures and availability and quality issues for some samples. The complete list of data sets is provided in Table S4 in the Supplementary Appendix. All data sets are available through the Cancer Genome Atlas (TCGA) data portal (https://tcga-data.nci.nih.gov/tcga).
RESULTS
COPY-NUMBER ALTERATIONS
In most de novo AML samples with a cytogenetic profile indicating intermediate or favorable risk, we detected very few copy-number events on high-resolution SNP arrays, as reported previously3 (Fig. S2 and Table S5 in the Supplementary Appendix). Unfavorable-risk samples had chromosomal copy-number alterations that were verified on the SNP arrays, and many had additional, cytogenetically cryptic events. No samples contained evidence of chromothripsis (a single genomic event that results in focal losses and rearrangements in multiple genomic regions).19 Details of these analyses are presented in the Materials section in the Supplementary Appendix.
MUTATIONS IN CODING SEQUENCES
We discovered 2315 somatic single-nucleotide variants (SNVs) and 270 small insertions and deletions (indels) in coding (tier 1) regions of the genome, with an average of 13 tier 1 mutations per sample (range, 0 to 51) (see box, and Table S6 in the Supplementary Appendix). We observed no recurring coding mutations in three samples, but all contained well-recognized fusion events that are known to initiate AML (NUP98-NSD1 in Patient 868231, MLL-MLLT3/AF9 in Patient 923966, and MLL-MLLT10/AF10 in Patient 558395). Three outlier samples contained 51, 36, and 35 tier 1 mutations; none of these samples contained mutations in known DNA-repair genes. Of the 2315 SNVs, 1539 (66%) were missense and 510 (22%) had no translational consequences. Small indels accounted for 270 of the 2585 validated mutations (10%); of these, 191 (71%) caused frameshifts.
Tiers of Variants.
Somatic variants that are identified on whole-genome sequencing and other large-scale sequencing analyses are often categorized according to their likely effect on biologic function. In this study, the somatic variants were divided into four tiers.
- Tier 1
Changes in the amino acid coding regions of annotated exons, consensus splice-site regions, and RNA genes (including microRNAs). - Tier 2
Changes in highly conserved regions of the genome or regions with regulatory potential. - Tier 3
Changes in the nonrepetitive part of the genome that do not meet the criteria for tier 2. - Tier 4
Changes in the remainder of the genome.
Samples were stratified into 10 groups on the basis of the presence or absence of known recurring fusion events, cytogenetic-risk profile, or the presence or absence of TP53 mutations (which were strongly associated with an unfavorable cytogenetic risk) (Fig. 1A). We observed significant differences in the numbers of recurrent tier 1 mutations in some of these groups. Eleven samples had MLL fusions; this group had the fewest recurrent tier 1 mutations, with a mean of 2.09, as compared with a mean of 5.24 for all 200 samples (P = 0.002 after correction for multiple comparisons). This finding suggests that MLL fusions require fewer cooperating mutations than other AML-initiating events. Similarly, 20 samples containing PML-RARA fusions had fewer recurrent tier 1 mutations (mean, 3.25; P=0.001). We observed a higher mean number of recurrent tier 1 mutations in 7 samples containing either _RUNX1_-RUNX1T1 fusions (mean value, 7.85; P = 0.04) and in 13 samples with a combination of a high-risk cytogenetic profile and a TP53 mutation (mean, 7.00; P = 0.049). Larger sample sets will be required to confirm these observations.
Figure 1. Characterization of Mutations.
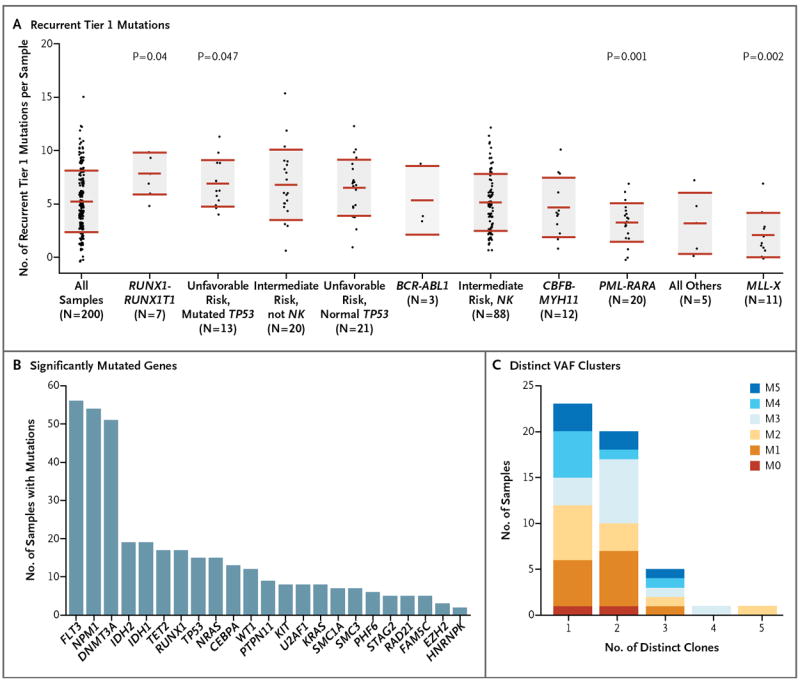
Panel A shows the numbers of verified, recurrent tier 1 mutations in each of 200 samples obtained from patients with AML, organized according to important cytogenetic and mutational findings. For each set of data, the middle horizontal line indicates the mean, and the shaded area indicates ±1 SD. P values are shown for the groups that had significant differences from the mean number of recurrent tier 1 mutations in all samples. NK denotes normal karyotype. Panel B shows significantly mutated genes, as identified by the MuSiC analysis suite,20 and the number of samples with each mutation. Panel C shows the number of discrete clusters of mutations with distinct variant allele frequencies (VAFs) for each of 50 samples that underwent whole-genome sequencing. Each discrete VAF cluster represents a founding clone or a subclone derived from it.17,18 Samples with one clone have only a founding clone, those with two clones have a founding clone and one subclone, those with three clones have a founding clone and two subclones, and so forth. Exome sequencing defined too few mutations to accurately define subclones. Each sample contained evidence of a single founding clone, and most had one or more subclones derived from the founding clone. The French–American–British (FAB) subtypes of the samples are designated. (See Table 1 for FAB subtypes of AML.)
A total of 260 genes had somatic mutations in at least 2 of the 200 samples; in 154 of these genes, more than one mutation was nonsynonymous. An additional 1623 genes were found to have a validated tier 1 mutation in one sample. Using the significantly mutated gene (SMG) test in the Mutational Significance in Cancer (MuSiC) suite of tools,20 we identified 23 genes with a higher-than-expected mutation prevalence (false discovery rate, <0.05), including genes that are well established as being relevant to AML pathogenesis (e.g., DNMT3A, FLT3, NPM1, IDH1, IDH2, and CEBPA), along with genes that have only recently been implicated in AML pathogenesis, including U2AF1, EZH2, SMC1A, and SMC3 (Fig. 1B, and Table S7 in the Supplementary Appendix).
We also identified and verified all variants in noncoding regions in the 50 sample pairs that we analyzed using whole-genome sequencing. After the exclusion of 1 tumor sample, from Patient 817156, that had a high level of AML tumor cells (36%) in the skin sample (Table S1 in the Supplementary Appendix), the median number of non-coding mutations in tumor samples was 394, ranging from 68 to 1298. There was a strong correlation between the number of coding and noncoding mutations in each genome (Pearson’s correlation coefficient, 0.78), suggesting that most of the mutations were randomly distributed throughout each genome. Most mutations in AML genomes are probably background events that occurred in hematopoietic stem cells before the initiating event occurred; the clonal expansion of these cells captures their mutational history, as reportedly previously.17 This is also the reason why nearly all mutations in AML genomes are present in nearly all the cells in each sample.17 The results of an analysis of recurrently mutated regions in tiers 2 and 3 (nongenic regions11) are presented in Table S8 in the Supplementary Appendix, as are data for mitochondrial variants (Table S9 in the Supplementary Appendix); the relevance of these events to pathogenesis is unclear.
Using deep digital sequencing, we verified all tier 2 and 3 variants that were discovered with the use of whole-genome sequencing. This provided a large number of sites for variant allele frequency (VAF)–based cluster analysis, which allowed us to define the clonal composition of each tumor.17,18 More than half the tumors contained both a founding clone (the clone with the highest VAF values) and at least one subclone; we were able to identify as many as three independent subclones in one tumor sample (Fig. 1C, and Table S1 in the Supplementary Appendix). The coverage provided by whole-genome sequencing in this study (mean, 30.54×) limited the power to detect small sub-clones with VAFs of less than 10% (Fig. S3A in the Supplementary Appendix). Exome sequencing produced a higher level of coverage for the targeted sequences (mean, 167.50×), slightly increasing our ability to detect mutations with VAFs of less than 10%. However, the difference between the number of tier 1 mutations detected with whole-genome sequencing (14.5 per sample) and the number detected with exome sequencing (12.7 per sample) was not significant (P = 0.17) (Table S6 in the Supplementary Appendix). The mutational spectrum of all validated SNVs for all 200 samples is shown in Figure S3B in the Supplementary Appendix; transitions were the most common mutation type, as reported previously.17,18
EXPRESSION OF MUTANT ALLELES
Analysis of RNA sequences revealed allelic bias for mutations in several genes. We observed increased or exclusive expression of the mutant DNMT3A, RUNX1, PHF6, and TP53 in several cases (Fig. S4A through S4F in the Supplementary Appendix). Loss of heterozygosity or partial uniparental disomy explained the enrichment of mutant allele expression in most samples; epigenetic modifications (e.g., altered patterns of DNA or histone methylation) may be responsible for the rest.
miRNA VARIANTS
We identified somatic SNVs in miRNA genes in 7 of 200 samples (4%) (Table S10 in the Supplementary Appendix). Of these 7 samples, 4 had mutations in miR-142 that were localized to the seed region of the mature strand (a sequence from the 3′ region called miR-142-3p) and were likely to affect messenger RNA (mRNA) target specificity (Fig. S5A in the Supplementary Appendix). The expression of miR-142-3p and miR-142-5p (a sequence from the 5′ region) is thought to be restricted primarily to the hematopoietic compartment.21,22 Data from miRNA sequencing showed that miR-142 was highly expressed in AML samples (Fig. S5B in the Supplementary Appendix). The mutated miR-142 alleles were expressed at levels similar to those of the nonmutated allele in all samples (Fig. S5C in the Supplementary Appendix). Although miR-142 mutations have not previously been identified, several reports have linked aberrant expression of miR-142-3p with hematologic cancers, including precursor B-cell23 and T-cell24,25 acute lymphoblastic leukemia and AML.26 The remaining mutations in miRNA genes were localized to precursor miRNAs (in 3 samples) or to a nonseed region of a mature miRNA (in 1 sample).
GERMLINE VARIANTS
We identified all the variants predicted to cause mRNA truncation that were found in both the skin and tumor samples (see the Results section, Table S11, and Fig. S6 in the Supplementary Appendix). However, very few of the genes with truncation variants were found to be expressed in most AML samples (including the samples carrying the variants themselves), suggesting that most of the inherited truncating variants were probably irrelevant for pathogenesis.
FUNCTIONAL CATEGORIZATION OF MUTATED GENES
We used complementary approaches to identify combinations of mutations in the samples; for this analysis, we considered only nonsynonymous mutations (Fig. 2). Using the HotNet algorithm,27 we identified six subnetworks of a genome-scale protein–protein interaction network that had significant mutations (P<0.001). These included portions of known pathways and protein complexes, including the cohesin complex17 (Fig. S7 in the Supplementary Appendix).
Figure 2. Organization of Mutations into Categories of Related Genes.
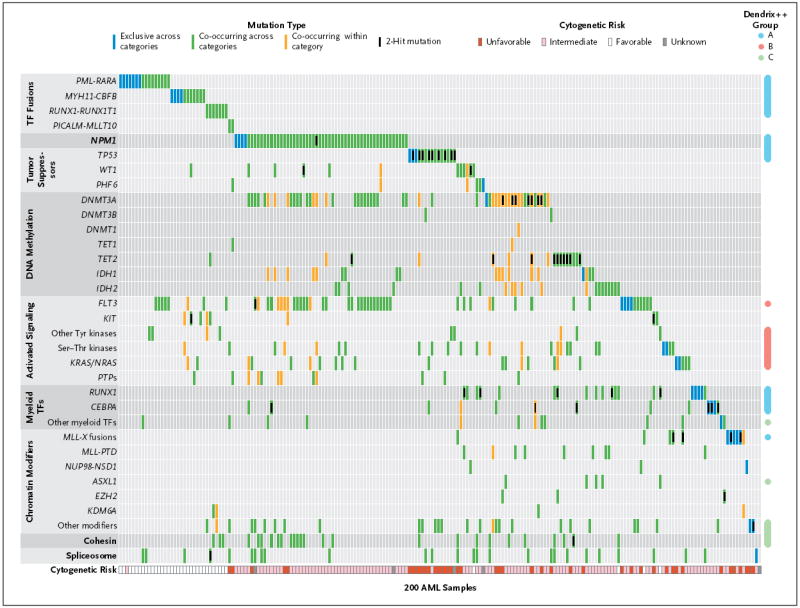
Shown are somatic, nonsynonymous mutations in individual genes and sets of genes, grouped into nine categories, including one single-gene category, as labeled on the left. Of the 200 samples evaluated, 199 (>99%) had at least one mutation in one of the listed genes or sets. Blue boxes indicate mutations that are exclusive across all categories; green boxes, mutations that co-occur in the same sample across different categories; and orange boxes, mutations that co-occur in the same sample in the same category. Computational analysis with the use of the Dendrix++ algorithm identified three significant, mutually exclusive groups of genes, annotated on the right as groups A, B, and C. The cytogenetic risk for each patient is shown at the bottom of the chart. Additional information about data in this figure is provided in Tables S17 through S20 in the Supplementary Appendix. Ser–Thr denotes serine–threonine, TF transcription factor, and Tyr tyrosine.
We grouped mutations into larger sets or pathways and examined patterns of mutual exclusivity and co-occurrence between these groups. Of 200 samples, 199 (>99%) contained at least one mutation in one of nine categories that were defined according to biologic function and that have a putative role in AML pathogenesis: transcription-factor fusions (18% of cases), the gene encoding nucleophosmin (NPM1) (27%), tumor-suppressor genes (16%), DNA-methylation–related genes (44%), activated signaling genes (59%), chromatin-modifying genes (30%), myeloid transcription-factor genes (22%), cohesin-complex genes (13%), and spliceosome-complex genes (14%) (Fig. 2, and Fig. S8 in the Supplementary Appendix). For all genes that had mutations in only a small number of samples, the pathophysiological relevance of the events will require further validation. FLT3 mutations were identified in 56 samples, and an additional 62 samples were found to have mutations in genes encoding other kinases, phosphatases, or RAS family proteins (Fig. S9 in the Supplementary Appendix). However, most of these genes contained mutations in only 1 to 3 samples (with the exception of KIT, KRAS, NRAS, and PTPN11). In total, 59% of samples had a mutation in a gene encoding a signaling protein.
To more fully assess patterns of mutual exclusivity and co-occurrence between sets of genes, we applied Dendrix++ (see the Materials section in the Supplementary Appendix) to the mutation matrix. Dendrix++ identified three sets of genes with the strongest patterns of mutual exclusivity (groups A, B, and C) (Fig. 2). The most statistically significant set included the transcription-factor fusion genes, NPM1, RUNX1, TP53, and CEBPA (Fig. S10 in the Supplementary Appendix). The second most significant set showed exclusivity between mutations in FLT3 and in genes encoding other tyrosine kinases, serine–threonine kinases, protein tyrosine phosphatases, and RAS family proteins (Fig. S9 in the Supplementary Appendix). The third set included mutations in ASXL1 and in genes encoding components of the cohesin complex, other myeloid transcription factors, and other epigenetic modifiers (Fig. S10 in the Supplementary Appendix). Mutations within the spliceosome gene set, genes encoding other epigenetic modifiers, and genes encoding myeloid transcription factors also showed considerable mutual exclusivity within each set (Fig. S11 in the Supplementary Appendix).
Among the pairwise relationships between mutations in the AML samples, the most prominent was the significant co-occurrence between mutations in FLT3, DNMT3A, and NPM1 (Fig. S8 in the Supplementary Appendix). In particular, many samples had mutations both in NPM1 and DNMT3A or in NPM1 and FLT3. The likelihood that these mutations occurred together by chance is extremely small (P<6.3×10⁻⁷ for NPM1 and DNMT3A and P<1.9×10⁻⁶ for NPM1 and FLT3). This observation, combined with the strong association between samples having concurrent mutations in NPM1, FLT3, and DNMT3A and distinct clusters in mRNA, miRNA, and DNA methylation, suggests that samples with mutations in all three genes represent a novel subtype of AML. Furthermore, we observed relationships of strong mutual exclusivity. For example, PML-RARA, MYH11-CBFB, and _MLL_-containing fusion genes were mutually exclusive of mutations in NPM1 and DNMT3A (P<0.007, P<0.04, and P<0.04, respectively), and RUNX1 and TP53 mutations were mutually exclusive of FLT3 and NPM1 mutations. Table S12 in the Supplementary Appendix contains a full list of genes or gene sets with significant co-occurrences or exclusivity among the samples.
GENE FUSIONS
De novo assembly of RNA-sequencing data28 for 179 AML samples identified 118 gene fusions in 80 samples (mean, 1.5 per sample), of which 71 were distinct events (Fig. 3A)29; 99 samples had no detected fusions (Table S13 in the Supplementary Appendix). The range of fusions per sample was 0 to 8. The 74 in-frame fusions included many previously described, recurrent events, including PML-RARA, MYH11-CBFB, RUNX1-RUNX1T1, BCR-ABL1, PICALM-MLLT10/AF10, NUP98-NSD1, and multiple fusions involving MLL (Fig. 3B). We identified 15 new fusion events that maintained an open reading frame. Although none of them were recurrent in this cohort, several of the genes in the fusions were mutated or translocated in other samples of AML that we analyzed (i.e., MLLT10/AF10, NF1, GRID1, PPP2R1B, XIAP, ATP1B4, WSB1, KIAA0999, TBX15, and LRRC37B). An additional 42 gene fusions were out-of-frame (Fig. 3C), creating a truncated upstream gene or potential haploinsufficiency for both partner genes, with many that were mutated or translocated in other AML samples (including RUNX1, DNMT3B, MLLT10/AF10, NSD1, EDIL3, SCARB1, XIAP1, PPP2R1B, FOXP1, KSR2, MLL3, and CUL1). One out-of-frame fusion (GAS6-FAM70B) was detected in three AML samples, and one of its fusion partners (FAM70B P233L) was mutated in another sample. Most of the newly described fusion events in these samples were not detected by means of routine cytogenetic studies (Table S1 in the Supplementary Appendix).
Figure 3. AML Gene Fusions.
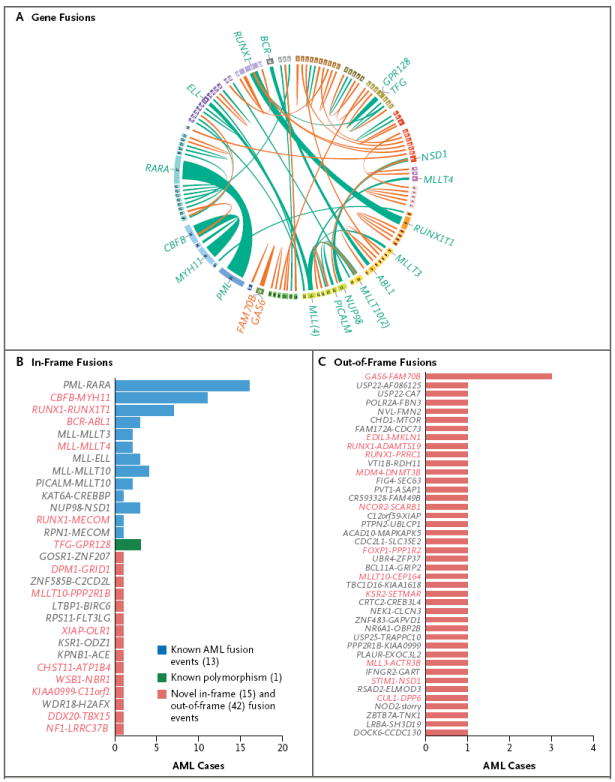
Panel A is a plot created with the use of Circos software29 showing in-frame (green) and out-of-frame (orange) gene fusions detected in the AML cohort in the Cancer Genome Atlas (TCGA) with the use of Trans-ABySS software.28 Ribbon widths are proportional to the frequency of a fusion event. Chromosomes are individually colored and are arranged clockwise from chromosome 1 to X, starting with chromosome 1 at 12 o’clock. No rearrangements involved the Y chromosome. The frequencies of in-frame and out-of-frame gene fusions are shown in Panels B and C, respectively. For gene names shown in red, one of the partner genes in that fusion was found to be mutated in at least one other AML sample from this data set. On the basis of chromosomal aberrations and genomic variants annotated in the Mitelman database from the Cancer Genome Anatomy Project (CGAP) (http://cgap.nci.nih.gov/Chromosomes/Mitelman), all previously identified gene fusions are shown in blue, a single known polymorphic fusion is shown in green, and all novel events are shown in red.
GENE-EXPRESSION ANALYSIS
Unsupervised non-negative matrix factorization (NMF) consensus clustering (i.e., clustering data with inputs consisting only of gene or miRNA abundance information) suggested an optimum of seven RNA-sequencing groups and five miRNA-sequencing groups (Fig. S12 in the Supplementary Appendix). Associations between these groups and overall survival are shown in Fig. S13 in the Supplementary Appendix; the groups enriched for samples containing PML-RARA had better outcomes than other groups, as expected. The RNA-sequencing groups were highly concordant with a microarray data set for the same 178 samples (Fig. S14 in the Supplementary Appendix).
We used one-sided Fisher’s exact tests (corrected for multiple testing) to identify significant associations (P<0.05) between specific RNA-sequencing and miRNA-sequencing groups and covariates (Fig. 4). RNA-sequencing group 4 was associated with subtype M1 (AML with minimal maturation) in the French–American–British (FAB) classification of acute leukemias, group 3 with FAB subtype M3 (acute promyelocytic leukemia), group 5 with FAB subtype M4 (acute myelomonocytic leukemia), and group 7 with FAB subtype M5 (acute monoblastic or monocytic leukemia) (Fig. 4A). Concordance between gene-expression groups and FAB subtypes was similar to that previously reported for microarray data30,31 and showed that some expression signatures were strongly correlated with the stage of myeloid differentiation of the AML sample.
Figure 4. Unsupervised RNA and miRNA Expression Patterns.
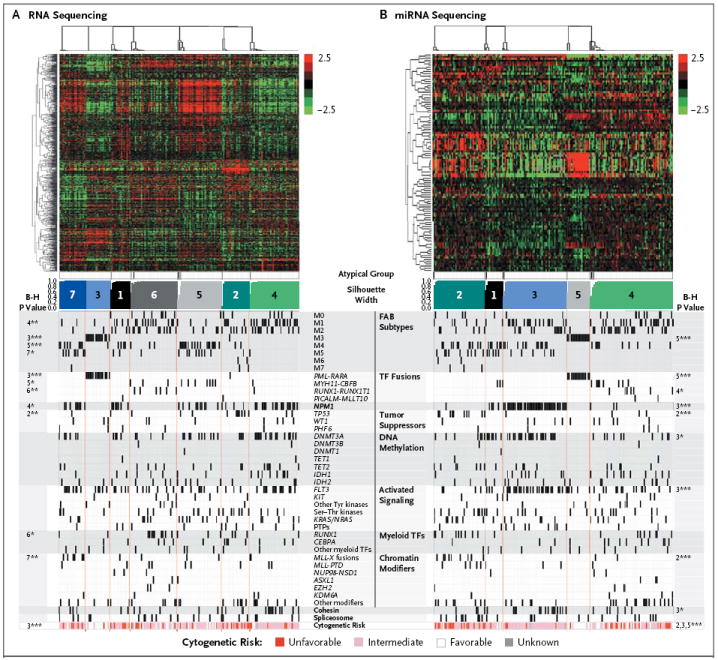
Shown are unsupervised consensus clusters for data obtained with the use of messenger RNA sequencing (Panel A) and microRNA (miRNA) sequencing (Panel B). Shown from top to bottom are RNA abundance heatmaps, with each messenger RNA or miRNA centered on its mean; atypical members of each group (shown in black), which have silhouette widths below 0.9 of the group’s maximum width; a silhouette-width profile (i.e., a dimensionless metric that reflects how well samples fit into compact and distinct clusters) that was calculated from the consensus membership matrix; and covariates (e.g., FAB subtypes), with P values for association corrected for multiple testing, at the far left and far right (see the Methods section in the Supplementary Appendix). B-H denotes Benjamini–Hochberg multiple-testing correction. The numbers refer to the silhouette-width profiles for which P values are provided. One asterisk denotes P<0.05, two asterisks P<0.01, and three asterisks P<0.001. The color scales for both heatmaps reflect mean-normalized log2 abundances, with RPKM (reads per kilobase of exon model per million mapped reads) for RNA-sequencing data and log2 RPM (reads per million) for miRNA-sequencing data. The scale-bar numbers (−2.5 for least abundant to 2.5 for most abundant) indicate the range of log2 mean-centered abundance values in the heatmaps. Cytogenetic-risk profiles are shown at the bottom of the chart.
For the miRNA-sequencing data, group 5 was associated with FAB subtype M3, and groups 2, 3, and 5 were associated with unfavorable, intermediate, and favorable cytogenetic risk categories, respectively. Group 3 was strongly associated with mutations in NPM1, DNMT3A, FLT3, and genes encoding the cohesin complex; miR-10a was expressed at high levels in this group, an observation that is consistent with reports correlating high miR-10a expression and NPM1 mutations32,33 (Fig. 4B). Levels of miR-424 were relatively low in this group, making miR-424 the second-most discriminatory miRNA — an observation that is consistent with the findings in a previous study.34 The data also confirmed that miR-196b, miR-130a, and let-7b were discriminatory in this group.35 Additional comparisons with published sets of expression data are provided in the Materials section in the Supplementary Appendix.
DNA-METHYLATION ANALYSIS
Unsupervised analysis of changes in DNA methylation revealed significant differences among subsets of samples, particularly in CpG-sparse regions of the genome (Fig. 5).36 Samples with IDH1 and IDH2 mutations showed extensive gains of methylation relative to CD34+CD38− cells obtained from healthy donors (Table S14 in the Supplementary Appendix), whereas some samples with MLL fusions or co-occurring NPM1, DNMT3A, and FLT3 mutations were associated with extensive loss of DNA methylation, as compared with normal CD34+CD38− cells. Specific patterns of methylation gain and loss distinguished samples with CEBPA mutations, as well as samples with PML-RARA, RUNX1-RUNX1T1, or MYH11-CBFB fusions. Significant changes in DNA methylation were identified across AML samples at 160,519 CpG loci (42% of sites tested), with 67% resulting in a gain of methylation and 33% resulting in a loss (see the Methods section and Table S15 in the Supplementary Appendix). Samples with triple mutations in NPM1, DNMT3A, and FLT3 showed methylation losses at 328 of 382 differentially methylated regions larger than 1 kb (86%), as compared with CD34+CD38− cells from healthy donors. Although both intergenic and genic regions were affected, approximately 71% of these changes were in coding regions (Table S16 in the Supplementary Appendix).
Figure 5. Unsupervised Analysis of DNA Methylation at Extremes of CpG Density.
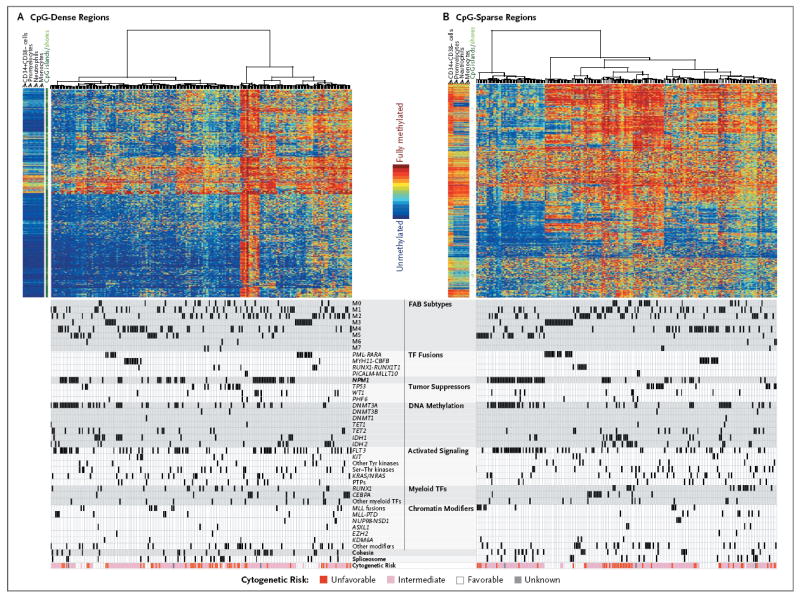
DNA-methylation values for specific CpG residues are shown as a proportion, ranging from 0% (unmethylated, in blue) to 100% (fully methylated, in red), for unsupervised clustering of CpG-dense regions of the genome (Panel A) and of CpG-sparse regions (Panel B). Covariates are shown below the corresponding samples. Data for CD34+CD38− bone marrow cells, promyelocytes, neutrophils, and monocytes from three healthy volunteers are plotted to the left of the data for 192 AML samples in each panel. CpG islands and shores are annotated in dark green and light green, respectively, in the space between the normal and AML samples. CpG density was computed as the ratio of observed to expected CG dinucleotides in a 3-kb window, as described by Saxonov et al.36 The 1000 most variable loci among those falling into the top and bottom 5% according to CpG density are plotted in Panels A and B, respectively. Cytogenetic-risk profiles are shown at the bottom of the chart.
We also assessed the relationships between gene expression and DNA methylation in pairs of data types by identifying groups in one data type that were enriched in samples from a group in the other data type (Fig. S15A through S15E in the Supplementary Appendix). Clusters containing samples of acute promyelocytic leukemia were strongly concordant for mRNA, miRNA, and CpG-sparse DNA methylation (Fig. 5, and Fig. S15 in the Supplementary Appendix). In mRNA groups 1, 2, 5, and 6, there was a preferential association with one miRNA-sequencing group each, suggesting that regulatory relationships must exist between these groups (Fig. S15A in the Supplementary Appendix). Associations in CpG-sparse DNA methylation groups were more significant for miRNA groups than for mRNA groups, suggesting the existence of previously unrecognized epigenetic regulatory pathways (Fig. S15B through S15E in the Supplementary Appendix). Genes defining the RNA- and miRNA-sequencing groups are shown in Figure S16 in the Supplementary Appendix; a very striking set of small RNA genes within an imprinted locus on chromosome 14 were found to be consistently dysregulated in acute promyelocytic leukemia (Fig. S17 in the Supplementary Appendix).37
DISCUSSION
Of the adult cancer types that have been extensively sequenced to date, AML has had the fewest mutations discovered (Fig. S18 in the Supplementary Appendix). The average number of coding mutations (SNVs and indels) per patient in this study was 13, of which only 5 were recurrently mutated in each genome. There was little evidence of genomic instability in most AML genomes. However, a small number of patients had an unfavorable-risk (complex) cytogenetic profile that was strongly associated with mutations in TP53, which confirmed a recently reported relationship.38 Adult AML genomes contain a median of only one somatic copy-number variant and an average of less than one gene-fusion event (generally caused by translocations).1,2
The organization of mutated genes into nine functionally related categories revealed many potentially important biologic relationships. The transcription-factor fusions were the first recognized somatic mutations in AML genomes,1,2 and all such fusions have been shown to be relevant for disease initiation in mice.39-42 Our data show that some mutations that are common in AML (e.g., in DNMT3A, NPM1, CEPBA, IDH1/2, and RUNX1) are mutually exclusive of the transcription-factor fusions, suggesting that these mutations may have functions in the initiation of AML that are similar to the functions of fusion genes. We also identified a pattern of mutual exclusivity for mutations in genes within certain biologic classes, including those encoding the cohesins, proteins of the spliceosome, signaling proteins, and histone-modifying proteins, suggesting that one mutation in these pathways is generally adequate for AML pathogenesis. Although a common model of AML pathogenesis has suggested that an activating mutation in a gene encoding a signaling protein might be a requirement for pathogenesis,43 only 59% of the patients in our study had a mutation in a gene annotated to suggest a role in signaling.
We integrated the expression data for both mRNA and miRNA with all the clinical and mutational data for all genomes. That analysis revealed that the differentiation state of the AML sample was highly correlated with the expression signature, as reported previously.44 Patients who had PML-RARA fusions had very distinct mRNA and miRNA signatures that were strongly correlated with each other and with a specific DNA methylation signature.45 All the transcription-factor fusions were correlated with specific patterns of mRNA expression, whereas PML-RARA and RUNX1-RUNX1T1 (and some MLL fusions) were also associated with miRNA expression signatures. In addition, occurrence of NPM1, DNMT3A, and FLT3 mutations together was strongly associated with specific expression signatures for both mRNA and miRNA. These data suggest that this combination of mutations in patients with intermediate-risk AML may identify a subtype of AML with unique epigenetic features. Our analysis of methylation patterns corroborates previous reports of methylation signatures in CpG islands for transcription-factor fusions and IDH1/2 mutations46,47 but surprisingly revealed that the strongest methylation signatures occur in CpG-sparse regions of the genome. Although the significance of this finding is not yet clear, the widespread and variable losses of methylation in these regions are consistent with observations from analyses of epithelial tumors48 and support the idea that methylation patterns in gene bodies and intergenic regions are important for the regulation of gene expression.49
This data set will be available to provide a framework for future studies that pertain to the molecular classification of patients with AML. The identification of many potentially important relationships among recurrently mutated AML genes and pathways provides a comprehensive foundation for an understanding of the genetic rules of pathogenesis.
Supplementary Material
Supplement1
Acknowledgments
The views expressed in this article are those of the authors and do not reflect the official policy of the National Institutes of Health.
Supported by grants from the National Institutes of Health (U24CA143845, U24CA143858, U24CA144025, U24CA143882, U24CA143866, U24CA143867, U24CA143848, U24CA143840, U24CA143835, U24CA143799, U24CA143883, U24CA143843, U54HG003067, U54HG003079, U54HG003273, and P01CA101937).
We thank our patients for participating in this study; J. Peck, H. Black, G. Carnoske, and N. Reidelberger for providing administrative support; and L. Lund for performing administrative coordination of TCGA activities.
Glossary
Comparative genomic hybridization
An array-based method that permits comparison of DNA abundance throughout the genome between two DNA samples to identify regions where DNA copies have been gained or lost.
DNA methylation
This generally refers to the addition of a methyl group to the 5-carbon of the pyrimidine ring of cytosine, usually pertaining to cytosines that precede a guanine residue in DNA (a CpG dinucleotide motif). DNA methylation of CpG-rich regions (CpG islands) is often associated with repression of nearby genes.
MicroRNA
A short regulatory form of RNA that binds to a target RNA and suppresses its translation or alters its stability.
Single-nucleotide polymorphism (SNP) array
A microarray-based assay system that allows for simultaneous measurement of nucleotide sequence of hundreds of thousands of SNPs throughout the genome in a DNA sample. Acquired copy-number variants can sometimes be detected with SNP arrays by comparing signals from the tumor and normal samples obtained from the same individual.
Single-nucleotide variant (SNV)
A difference in a DNA sequence at a single position in the genome, as compared with the reference genome; each variant may represent either an inherited or an acquired (somatic) change. SNPs generally represent inherited changes only.
Variant-allele clusters
Groups of mutations with similar variant allele frequencies, defined by statistical approaches. A large group of mutations with variant-allele frequencies of approximately 50% generally represents the founding clone of that tumor.
Variant-allele frequency (VAF)
The relative proportion of sequencing reads from a variant allele (i.e., somatic mutation) in a tumor sample. The VAF can be used to estimate the fraction of cells within a sample that contain that variant. For example, variant alleles with a VAF of 50% usually represent heterozygous somatic mutations that are present in all cells within the sample. Variant alleles with lower VAFs are generally present in only a fraction of the cells in a sample, which may represent subclones derived from the founding clone of a tumor.
Whole-exome sequencing
Sequencing of the coding regions, or exons, of an entire genome from a single individual.
Whole-genome sequencing
Determination of the primary nucleotide sequence of the entire genome from a single individual.
APPENDIX
The members of the Cancer Genome Atlas Research Network and their affiliations are as follows: Timothy J. Ley, M.D., the Genome Institute at Washington University and Siteman Cancer Center, St. Louis; Christopher Miller, Ph.D., and Li Ding, Ph.D., the Genome Institute at Washington University, St. Louis; Benjamin J. Raphael, Ph.D., Brown University and Center for Computational Molecular Biology, Providence, RI; Andrew J. Mungall, Ph.D., and A. Gordon Robertson, Ph.D., British Columbia Cancer Agency’s Genome Sciences Centre, Vancouver, Canada; Katherine Hoadley, Ph.D., University of North Carolina, Lineberger Comprehensive Cancer Center, Chapel Hill; Timothy J. Triche, Jr., M.S., and Peter W. Laird, Ph.D., University of Southern California, Epigenome Center, Los Angeles; Jack D. Baty, B.A., Washington University, St. Louis; Lucinda L. Fulton, M.S., and Robert Fulton, M.S., the Genome Institute at Washington University, St. Louis; Sharon E. Heath, Washington University, St. Louis; Joelle Kalicki-Veizer, B.S., and Cyriac Kandoth, Ph.D., the Genome Institute at Washington University, St. Louis; Jeffery M. Klco, M.D., Ph.D., Washington University, St. Louis; Daniel C. Koboldt, M.S., and Krishna-Latha Kanchi, M.S., the Genome Institute at Washington University, St. Louis; Shashikant Kulkarni, M.S., Ph.D., F.A.C.M.G., and Tamara L. Lamprecht, B.S., Washington University, St. Louis; David E. Larson, Ph.D., Ling Lin, M.S., Charles Lu, Ph.D., Michael D. McLellan, B.S., and Joshua F. McMichael, B.S., the Genome Institute at Washington University, St. Louis; Jacqueline Payton, M.D., Ph.D., Washington University, St. Louis; Heather Schmidt, B.S., the Genome Institute at Washington University, St. Louis; David H. Spencer, M.D., Ph.D., Washington University, St. Louis; Michael H. Tomasson, M.D., Washington University and Siteman Cancer Center, St. Louis; John W. Wallis, Ph.D., the Genome Institute at Washington University, St. Louis; Lukas D. Wartman, M.D., Mark A. Watson, M.D., Ph.D., and John Welch, M.D., Ph.D., Washington University, St. Louis; Michael C. Wendl, Ph.D., the Genome Institute at Washington University, St. Louis; Adrian Ally, B.Sc., Miruna Balasundaram, B.A.Sc., Inanc Birol, Ph.D., Yaron Butterfield, B.Sc., Readman Chiu, M.Sc., Andy Chu, B.Sc., Eric Chuah, B.Sc., Hye-Jung Chun, M.Sc., Richard Corbett, M.Sc., Noreen Dhalla, B.Sc., Ranabir Guin, B.A.Sc., An He, M.Sc., Carrie Hirst, B.Sc., Martin Hirst, Ph.D., Robert A. Holt, Ph.D., Steven Jones, Ph.D., Aly Karsan, M.D., Darlene Lee, Haiyan I. Li, M.Sc., Marco A. Marra, Ph.D., Michael Mayo, B.Sc., Richard A. Moore, Ph.D., Karen Mungall, B.Sc., Jeremy Parker, Ph.D., Erin Pleasance, Ph.D., Patrick Plettner, B.Sc., Jacquie Schein, M.Sc., Dominik Stoll, Ph.D., Lucas Swanson, M.Sc., Angela Tam, B.Sc., Nina Thiessen, M.S., Richard Varhol, M.Sc., Natasja Wye, B.Sc., and Yongjun Zhao, M.Sc., D.V.M., British Columbia Cancer Agency’s Genome Sciences Centre, Vancouver, Canada; Stacey Gabriel, Ph.D., Gad Getz, Ph.D., Carrie Sougnez, B.S., and Lihua Zou, Ph.D., Broad Institute of Harvard and Massachusetts Institute of Technology, Cambridge, MA; Mark D.M. Leiserson, B.A., Fabio Vandin, Ph.D., and Hsin-Ta Wu, M.Sc., Brown University and Center for Computational Molecular Biology, Providence, RI; Frederick Applebaum, M.D., Fred Hutchinson Cancer Research Center, Division of Medical Oncology, Seattle Cancer Care Alliance, Seattle; Stephen B. Baylin, M.D., Johns Hopkins University, Baltimore; Rehan Akbani, Ph.D., Bradley M. Broom, Ph.D., Ken Chen, Ph.D., Thomas C. Motter, B.A., Khanh Nguyen, M.D., John N. Weinstein, M.D., Ph.D., and Nianziang Zhang, Ph.D., University of Texas M.D. Anderson Cancer Center, Houston; Martin L. Ferguson, Ph.D., MLF Consulting and Biotechnology Consultant, Boston; Christopher Adams, B.S., Aaron Black, B.A., Jay Bowen, M.S., Julie Gastier-Foster, Ph.D., Thomas Grossman, M.D., Ph.D., Tara Lichtenberg, B.A., and Lisa Wise, the Research Institute at Nationwide Children’s Hospital, Columbus, OH; Tanja Davidsen, Ph.D., John A. Demchok, M.S., Kenna R. Mills Shaw, Ph.D., and Margi Sheth, B.S., National Cancer Institute, Bethesda, MD; Heidi J. Sofia, Ph.D., M.P.H., National Human Genome Research Institute, Bethesda, MD; Liming Yang, Ph.D., National Cancer Institute, Bethesda, MD; James R. Downing, M.D., St. Jude Children’s Research Hospital, Memphis; Greg Eley, Ph.D., Sciementis LLC, Statham, GA; Shelley Alonso, Brenda Ayala, B.Sc., Julien Baboud, M.S., Mark Backus, Ph.D., Sean P. Barletta, B.S., Dominique L. Berton, M.S.C.S., Anna L. Chu, B.Sc., Stanley Girshik, M.S., Mark A. Jensen, Ph.D., Ari Kahn, Ph.D., Prachi Kothiyal, Ph.D., Matthew C. Nicholls, M.S., Todd D. Pihl, Ph.D., David A. Pot, Ph.D., Rohini Raman, B.E., Rashmi N. Sanbhadti, B.S., Eric E. Snyder, Ph.D., Deepak Srinivasan, M.S., Jessica Walton, M.S., Yunhu Wan, Ph.D., and Zhining Wang, Ph.D., SRA International, Fairfax, VA; Jean-Pierre J. Issa, M.D., Temple University, Philadelphia; Michelle Le Beau, Ph.D., University of Chicago, Chicago; Martin Carroll, M.D., University of Pennsylvania, Philadelphia; Hagop Kantarjian, M.D., and Steven Kornblau, M.D., University of Texas M.D. Anderson Cancer Center, Houston; Moiz S. Bootwalla, B.Sc., M.S., M.Sc., Phillip H. Lai, B.Sc., Hui Shen, B.Sc., David J. Van Den Berg, Ph.D., and Daniel J. Weisenberger, Ph.D., University of Southern California, Epigenome Center, Los Angeles; Daniel C. Link, M.D., and Matthew J. Walter, M.D., Washington University and Siteman Cancer Center, St. Louis; Bradley A. Ozenberger, Ph.D., National Human Genome Research Institute, Bethesda, MD; Elaine R. Mardis, Ph.D., the Genome Institute at Washington University, St. Louis; Peter Westervelt, M.D., Ph.D., Timothy A. Graubert, M.D., and John F. DiPersio, M.D., Ph.D., Washington University and Siteman Cancer Center, St. Louis; and Richard K. Wilson, Ph.D., the Genome Institute at Washington University, St. Louis.
Footnotes
Disclosure forms provided by the authors are available with the full text of this article at NEJM.org.
A video detailing the findings of this study is available at NEJM.org
References
- 1.Rowley JD. Chromosomal translocations: revisited yet again. Blood. 2008;112:2183–9. doi: 10.1182/blood-2008-04-097931. [DOI] [PubMed] [Google Scholar]
- 2.Mrózek K, Heerema NA, Bloomfield CD. Cytogenetics in acute leukemia. Blood Rev. 2004;18:115–36. doi: 10.1016/S0268-960X(03)00040-7. [DOI] [PubMed] [Google Scholar]
- 3.Walter MJ, Payton JE, Ries RE, et al. Acquired copy number alterations in adult acute myeloid leukemia genomes. Proc Natl Acad Sci U S A. 2009;106:12950–5. doi: 10.1073/pnas.0903091106. [DOI] [PMC free article] [PubMed] [Google Scholar]
- 4.Bullinger L, Krönke J, Schön C, et al. Identification of acquired copy number alterations and uniparental disomies in cytogenetically normal acute myeloid leukemia using high-resolution single-nucleotide polymorphism analysis. Leukemia. 2010;24:438–49. doi: 10.1038/leu.2009.263. [DOI] [PubMed] [Google Scholar]
- 5.Suela J, Alvarez S, Cigudosa JC. DNA profiling by arrayCGH in acute myeloid leukemia and myelodysplastic syndromes. Cytogenet Genome Res. 2007;118:304–9. doi: 10.1159/000108314. [DOI] [PubMed] [Google Scholar]
- 6.Stirewalt DL, Radich JP. The role of FLT3 in haematopoietic malignancies. Nat Rev Cancer. 2003;3:650–65. doi: 10.1038/nrc1169. [DOI] [PubMed] [Google Scholar]
- 7.Bacher U, Schnittger S, Haferlach T. Molecular genetics in acute myeloid leukemia. Curr Opin Oncol. 2010;22:646–55. doi: 10.1097/CCO.0b013e32833ed806. [DOI] [PubMed] [Google Scholar]
- 8.Patel JP, Gönen M, Figueroa ME, et al. Prognostic relevance of integrated genetic profiling in acute myeloid leukemia. N Engl J Med. 2012;366:1079–89. doi: 10.1056/NEJMoa1112304. [DOI] [PMC free article] [PubMed] [Google Scholar]
- 9.Yamashita Y, Yuan J, Suetake I, et al. Array-based genomic resequencing of human leukemia. Oncogene. 2010;29:3723–31. doi: 10.1038/onc.2010.117. [DOI] [PubMed] [Google Scholar]
- 10.Ley TJ, Ding L, Walter MJ, et al. DNMT3A mutations in acute myeloid leukemia. N Engl J Med. 2010;363:2424–33. doi: 10.1056/NEJMoa1005143. [DOI] [PMC free article] [PubMed] [Google Scholar]
- 11.Mardis ER, Ding L, Dooling DJ, et al. Recurring mutations found by sequencing an acute myeloid leukemia genome. N Engl J Med. 2009;361:1058–66. doi: 10.1056/NEJMoa0903840. [DOI] [PMC free article] [PubMed] [Google Scholar]
- 12.Shen Y, Zhu YM, Fan X, et al. Gene mutation patterns and their prognostic impact in a cohort of 1185 patients with acute myeloid leukemia. Blood. 2011;118:5593–603. doi: 10.1182/blood-2011-03-343988. [DOI] [PubMed] [Google Scholar]
- 13.Breems DA, Van Putten WL, De Greef GE, et al. Monosomal karyotype in acute myeloid leukemia: a better indicator of poor prognosis than a complex karyotype. J Clin Oncol. 2008;26:4791–7. doi: 10.1200/JCO.2008.16.0259. [DOI] [PubMed] [Google Scholar]
- 14.Byrd JC, Mrózek K, Dodge RK, et al. Pretreatment cytogenetic abnormalities are predictive of induction success, cumulative incidence of relapse, and overall survival in adult patients with de novo acute myeloid leukemia: results from Cancer and Leukemia Group B (CALGB 8461) Blood. 2002;100:4325–36. doi: 10.1182/blood-2002-03-0772. [DOI] [PubMed] [Google Scholar]
- 15.Dohner H, Estey EH, Amadori S, et al. Diagnosis and management of acute myeloid leukemia in adults: recommendations from an international expert panel, on behalf of the European LeukemiaNet. Blood. 2010;115:453–74. doi: 10.1182/blood-2009-07-235358. [DOI] [PubMed] [Google Scholar]
- 16.Mrózek K, Marcucci G, Nicolet D, et al. Prognostic significance of the European LeukemiaNet standardized system for reporting cytogenetic and molecular alterations in adults with acute myeloid leukemia. J Clin Oncol. 2012;30:4515–23. doi: 10.1200/JCO.2012.43.4738. [DOI] [PMC free article] [PubMed] [Google Scholar]
- 17.Welch JS, Ley TJ, Link DC, et al. The origin and evolution of mutations in acute myeloid leukemia. Cell. 2012;150:264–78. doi: 10.1016/j.cell.2012.06.023. [DOI] [PMC free article] [PubMed] [Google Scholar]
- 18.Ding L, Ley TJ, Larson DE, et al. Clonal evolution in relapsed acute myeloid leukaemia revealed by whole-genome sequencing. Nature. 2012;481:506–10. doi: 10.1038/nature10738. [DOI] [PMC free article] [PubMed] [Google Scholar]
- 19.Stephens PJ, Greenman CD, Fu B, et al. Massive genomic rearrangement acquired in a single catastrophic event during cancer development. Cell. 2011;144:27–40. doi: 10.1016/j.cell.2010.11.055. [DOI] [PMC free article] [PubMed] [Google Scholar]
- 20.Dees ND, Zhang Q, Kandoth C, et al. MuSiC: identifying mutational significance in cancer genomes. Genome Res. 2012;22:1589–98. doi: 10.1101/gr.134635.111. [DOI] [PMC free article] [PubMed] [Google Scholar]
- 21.Chen CZ, Li L, Lodish HF, Bartel DP. MicroRNAs modulate hematopoietic lineage differentiation. Science. 2004;303:83–6. doi: 10.1126/science.1091903. [DOI] [PubMed] [Google Scholar]
- 22.Ramkissoon SH, Mainwaring LA, Ogasawara Y, et al. Hematopoietic-specific microRNA expression in human cells. Leuk Res. 2006;30:643–7. doi: 10.1016/j.leukres.2005.09.001. [DOI] [PubMed] [Google Scholar]
- 23.Ju X, Li D, Shi Q, Hou H, Sun N, Shen B. Differential microRNA expression in childhood B-cell precursor acute lymphoblastic leukemia. Pediatr Hematol Oncol. 2009;26:1–10. doi: 10.1080/08880010802378338. [DOI] [PubMed] [Google Scholar]
- 24.Bellon M, Lepelletier Y, Hermine O, Nicot C. Deregulation of microRNA involved in hematopoiesis and the immune response in HTLV-I adult T-cell leukemia. Blood. 2009;113:4914–7. doi: 10.1182/blood-2008-11-189845. [DOI] [PMC free article] [PubMed] [Google Scholar]
- 25.Lv M, Zhang X, Jia H, et al. An oncogenic role of miR-142-3p in human T-cell acute lymphoblastic leukemia (T-ALL) by targeting glucocorticoid receptor-α and cAMP/PKA pathways. Leukemia. 2012;26:769–77. doi: 10.1038/leu.2011.273. [DOI] [PubMed] [Google Scholar]
- 26.Wang XS, Gong JN, Yu J, et al. MicroRNA-29a and microRNA-142-3p are regulators of myeloid differentiation and acute myeloid leukemia. Blood. 2012;119:4992–5004. doi: 10.1182/blood-2011-10-385716. [DOI] [PubMed] [Google Scholar]
- 27.Vandin F, Upfal E, Raphael BJ. Algorithms for detecting significantly mutated pathways in cancer. J Comput Biol. 2011;18:507–22. doi: 10.1089/cmb.2010.0265. [DOI] [PubMed] [Google Scholar]
- 28.Robertson G, Schein J, Chiu R, et al. De novo assembly and analysis of RNA-seq data. Nat Methods. 2010;7:909–12. doi: 10.1038/nmeth.1517. [DOI] [PubMed] [Google Scholar]
- 29.Krzywinski M, Schein J, Birol I, et al. Circos: an information aesthetic for comparative genomics. Genome Res. 2009;19:1639–45. doi: 10.1101/gr.092759.109. [DOI] [PMC free article] [PubMed] [Google Scholar]
- 30.Verhaak RG, Wouters BJ, Erpelinck CA, et al. Prediction of molecular subtypes in acute myeloid leukemia based on gene expression profiling. Haematologica. 2009;94:131–4. doi: 10.3324/haematol.13299. [DOI] [PMC free article] [PubMed] [Google Scholar]
- 31.Valk PJM, Verhaak RGW, Beijen MA, et al. Prognostically useful gene-expression profiles in acute myeloid leukemia. N Engl J Med. 2004;350:1617–28. doi: 10.1056/NEJMoa040465. [DOI] [PubMed] [Google Scholar]
- 32.Bryant A, Palma CA, Jayaswal V, Yang YW, Lutherborrow M, Ma DD. miR-10a is aberrantly overexpressed in nucleophosmin1 mutated acute myeloid leukaemia and its suppression induces cell death. Mol Cancer. 2012;11:8. doi: 10.1186/1476-4598-11-8. [DOI] [PMC free article] [PubMed] [Google Scholar]
- 33.Ovcharenko D, Stölzel F, Poitz D, et al. miR-10a overexpression is associated with NPM1 mutations and MDM4 down-regulation in intermediate-risk acute myeloid leukemia. Exp Hematol. 2011;39(10):1030.e7–1042.e7. doi: 10.1016/j.exphem.2011.07.008. [DOI] [PubMed] [Google Scholar]
- 34.Faraoni I, Laterza S, Ardiri D, Ciardi C, Fazi F, Lo-Coco F. MiR-424 and miR-155 deregulated expression in cytogenetically normal acute myeloid leukaemia: correlation with NPM1 and FLT3 mutation status. J Hematol Oncol. 2012;5:26. doi: 10.1186/1756-8722-5-26. [DOI] [PMC free article] [PubMed] [Google Scholar]
- 35.Marcucci G, Mrózek K, Radmacher MD, Garzon R, Bloomfield CD. The prognostic and functional role of microRNAs in acute myeloid leukemia. Blood. 2011;117:1121–9. doi: 10.1182/blood-2010-09-191312. [DOI] [PMC free article] [PubMed] [Google Scholar]
- 36.Saxonov S, Berg P, Brutlag DL. A genome-wide analysis of CpG dinucleotides in the human genome distinguishes two distinct classes of promoters. Proc Natl Acad Sci U S A. 2006;103:1412–7. doi: 10.1073/pnas.0510310103. [DOI] [PMC free article] [PubMed] [Google Scholar]
- 37.Valleron W, Laprevotte E, Gautier EF, et al. Specific small nucleolar RNA expression profiles in acute leukemia. Leukemia. 2012;26:2052–60. doi: 10.1038/leu.2012.111. [DOI] [PubMed] [Google Scholar]
- 38.Rucker FG, Schlenk RF, Bullinger L, et al. TP53 alterations in acute myeloid leukemia with complex karyotype correlate with specific copy number alterations, monosomal karyotype, and dismal outcome. Blood. 2012;119:2114–21. doi: 10.1182/blood-2011-08-375758. [DOI] [PubMed] [Google Scholar]
- 39.Higuchi M, O’Brien D, Kumaravelu P, Lenny N, Yeoh EJ, Downing JR. Expression of a conditional AML1-ETO oncogene bypasses embryonic lethality and establishes a murine model of human t(8;21) acute myeloid leukemia. Cancer Cell. 2002;1:63–74. doi: 10.1016/s1535-6108(02)00016-8. [DOI] [PubMed] [Google Scholar]
- 40.Kuo YH, Landrette SF, Heilman SA, et al. Cbf beta-SMMHC induces distinct abnormal myeloid progenitors able to develop acute myeloid leukemia. Cancer Cell. 2006;9:57–68. doi: 10.1016/j.ccr.2005.12.014. [DOI] [PubMed] [Google Scholar]
- 41.Westervelt P, Lane AA, Pollock JL, et al. High-penetrance mouse model of acute promyelocytic leukemia with very low levels of PML-RARalpha expression. Blood. 2003;102:1857–65. doi: 10.1182/blood-2002-12-3779. [DOI] [PubMed] [Google Scholar]
- 42.Corral J, Lavenir I, Impey H, et al. An Mll-AF9 fusion gene made by homologous recombination causes acute leukemia in chimeric mice: a method to create fusion oncogenes. Cell. 1996;85:853–61. doi: 10.1016/s0092-8674(00)81269-6. [DOI] [PubMed] [Google Scholar]
- 43.Kelly LM, Gilliland DG. Genetics of myeloid leukemias. Annu Rev Genomics Hum Genet. 2002;3:179–98. doi: 10.1146/annurev.genom.3.032802.115046. [DOI] [PubMed] [Google Scholar]
- 44.Payton JE, Grieselhuber NR, Chang LW, et al. High throughput digital quantification of mRNA abundance in primary human acute myeloid leukemia samples. J Clin Invest. 2009;119:1714–26. doi: 10.1172/JCI38248. [DOI] [PMC free article] [PubMed] [Google Scholar]
- 45.Di Croce L, Raker VA, Corsaro M, et al. Methyltransferase recruitment and DNA hypermethylation of target promoters by an oncogenic transcription factor. Science. 2002;295:1079–82. doi: 10.1126/science.1065173. [DOI] [PubMed] [Google Scholar]
- 46.Figueroa ME, Abdel-Wahab O, Lu C, et al. Leukemic IDH1 and IDH2 mutations result in a hypermethylation phenotype, disrupt TET2 function, and impair hematopoietic differentiation. Cancer Cell. 2010;18:553–67. doi: 10.1016/j.ccr.2010.11.015. [DOI] [PMC free article] [PubMed] [Google Scholar]
- 47.Figueroa ME, Skrabanek L, Li Y, et al. MDS and secondary AML display unique patterns and abundance of aberrant DNA methylation. Blood. 2009;114:3448–58. doi: 10.1182/blood-2009-01-200519. [DOI] [PMC free article] [PubMed] [Google Scholar]
- 48.Hansen KD, Timp W, Bravo HC, et al. Increased methylation variation in epigenetic domains across cancer types. Nat Genet. 2011;43:768–75. doi: 10.1038/ng.865. [DOI] [PMC free article] [PubMed] [Google Scholar]
- 49.Wu H, Coskun V, Tao J, et al. Dnmt3a-dependent nonpromoter DNA methylation facilitates transcription of neurogenic genes. Science. 2010;329:444–8. doi: 10.1126/science.1190485. [DOI] [PMC free article] [PubMed] [Google Scholar]
Associated Data
This section collects any data citations, data availability statements, or supplementary materials included in this article.
Supplementary Materials
Supplement1