Extracellular Vesicle–Mediated Transfer of a Novel Long Noncoding RNA TUC339: A Mechanism of Intercellular Signaling in Human Hepatocellular Cancer (original) (raw)
Abstract
Although the expression of long noncoding RNA (lncRNA) is altered in hepatocellular cancer (HCC), their biological effects are poorly defined. We have identified lncRNA with highly conserved sequences, ultraconserved lncRNA (ucRNA) that are transcribed and altered in expression in HCC. Extracellular vesicles, such as exosomes and microvesicles, are released from tumor cells and can transfer biologically active proteins and RNA across cells. We sought to identify the role of vesicle-mediated transfer of ucRNA as a mechanism by which these novel lncRNA could influence intercellular signaling with potential for environmental modulation of tumor cell behavior. HCC-derived extracellular vesicles could be isolated from cells in culture and taken up by adjacent cells. The expression of several ucRNA was dramatically altered within extracellular vesicles compared to that in donor cells. The most highly significantly expressed ucRNA in HCC cell–derived extracellular vesicles was cloned and identified as a 1,198-bp ucRNA, termed TUC339. TUC339 was functionally implicated in modulating tumor cell growth and adhesion. Suppression of TUC339 by siRNA reduced HCC cell proliferation, clonogenic growth, and growth in soft agar. Thus, intercellular transfer of TUC339 represents a unique signaling mechanism by which tumor cells can promote HCC growth and spread. These findings expand the potential roles of ucRNA in HCC, support the existence of selective mechanisms for lncRNA export from cells, and implicate extracellular vesicle–mediated transfer of lncRNA as a mechanism by which tumor cells can modulate their local cellular environment. Intercellular transfer of functionally active RNA molecules by extracellular vesicles provides a mechanism that enables cells to exert genetic influences on other cells within the microenvironment.
Keywords: liver cancer, extracellular vesicles, gene expression, RNA genes, paracrine signaling
Introduction
Cells can use a variety of approaches to communicate with each other such as direct membrane-to-membrane contact, release of soluble mediators, and secretion of small vesicles.1 Exosomes are small extracellular vesicles, ~50 to 100 nm in diameter, secreted from multivesicular endosomes by a variety of cell types. Exosomes and other extracellular vesicles can be secreted by tumor cells and can be taken up by adjacent cells with the intercellular transfer of biologically active contents such as proteins and mRNA.2,3 In recent studies, we found that hepatocellular cancer (HCC) cell–derived extracellular vesicles can modulate cell signaling and gene expression via the transfer of microRNAs (miRNAs).4 The involvement of other noncoding RNA, such as long noncoding RNA (lncRNA), in cancer is becoming increasingly recognized. However, a role for lncRNA as intercellular signaling mediators has not been defined, and the potential of extracellular vesicles to transfer lncRNA is unknown.
We hypothesized that extracellular vesicle–mediated transfer of lncRNAs could be an important mechanism in the development of HCC. We have recently examined the involvement of ultraconserved RNAs (ucRNAs) in HCC.5 ucRNAs are a group of lncRNAs transcribed from ultraconserved elements (UCEs), genomic sequences greater than 200 bases that are 100% conserved across human, mouse, and rat genomes.6 A total of 481 UCEs have been reported, with both ubiquitous and tissue-specific transcriptional activity identified in normal human tissues for the majority of these.7 These UCEs are frequently located at fragile sites and genomic regions involved with cancers. Moreover, deregulated expression of ucRNA has been reported in several cancers with differential expression of about 9% of ucRNAs in leukemia and colon cancer.7 We identified and cloned the ucRNA TUC338 that is overexpressed in HCC and can modulate cell cycle progression and proliferation.5 Despite this emerging evidence implicating a role of ucRNA in tumor growth and progression, the precise role of these novel RNA genes remains obscure. Thus, our aims were to evaluate the potential role of extracellular vesicles in mediating intercellular transfer of ucRNA to effect gene changes and modulate target cell behavior. Our studies identified selective enrichment of ucRNA in HCC-derived extracellular vesicles and characterized a candidate ucRNA involved in intercellular signaling that can modulate gene expression and tumor cell behavior.
Results
Morphological analysis of extracellular vesicles released from HCC cells
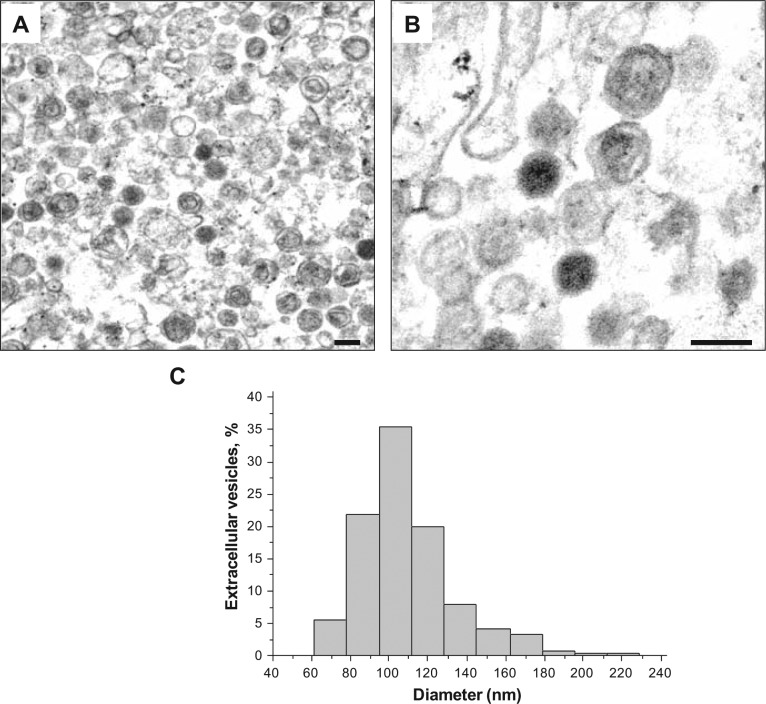
First we examined the morphological appearance of extracellular vesicles isolated by differential ultracentrifugation and density gradient centrifugation from culture medium of PLC/PRF/5 cells by performing ultrathin section transmission electron microscopy. The vesicles were homogeneous in size and morphology. Morphologically, the vesicles had a characteristic appearance of exosomes with a membrane-capsulated spherical shape (Fig. 1A, B). The internal content of most of the vesicles had a faint structure–like appearance with dense homogeneous material observed in a subset. The median size of the vesicles was 105 nm with a range of 62 to 229 nm (Fig. 1C), similar to the reported size of exosomes.8 Nanoparticle tracking analysis identified a yield of 5,563 ± 395 vesicles/cell, when initial plating density was 105 cells/plate. Furthermore, density gradient centrifugation identified that the sedimentation characteristics were consistent with those reported for exosomes. Thus, based on their morphology, size, and density, the extracellular vesicle used for these studies comprised exosomes. However, because exosomes are a specific population of vesicles with a distinctive biogenesis, we have used the term extracellular vesicles in this report.
Figure 1.
Transmission electron microscopy (TEM) of extracellular vesicles isolated from HCC cells. Morphology of PLC/PRF/5-derived extracellular vesicles was examined by ultrathin section TEM using an EM208S Electron Microscope (Philips). (A) Low magnification. (B) High magnification; scale bar, 100 nm. (C) The sizes of vesicles were analyzed using NIH Image J software (National Institutes of Health). The histogram shows the distribution of the size of vesicles.
Internalization of extracellular vesicles
We evaluated whether tumor cell–derived extracellular vesicles could be taken up by other cell types. Extracellular vesicles were obtained from Hep3B cells and labeled with green fluorescent dye PKH67. Subsequently, HepG2 cells were incubated with labeled vesicles for 24 hours. Fluorescence microscopy identified internalization of vesicles which appeared as endosome-like cytoplasmic vesicles in HepG2 cells (Fig. 2).
Figure 2.

Internalization of Hep3B-derived extracellular vesicles into other cells. HepG2 cells in culture were incubated with Hep3B-derived extracellular vesicles labeled with PKH67 green dye for 24 hours. Cells are fixed with methanol at −20°C and mounted with ProLong Gold Antifade Reagent with DAPI (Molecular Probes). Images were obtained using a fluorescent microscope (Nikon Eclipse 80i, Nikon Instruments Inc.). (A) DAPI (blue), (B) PKH67 (green), and (C) Merge. Hep3B-derived extracellular vesicles are shown to be internalized into the cytoplasm of HepG2 cells.
Profiling of ultraconserved RNAs in extracellular vesicles
In recent studies, we have identified aberrant expression lncRNA in HCC cells. The potential of lncRNA as a mediator of intercellular signaling is unknown. Thus, we sought to determine whether lncRNA could be transferred within extracellular vesicles and to evaluate the potential of these RNA to function as mediators of intercellular communication to modulate gene expression and biological behaviors in HCC.
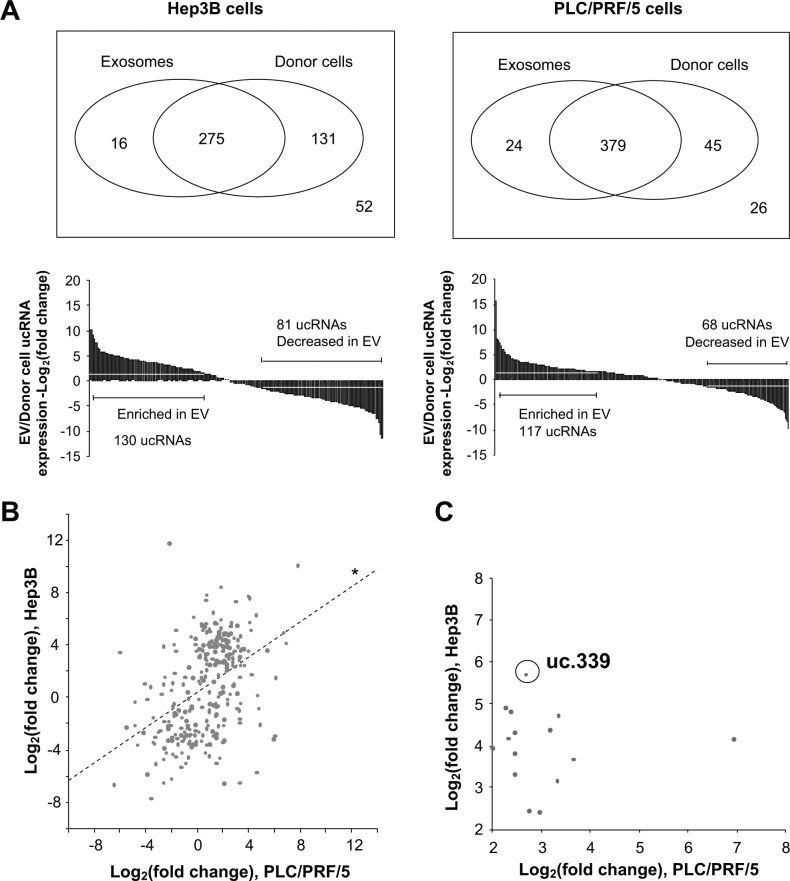
We began by examining ucRNA expression in Hep3B and PLC/PRF/5 HCC cells and in extracellular vesicles derived from these cells. The expression of 474 ucRNAs and selected other RNA control genes (18S ribosomal RNA, 5S ribosomal RNA, and U6) were measured by qRT-PCR in 4 independent samples for each cell line/extracellular vesicle pair. A total of 290 ucRNAs were identified in extracellular vesicles isolated from Hep3B cells. Of these, 211 ucRNAs were differentially expressed in extracellular vesicles by more than 4-fold compared to expression in their donor cells. Of these, 130 ucRNAs were enriched (up to 3,477-fold) and 81 miRNAs were decreased (up to 205-fold). We identified 16 ucRNAs that were detected exclusively in extracellular vesicles, indicating a very high enrichment in extracellular vesicles compared to donor cells (Fig. 3A). Similar observations were made in PLC/PRF/5-derived extracellular vesicles, with 185 ucRNAs differentially expressed in extracellular vesicles more than 4-fold compared to the donor cells. Of these, 117 ucRNAs were enriched (up to 899-fold), 68 miRNAs were decreased (up to 868-fold), and 24 ucRNAs detected exclusively in extracellular vesicles. There was a moderate correlation between ucRNA expression levels in extracellular vesicles isolated from the 2 cell lines (Fig. 3B). These data show dramatic differences in ucRNA between extracellular vesicles and the cells from which they originate and support the existence of selective mechanisms to govern the ucRNA content of extracellular vesicles.
Figure 3.
ucRNA expression in extracellular vesicles (EV) and their donor cells. Profiling of ucRNAs was performed using quantitative RT-PCR, and the expression level of each ucRNA in extracellular vesicles was normalized using the median threshold cycle (CT) value and expressed relative to their donor cells. (A) The mean values of fold change of expression of ucRNA detected in extracellular vesicles relative to that in donor cells is shown (n = 4) and the numbers of ucRNA that were exclusively detected in either donor cells or extracellular vesicles are depicted. A total of 291 ucRNAs were identified in Hep3B-derived extracellular vesicles, and 403 ucRNAs in PLC/PRF/5-derived extracellular vesicles. (B) Correlation of ucRNA expression in Hep3B-derived extracellular vesicles and in PLC/PRF/5-derived extracellular vesicles are shown. A total of 279 ucRNAs were detected in extracellular vesicles from both Hep3B and PLC/PRF/5. *, coefficient, .434; P < 0.0001. (**C**) ucRNAs with fold change >4 and P < 0.05 in both Hep3B and PLC/PRF/5 are plotted. uc.339 was identified to be one of highly expressed ucRNAs in extracellular vesicles secreted from both Hep3B and PLC/PRF/5.
Fourteen ucRNAs were significantly enriched with greater than 4-fold change and with t test P < 0.05 in both Hep3B- and PLC/PRF/5-derived extracellular vesicles (Fig. 3C) compared to their cells of origin. Among these, uc.339 was one of the most highly expressed ucRNAs, with expression increased by 51.7-fold in Hep3B-derived and 6.4-fold in PLC/PRF/5-derived extracellular vesicles. Incubation of Hep3B cells with 10 µg/mL HepG2-derived extracellular vesicles resulted in a 2.4-fold increase in cellular uc.339 expression. Thus, these data support a potential role for this ucRNA as a signaling mediator.
Identification of full-length TUC339
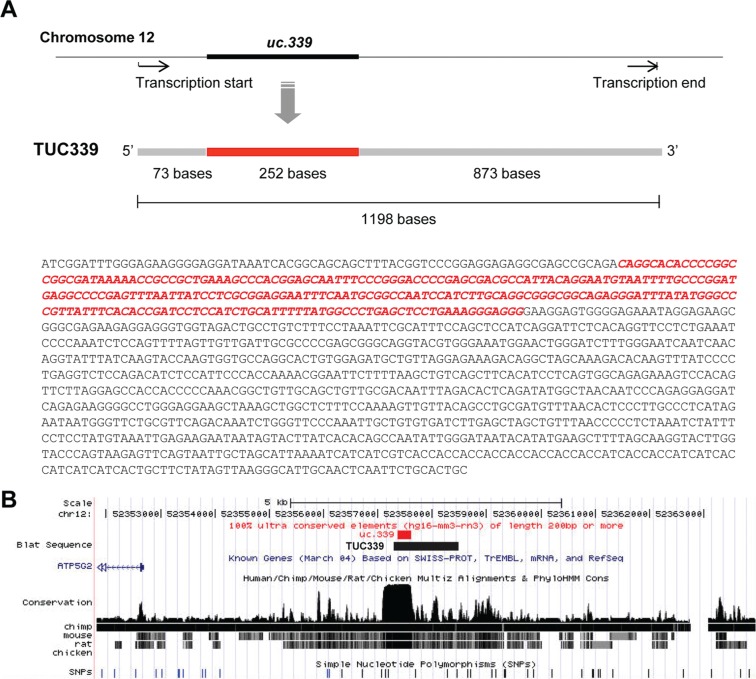
We next focused our efforts on further characterizing the uc.339 transcript to understand the relevance of these observations. The full-length transcript was cloned by RACE and designated as TUC339 (Suppl. Figs. 2 and 3). The TUC339 gene has a total of 1,198 bases, which include the 252nt ultraconserved (uc.339) sequence between positions +73 and +325 from the 3′-UTR. The genomic location of TUC339 is shown in Figure 4B. TUC339 does not overlap any confirmed protein-coding gene, and an open reading frame was not identified. The sequence of TUC339 was analyzed using GenScan 1.0 (http://genes.mit.edu/GENSCAN.html)9 to predict the potential genes or proteins. The analysis showed no potential sequence to produce a protein in TUC339.
Figure 4.
Cloning of TUC339. (A) Schematic representation of TUC339, the ultraconserved RNA transcribed from the region including uc.339. RACE cloning was performed using SMARTer RACE cloning kit (Clontech) to identify the sequence of full-length TUC339. The complete sequence of TUC339 is shown with the uc.339 sequence identified by Bejerano et al.,6 shown in red. (B) Location of uc.339 and TUC339 in human genome in UCSC Genome Browser (http://genome.ucsc.edu/). No confirmed protein coding transcripts overlapping with TUC339 were reported.
TUC339 modulates tumor cell proliferation
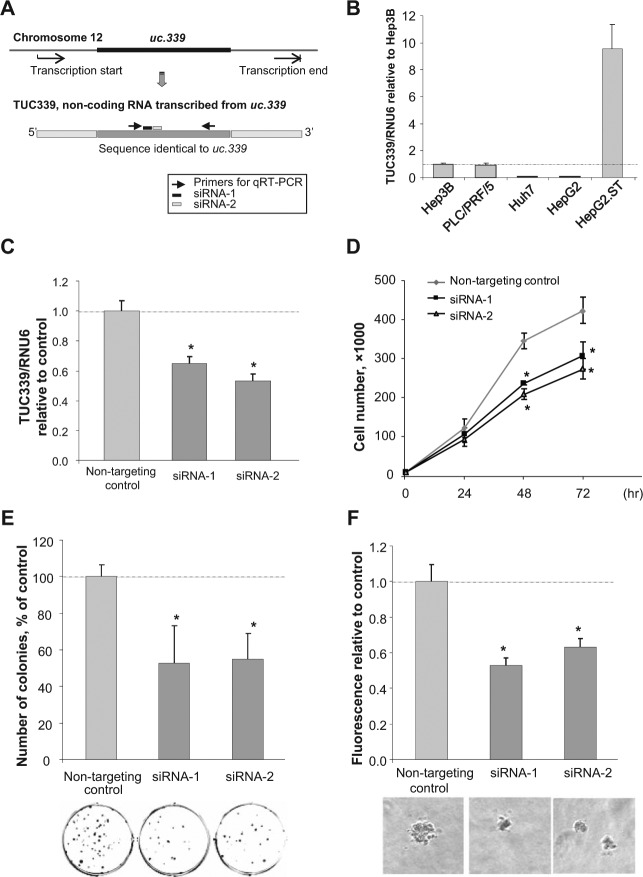
We examined the basal expression level of TUC339 in HCC cell lines. RNA was extracted from HCC cell lines in stable condition and qRT-PCR was performed (Fig. 5B). The highest expression of TUC339 was observed in HepG2.ST cells. To investigate the functional involvement of TUC339 in tumor cell biology, we first examined the effect of suppression of endogenous TUC339 in HepG2.ST cells by RNA interference targeting the ultraconserved region of TUC339 (Fig. 5A). Using 2 different siRNAs against TUC339, the expression of TUC339 was reduced by 64.6 ± 4.6% (siRNA-1) and by 53 ± 4.7% (siRNA-2) compared to nontargeting control (Fig. 5C). Anchorage-dependent cell growth was significantly reduced by 68.4 ± 1.3% (siRNA-1) and by 60.9 ± 4.0% (siRNA-2) at 48 hours and by 72.7 ± 8.3% (siRNA-1) and 64.9 ± 6.0% (siRNA-2) at 72 hours compared to nontargeting control (Fig. 5D). Clonogenic growth of HepG2.ST cells was also reduced by suppression of TUC339 with average colony number of 38.0 ± 14.4/well (siRNA-1) and 39.3 ± 10.2/well (siRNA-2) compared to nontargeting control (71.7 ± 4.7/well) (Fig. 5E). We also examined anchorage-independent growth by examining cell growth in soft agar. Compared with nontargeting controls, siRNAs against TUC339 reduced growth in soft agar of HepG2.ST cells by 53.1 ± 4.1% (siRNA-1) and 63.3 ± 4.6% (siRNA-2) (Fig. 7C).
Figure 5.
TUC339 knockdown decreases HCC cell proliferation. (A) Schematic representation of uc.339, TUC339, primers, and siRNAs. The location of the primers used for quantitative RT-PCR (qRT-PCR) and siRNAs are shown. (B) Basal expression level of TUC339 in human HCC cell lines. RNA was extracted from HCC cell lines using TRIzol reagent and qRT-PCR with SYBR green was performed. Expression of TUC339 was normalized using the expression of RNU6B and standardized to Hep3B. Bars express mean ± SE. (C) Knockdown efficiency of siRNAs against TUC339. HepG2.ST cells were transfected with siRNAs against TUC339 or nontargeting control (Dharmacon) using Lipofectamine 2000 (Invitrogen). After 48 hours cells were collected for qRT-PCR to detect TUC339 (C), or used for the following experiments (D-F). Bars represent the mean ± SEM. *, P < 0.05. (D) Growth curve assay. Cells were plated on 24-well plates at 1,000 cells per well and the number of viable cells in each well was counted using hemocytometer with trypan blue staining. Each plot represents mean ± SEM of 3 separate determinants. *, P < 0.05. (E) Clonogenic assay. Cells were plated on 6-well plates at 200 cells per well. After 7 days colonies were fixed and stained using neutralized buffered formalin containing 0.5% crystal violet. Images were taken and the number of the colonies were counted using NIH Image J software and expressed as a percentage of control. Data represent mean ± SEM of 3 determinants. *, P < 0.05. (F) Soft agar assay. Cells were plated in a 96-well plate with cell culture medium containing 0.4% agar at 600 cells per well over a base agar layer consisting of culture medium containing 0.6% agar. After incubation of 7 days, the number of colonies was evaluated fluorometrically. Bars represent the mean ± SEM of 6 separate determinations. *, P < 0.05.
Figure 7.
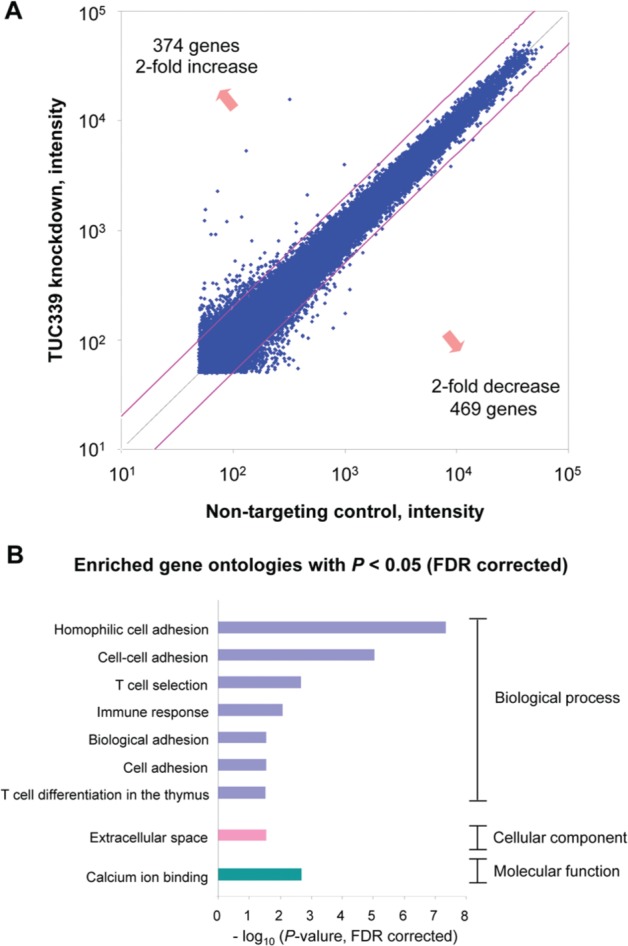
TUC339 knockdown alters gene expression. (A) A genome-wide expression analysis was performed by comparing the expression of genes in HepG2.ST cells with TUC339 knockdown to that with nontargeting control using NimbleGen gene expression 12 × 135K arrays (Roche NimbleGen). Differential expressions of genes are plotted (axis, intensity). (B) Enriched gene ontologies of genes with altered expression by TUC339 knockdown. Total 843 genes with fold change >2 or <2 were analyzed using DAVID v6.7 program. Enriched gene ontologies with P < 0.05 (false discovery rate corrected) are shown. FDR = false discovery rate.
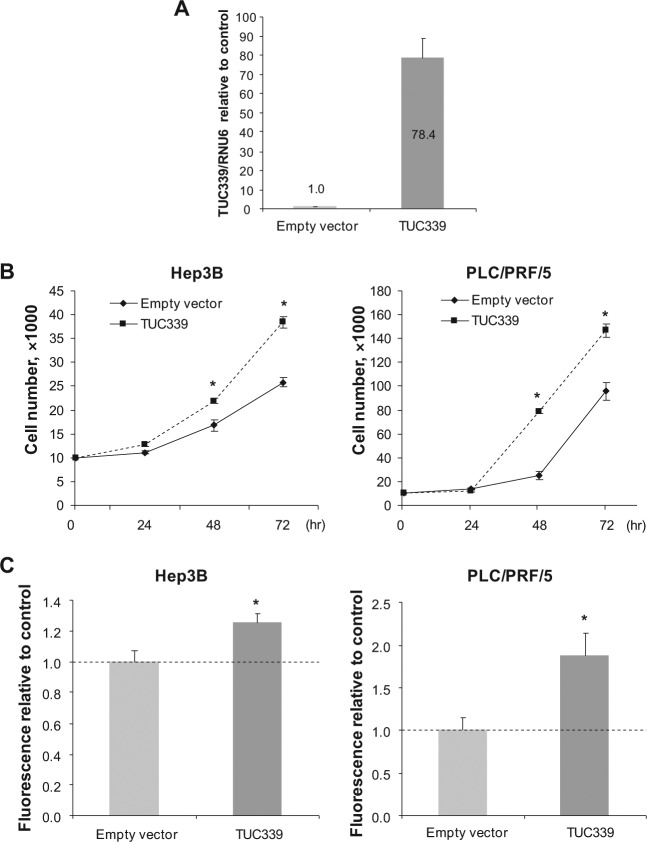
Next we investigated the effect of enforced expression of TUC339 in HCC cells. The full length of TUC339 was cloned into pcDNA3.1(+) expression vector (Invitrogen) downstream of the CMV promoter and upstream of the bovine growth hormone polyadenylation sequence to ensure the vector expresses only the transcript of TUC339 without any lengthy extrasequence or protein-coding vector sequences.10 Hep3B cells and PLC/PRF/5 cells were transfected with either TUC339 expression vector or empty vector controls. The expression of TUC339 in PLC/PRF/5 cells at 48 hours after transfection was increased by 78.4-fold compared to empty vector control (Fig. 6A). Enforced expression of TUC339 increased cell growth by 30.5% and 48.9% in Hep3B cells and 216.7% and 53.3% in PLC/PRF/5 cells at 48 hours and 72 hours, respectively (Fig. 6B). Likewise, transformed cell growth in soft agar was increased by 1.26-fold in Hep3B cells and 1.87-fold in PLC/PRF/5 cells compared to empty vector control (Fig. 6C). In combination, these studies show that suppression of endogenous TUC339 expression reduces, whereas enforced expression increases proliferation confirm the involvement of TUC339 in HCC cell growth.
Figure 6.
Enforced expression of TUC339 enhances cell growth. Cells were transfected with plasmids expressing full-length TUC339 or empty vector control using electroporation (Amaxa Nucleofector V kit, Lonza), and after 48 hours cells were used for anchorage-dependent and anchorage-independent growth assays. (A) Quantitative RT-PCR for TUC339. RNA was extracted from PLC/PRF/5 cells at 48 hours after transfection and qRT-PCR was performed. The expression of TUC339 was expressed relative to that with empty vector control. Bars represent mean ± SEM of 3 determinants. (B) Growth curve assay. Cells were plated on 24-well plates at 1,000 cells per well and the number of viable cells in each well was counted using hemocytometer with trypan blue staining. Each plot represents mean ± SEM of 3 separate determinants. *, P < 0.05. (C) Soft agar assay. Cells were plated in a 96-well plate with cell culture medium containing 0.4% agar at 600 cells per well over a base agar layer consist of culture medium containing 0.6% agar. After incubation of 7 days, the number of colonies was evaluated fluorometrically. Bars represent the mean ± SEM of 6 separate determinations. *, P < 0.05.
Genome-wide gene expression analysis
To investigate the involvement of TUC339 in biological functions of HCC we performed genome-wide gene expression analysis using Human 12x 135K Gene Expression Array (Roche NimbleGen). The genome-wide gene expression was compared between HepG2.ST cells transfected with siRNA against TUC339 (siRNA-2) and with nontargeting control (Dharmacon). By suppression of TUC339 expression in HepG2.ST cells, a total of 843 genes were detected to show differential expression with 2-fold change (374 genes increased and 469 genes decreased) as shown in Figure 7A. Full lists of differentially expressed genes are available in the supplementary data. The DAVID gene functional classification tool revealed a significant enrichment of 9 gene ontologies with false discovery rate corrected P value less than 0.05 (Fig. 7B). Interestingly, 4 gene ontologies related with cell adhesion were identified. Specific differentially expressed genes implicated in cell adhesion are listed in the supplementary data.
TUC339 reduces HCC cell adhesion to extracellular matrix
Since the genome-wide gene expression analysis implicated the involvement of TUC339 in cell adhesion, we next investigated the effect of TUC339 modulation on cell adhesion in HCC cells. Attachment assay was performed to assess the adhesion of Hep3B, PLC/PRF/5, and HepG2.ST cells to extracellular matrix. When 12,500, 25,000, and 50,000 cells/wells were seeded, the percentage of attached Hep3B cells transfected with TUC339 was 12.3 ± 0.4%, 12.7 ± 0.6%, and 10.2 ± 0.1%, whereas the percentage of attached cells transfected with empty vector control was 8.9 ± 1.1%, 8.5 ± 0.3%, and 6.1 ± 0.1%, respectively (Fig. 8A). Similar results were obtained with PLC/PRF/5 cells (Fig. 8A). Subsequently, we evaluated the effect of suppression of TUC339 using siRNA-2 in HepG2.ST cells. The percentage of attached cells transfected with siRNA-2 was 11.2 ± 0.3%, 10.1 ± 0.1%, and 10.7 ± 0.5% in HepG2 cells at 12,500, 25,000, and 50,000 cells/well, compared to 13.1 ± 0.1%, 12.3±± 0.2%, and 12.3 ± 0.3% in HepG2.ST cells transfected with control, respectively (Fig. 8B).
Figure 8.
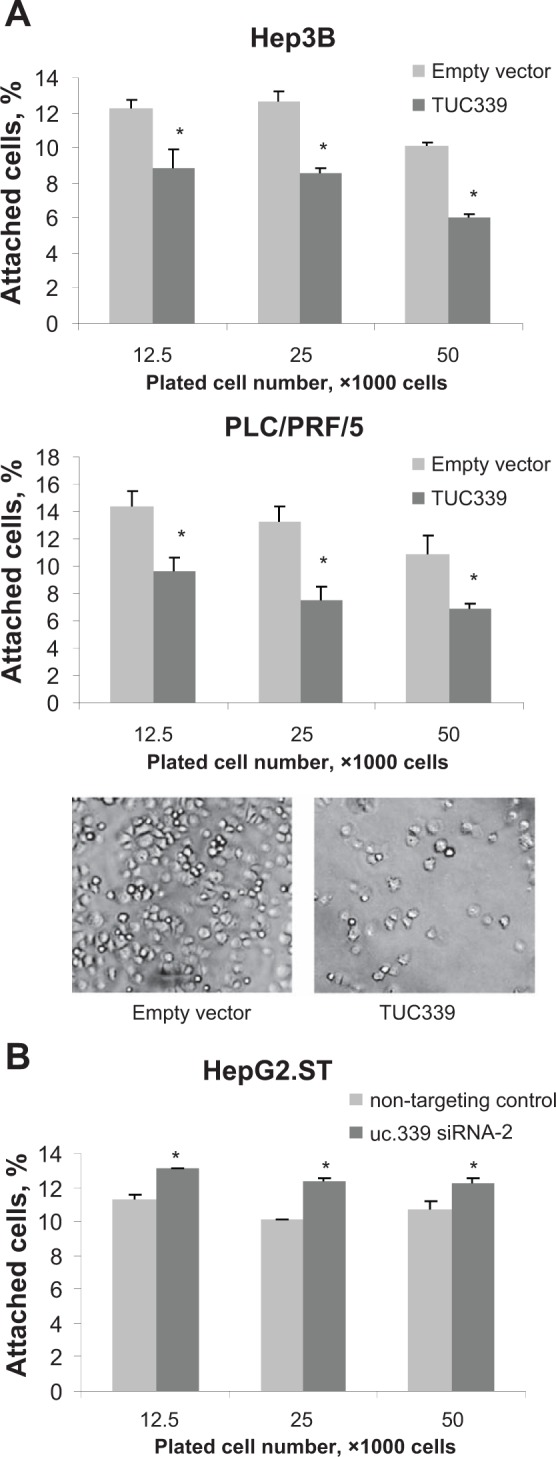
Enforced TUC339 expression modulates cell attachment. Hep3B and PLC/PRF/5 cells transfected with TUC339 expression vector or empty vector control and HepG2.ST cells transfected with siRNA against TUC339 or nontargeting control cells were labeled with green fluorescent dye (CellTrackerGreen CMFDA, Invitrogen), seeded on a collagen I-coated 96-well plate and incubated at 37°C for 30 minutes. Cells were washed with serum-free medium and fluorescence was measured before and after washing. The number of cells attached to the plate was estimated based on the change in fluorescence before and after the wash. (A) Hep3B and PLC/PRF/5 with representative images of PLC/PRF/5 cells after washing at 50,000 cells per well. Bars express mean ± SEM of 3 studies, *, P < 0.05. (B) HepG2.ST. Bars express mean ± SEM of 3 studies, *, P < 0.05.
Discussion
In these studies, we demonstrate that HCC cell–derived extracellular vesicles contain ucRNA and that these extracellular vesicles can be taken up by other HCC cells resulting in intercellular transfer of ucRNA with subsequent modulation of cellular function. The expression of several of these lncRNA is dramatically different in extracellular vesicles from that in the cells of origin. TUC339 was identified as one of the most highly selectively enriched ucRNA in tumor cell–derived extracellular vesicles. These observations extend the role of extracellular vesicles in mediating intercellular transfer of cellular constituents by identifying vesicles containing lncRNA as biologically functional active signaling intermediates. These studies also identify a novel lncRNA gene that is capable of functioning as an intercellular signaling mediator and modulating tumor cell behavior.
Active transcription and expression of a large number of nonprotein coding RNAs has been identified by whole genome transcriptome analysis in mammalian cells.11-13 These noncoding RNA subserve several diverse functions, which include crucial roles in the regulation of gene expression and biological processes during cancer development. Among these, the microRNAs have been extensively studied, and deregulated expression of miRNA has been implicated in essential biological functions involved in tumorigenesis.14,15 It is likely that other noncoding RNA, such as the lncRNAs, may be involved in human cancers although they have been less well studied. LncRNA such as Air, Hotair, and Xist are involved in aberrant epigenetic gene regulation in cancers.16 Deregulated expression of some lncRNA occurs in HCC but their contribution to tumor formation or growth is largely unknown. Despite the large numbers of lncRNA, very few lncRNAs such as H19, MEG3 12, MALAT-1, HULC, and the ucRNA TUC338 have been implicated in hepatocarcinogenesis.17-21 Our studies have identified an additional lncRNA, TUC339 involved in HCC, and which has a novel role as an intercellular signaling mediator. Both TUC338 and TUC339 can modulate transformed cell growth in hepatocytes. However, TUC339 is highly enriched within extracellular vesicles whereas TUC338 is not, suggesting that these 2 ucRNA may play different roles.
These findings extend the known biological roles of ucRNA and possibly other lncRNA as well to intercellular signaling and environmental modulation of cellular processes in hepatocarcinogenesis. A biological role of these novel RNA genes in HCC growth is supported by the existence of specific mechanisms for selective enrichment within extracellular vesicles and their impact on tumor cell growth. Our studies provide one of the first evidences that ucRNA can function as intercellular signaling intermediates. These observations are of critical functional importance because they extend the influence of the regulatory roles played by these and other lncRNA and indicate potential contributions in maintenance of tissue homeostasis as well as to the intercellular interactions that may contribute to cancer growth and progression.
Extracellular vesicle–mediated transfer of lncRNA such as TUC339 thus represents a unique mechanism by which tumor cells can modulate their environment and promote HCC growth. While the focus of our studies has been on the potential role of lncRNA as signaling mediators, there is information from several studies that provides additional biological or therapeutic roles for extracellular vesicles in general. These include roles as delivery agents for drugs, vaccines, and gene therapy vectors. Thus, information regarding the RNA content is likely to have broader importance. The ability to detect and isolate extracellular vesicles from the circulation emphasizes the potential for selective extracellular vesicle RNA content as biomarkers of disease. Based on our findings, further studies to evaluate such extracellular vesicle ucRNA as potential markers for HCC are warranted.
Materials and Methods
Cell lines and culture
Human HCC cell lines, Hep3B, HepG2, and PLC/PRF/5, were obtained from the American Type Culture Collection (Manassas, VA). HepG2.ST, which express high levels of the uc.339 transcript, were obtained from HepG2 cells by spontaneous transformation. Compared to HepG2 cells, HepG2.ST cells have increased proliferation and lower levels of expression of α-fetoprotein and α-1 antitrypsin-1 (Suppl. Fig. S1). All cell lines were authenticated by short tandem repeat analysis using Identifiler (Applied Biosystems, Carlsbad, CA). Cells were maintained in Dulbecco’s modified Eagle’s medium (Invitrogen, Carlsbad, CA) containing 10% fetal bovine serum and 1% antibiotic-antimycotic (Invitrogen) at 37°C with 5% CO2. For extracellular vesicle studies, vesicle depleted (VD) medium was prepared by centrifuging cell-culture medium at 100,000_g_ overnight to spin down any preexisting vesicular content.
Isolation of HCC cells–derived vesicles
Extracellular vesicles released from HCC cells were isolated from culture media by sequential ultracentrifugation and density gradient separation using protocols similar to those described previously.4 Briefly, HCC cells were plated with VD medium on collagen-coated 10-cm dishes for 3 to 4 days prior to collection of extracellular vesicles. The isolated extracellular vesicles were used immediately or resuspended in phosphate buffered saline (PBS) and stored at −80°C. Isolated vesicles were analyzed using nanoparticle tracking analyses (Nanosight, Worthington, OH) for quantitation and size determination.
Transmission electron microscopy
Pellets of vesicles were fixed with 2.5% glutaraldehyde, postfixed with 1% osmium tetroxide, and embedded. Ultrathin sections were stained with uranyl acetate and lead citrate, and images were obtained using an EM208S transmission electron microscope (Philips, Eindhoven, the Netherlands). The size of vesicles was assessed using NIH image J software (National Institutes of Health, Bethesda, MD).
Cellular internalization of Hep3B-derived extracellular vesicles
Hep3B-derived extracellular vesicles were labeled with PKH67 (Sigma-Aldrich, St. Louis, MO) as previously reported.4 The labeled extracellular vesicles were added onto HepG2 cells cultured in a 4-chamber slide. After incubation for 24 hours, cells were fixed with methanol, mounted with ProLong Gold Antifade Reagents with DAPI (Molecular Probes, Inc., Eugene, OR), and examined by fluorescence microscopy (Nikon Eclipse 80i, Nikon Instruments, Inc., Tokyo, Japan).
Ultraconserved RNA profiling in extracellular vesicles
Expression profiling of 474 ultraconserved RNAs (ucRNAs) was performed using an Applied Biosystems 7900HT real-time PCR instrument equipped with a 384-well reaction plate as previously described.4 RNA samples from extracellular vesicles or donor cells (n = 4 per each cell line) were treated with DNase I (Qiagen Inc., Valencia, CA). A total of 600 ng of DNase-treated RNA was reverse transcribed using SuperScript II transcriptase and random primers (Invitrogen). Real-time PCT was performed and the cycle number at which the reaction crossed a threshold (CT) was determined for each gene. Raw CT values were normalized using a median CT value (ΔCT = CTucRNA − CTmedian), and the relative amount of each ucRNA in extracellular vesicles relative to donor cells (fold change) was described using the equation 2−ΔΔCT where ΔΔCT = ΔCTextracellular vesicle − ΔCTdonor cell. Profiling data are reported in the supplementary data.
Quantitative Reverse-Transcriptase Polymerase Chain Reaction (qRT-PCR)
cDNA was transcribed from a total of 300 ng of DNase I-treated RNA using the cDNA reverse transcription kit and random primers (iScript cDNA synthesis kit, BioRad, Hercules, CA). qRT-PCR was performed using a Mx3000p System (Stratagene, La Jolla, CA) to detect uc.339/TUC339 (ucRNA transcribed from uc.339), and U6 small nuclear RNA (RNU6) with SYBR green I (SYBR Advantage qPCR Premix, Clontech, Mountain View, CA). The following PCR primers were used: TUC339 primers, sense: 5′-GATGAGGCCCCGAGTTTAAT-3′, antisense: 5′-AGATGGAGGATCGGTGTGAA-3′, U6, sense: 5′- CTCGCTTCGGCAGCACA-3′, antisense: 5′-AACGCTTCACGAATTTGCGT-3′.
RACE cloning
3′ and 5′ Rapid amplification of cDNA ends (RACE) was performed using SMARTer RACE cDNA Amplification Kit (Clontech) to characterize 5′ and 3′ sequences of the gene encoding uc.339. Total RNA was extracted from HepG2.ST cells using TRIzol reagent (Invitrogen) and polyadenylated using the poly(A) tailing kit (Ambion, Austin, TX). RACE-ready cDNA was generated, and cDNA ends were amplified with Universal primer mix and gene-specific primers. PCR products were then run in a 1.0% agarose gel, and DNA was extracted, cloned into pCR8/GW/TOPO vector (Invitrogen), and sequenced with a sequence analyzer (ABI PRISM 3730xl DNA Analyzer, Applied Biosystems). Gene-specific primers of TUC339 used for RACE were as follows (5′ to 3′): GSP1 (5′ RACE), CCCTCCCTTTCAGGAGCTCAGGGCCATA; GSP2 (3′ RACE), GGAGGAATTTCAATGCGGCCAATCCATC.
Transfection of siRNAs to TUC339
HCC cells were transfected with siRNAs using Lipofectamine 2000 reagent (Invitrogen). siRNAs were designed using siDESIGN (Dharmacon, Lafayette, CO) with an input of the complete sequence of uc.339. The 2 highest-ranked target sequences were synthesized as ON TARGET siRNA (5′ to 3′): siRNA-1, GGAAUUUCAAUGCGGCCAA and siRNA-2, UUGGCCGCAUUGAAAUUCC. Cells were transfected with siRNAs to TUC339 or nontargeting control (ON TARGET Plus siCONTROL Nontargeting pool, Dharmacon) at a concentration of 100 nM. Cells were collected after 48 hours for further study.
Transfection of TUC339 expression vector
Full length of TUC339 was cloned into pcDNA3.1(+) (Invitrogen). Primers that incorporated 5′ BamHI and 3′ XhoI restriction sites were used to amplify the full-length TUC339 transcript. PCR products were digested with BamHI and XhoI (Promega) and cloned into the pcDNA3.1(+) vector. HCC cells were transfected with 2 µg of TUC339 expressing vector or empty vector control using electroporation (Amaxa Nucleofector V kit, Lonza, Basel, Switzerland) with T-28 program, and after 48 hours cells were used for further experiments.
Genome-wide gene expression analysis
HepG2.ST cells were transfected with either siRNA against TUC339 or nontargeting control and RNA was extracted. Genome-wide gene expression analysis was performed with the Human 12x 135K Gene Expression Array (Roche NimbleGen, Inc., Madison, WI). Data were extracted and analyzed with GeneSpring GX software ver. 11.5.1 (Agilent Technologies, Foster City, CA), and genes that were significantly differentially expressed were identified. Gene ontology analysis was performed using the Database for Annotation, Visualization, and Integrated Discovery v6.722,23 to identify enriched gene ontologies in genes with altered expression by TUC339 knockdown.
Cell growth assays
For anchorage-dependent growth assay, cells were plated (10,000 cells per well) in collagen-coated 24-well plates and the number of viable cells was counted using trypan blue staining at each time point. For clonogenic assay, cells were plated on collagen-coated 6-well plates at 200 cells per well. After 1 week cells were fixed and stained with 0.5% of crystal violet in 10% neutralized buffered formalin for 15 minutes. Numbers of colonies in each well were counted using NIH Image J software (National Institute of Health). For anchorage-independent cell growth assay, cells were plated in a growth medium containing 0.4% agar (600 cells per well) on a bottom layer of medium containing 0.6% agar. After 1 week of incubation, cell growth was assayed fluorometrically using alamarBlue (Biosource International, Camarillo, CA) and a FLUOstar Omega Microplate Reader (BMG Labtech, Offenburg, WI).
Attachment assay
Cells were harvested by trypsinization, resuspended in a serum-free medium containing 10 µM of green fluorescent dye (CellTrackerGreen CMFDA, Invitrogen), and incubated at 37°C for 30 minutes. After incubation cells were washed twice with serum-free medium and plated on a 96-well plate coated with rat tail collagen I (BD Biosciences, San Jose, CA) and incubated at 37°C for 30 minutes. Cells were gently washed with serum-free medium thrice to remove unattached cells. Cell fluorescence was measured before and after the wash using a FLUOstar Omega Microplate Reader (BMG Labtech, Offenburg, WI) with a fixed gain. The attached cell number was calculated using the fluorescence before and after the wash to remove unattached cells. There was a favorable linear correlation between fluorescence and seeded cell number (Suppl. Fig. S4).
Statistical analysis
Data were analyzed by ANOVA followed by Fisher’s PLSD test. Results were considered to be statistically significant when P < 0.05. Data were expressed as the mean and standard error.
Footnotes
Authors’ Note: The TUC339 sequence has been deposited in Genbank, accession number KC508659. Profiling data are reported in the supplementary data, and on publication will also be submitted to Vesiclepedia (www.microvesicles.org), an online compendium of molecular data from extracellular vesicles. The content is solely the responsibility of the authors and does not necessarily represent the official views of the National Institutes of Health (the funding agency).
Declaration of Conflicting Interests: The author(s) declared no potential conflicts of interest with respect to the research, authorship, and/or publication of this article.
Funding: The author(s) disclosed receipt of the following financial support for the research, authorship, and/or publication of this article: Research reported in this article was supported by the National Institute of Diabetes and Digestive and Kidney Diseases of the National Institutes of Health under Award Number R01DK069370.
References
- 1.Hui EE, Bhatia SN. Micromechanical control of cell-cell interactions. Proc Natl Acad Sci U S A. 2007;104:5722-6 [DOI] [PMC free article] [PubMed] [Google Scholar]
- 2.van Niel G, Porto-Carreiro I, Simoes S, Raposo G. Exosomes: a common pathway for a specialized function. J Biochem. 2006;140:13-21 [DOI] [PubMed] [Google Scholar]
- 3.Valadi H, Ekstrom K, Bossios A, Sjostrand M, Lee JJ, Lotvall JO. Exosome-mediated transfer of mRNAs and microRNAs is a novel mechanism of genetic exchange between cells. Nat Cell Biol. 2007;9:654-9 [DOI] [PubMed] [Google Scholar]
- 4.Kogure T, Lin WL, Yan IK, Braconi C, Patel T. Intercellular nanovesicle-mediated microRNA transfer: a mechanism of environmental modulation of hepatocellular cancer cell growth. Hepatology. 2011;54:1237-48 [DOI] [PMC free article] [PubMed] [Google Scholar]
- 5.Braconi C, Valeri N, Kogure T, et al. Expression and functional role of a transcribed noncoding RNA with an ultraconserved element in hepatocellular carcinoma. Proc Natl Acad Sci U S A. 2011;108:786-91 [DOI] [PMC free article] [PubMed] [Google Scholar]
- 6.Bejerano G, Pheasant M, Makunin I, et al. Ultraconserved elements in the human genome. Science. 2004;304:1321-5 [DOI] [PubMed] [Google Scholar]
- 7.Calin GA, Liu CG, Ferracin M, et al. Ultraconserved regions encoding ncRNAs are altered in human leukemias and carcinomas. Cancer Cell. 2007;12:215-29 [DOI] [PubMed] [Google Scholar]
- 8.Valenti R, Huber V, Iero M, Filipazzi P, Parmiani G, Rivoltini L. Tumor-released microvesicles as vehicles of immunosuppression. Cancer Res. 2007;67:2912-5 [DOI] [PubMed] [Google Scholar]
- 9.Burge C, Karlin S. Prediction of complete gene structures in human genomic DNA. J Mol Biol. 1997;268:78-94 [DOI] [PubMed] [Google Scholar]
- 10.Mohamed JS, Gaughwin PM, Lim B, Robson P, Lipovich L. Conserved long noncoding RNAs transcriptionally regulated by Oct4 and Nanog modulate pluripotency in mouse embryonic stem cells. RNA. 2010;16:324-37 [DOI] [PMC free article] [PubMed] [Google Scholar]
- 11.Sharp PA. The centrality of RNA. Cell. 2009;136:577-80 [DOI] [PubMed] [Google Scholar]
- 12.Pan Q, Shai O, Lee LJ, Frey BJ, Blencowe BJ. Deep surveying of alternative splicing complexity in the human transcriptome by high-throughput sequencing. Nat Genet. 2008;40:1413-5 [DOI] [PubMed] [Google Scholar]
- 13.Mortazavi A, Williams BA, McCue K, Schaeffer L, Wold B. Mapping and quantifying mammalian transcriptomes by RNA-Seq. Nat Methods. 2008;5:621-8 [DOI] [PubMed] [Google Scholar]
- 14.Ryan BM, Robles AI, Harris CC. Genetic variation in microRNA networks: the implications for cancer research. Nat Rev Cancer. 2010;10:389-402 [DOI] [PMC free article] [PubMed] [Google Scholar]
- 15.Croce CM. Causes and consequences of microRNA dysregulation in cancer. Nat Rev Genet. 2009;10:704-14 [DOI] [PMC free article] [PubMed] [Google Scholar]
- 16.Mercer TR, Dinger ME, Mattick JS. Long non-coding RNAs: insights into functions. Nat Rev Genet. 2009;10:155-9 [DOI] [PubMed] [Google Scholar]
- 17.Matouk IJ, Abbasi I, Hochberg A, Galun E, Dweik H, Akkawi M. Highly upregulated in liver cancer noncoding RNA is overexpressed in hepatic colorectal metastasis. Eur J Gastroenterol Hepatol. 2009;21:688-92 [DOI] [PubMed] [Google Scholar]
- 18.Matouk IJ, DeGroot N, Mezan S, et al. The H19 non-coding RNA is essential for human tumor growth. PLoS One. 2007;2:e845. [DOI] [PMC free article] [PubMed] [Google Scholar]
- 19.Lai MC, Yang Z, Zhou L, et al. Long non-coding RNA MALAT-1 overexpression predicts tumor recurrence of hepatocellular carcinoma after liver transplantation. Med Oncol. 2012;29:1810-6 [DOI] [PubMed] [Google Scholar]
- 20.Panzitt K, Tschernatsch MM, Guelly C, et al. Characterization of HULC, a novel gene with striking up-regulation in hepatocellular carcinoma, as noncoding RNA. Gastroenterology. 2007;132:330-42 [DOI] [PubMed] [Google Scholar]
- 21.Braconi C, Kogure T, Valeri N, et al. microRNA-29 can regulate expression of the long non-coding RNA gene MEG3 in hepatocellular cancer. Oncogene. 2011;30:4750-6 [DOI] [PMC free article] [PubMed] [Google Scholar]
- 22.Huang da W, Sherman BT, Lempicki RA. Systematic and integrative analysis of large gene lists using DAVID bioinformatics resources. Nat Protoc. 2009;4:44-57 [DOI] [PubMed] [Google Scholar]
- 23.Huang da W, Sherman BT, Lempicki RA. Bioinformatics enrichment tools: paths toward the comprehensive functional analysis of large gene lists. Nucleic Acids Res. 2009;37:1-13 [DOI] [PMC free article] [PubMed] [Google Scholar]
